
Abstract
The evolution of soft rock coastlines is strictly related to natural and anthropogenic conditions, which in some cases can determine also an acceleration of coastal retreat. The recent evolution of a soft rocky coastal stretch on the Italian southern Adriatic sector is analysed. To investigate the most important contributing factors to coastal evolution, a detailed multi-temporal (1954–2017) morphological analysis with photo-interpretation is carried out, which allows gaining a general understanding of the cliff evolution. The coastal retreat was then evaluated by exploiting the Digital Shoreline Analysis System (DSAS) tool. From that, site-specific analyses are carried out to explore the role of four environmental factors: rock mechanical properties, geostructural setup of the rock mass along the coast, emerged rock platform at the toe, and the storm waves. Analyses highlighted how the most significant retreat is detected along cliff segments characterized by the presence of low strength rocks susceptible to water-induced weakening, moderate fracturing degree of the rock mass, absence of the emerged platform at the toe, and wave storms. This work shows how a multi-scale methodology could represent an efficient approach to gain an interpretation of the instability processes and thus prepare risk mitigation plans and land management strategies.
1. Introduction
Shorelines are dynamic natural systems characterized by various phenomena that act at different temporal and spatial scales. They are highly susceptible to changes of the boundary conditions enhancing the acceleration of coastal retreat (Castedo et al. Citation2017; Prémaillon et al. Citation2018). Those can be natural factors (as sea-level rise, rainfalls or sea storms), and anthropogenic factors (as urbanization along the coastline). In particular, the coastal environment can be particularly vulnerable to extreme events. Severe sea storms and intense rainfalls are seen to increase in intensity and frequency, according to the worldwide acknowledged climate change, which is recognized to be particularly intense in the last years (Gariano and Guzzetti Citation2016). Hazards related to cliff instability have also increased over the last few decades due to the growing urbanization in the coastal areas and the rapid development of touristic activities. As such, people and man-made asset are more exposed to natural hazards affecting coastal environment. Therefore, the assessment of shoreline changes and associated risk is very important in order to develop appropriate coastal management plans (Caprioli et al. Citation2015).
In general, the interaction among marine, sub-aerial and anthropogenic processes affects cliff stability over time and, as such, needs to be quantified in order to assess hazard level (Brooks and Spencer Citation2010; Andriani and Pellegrini Citation2014; Sunamura Citation2015; Prémaillon et al. Citation2018; Gerivani et al. Citation2020). Cliff recession depends on a large set of factors, as rock structure (massive, bedding, faulted, fractured, granular), rock lithology and rock properties (permeability, solubility, mechanical strength), sea action (exposure to waves even loaded with debris, tides, currents) and subaerial weathering (wind action, rainfall surface and subsurface runoff, rainfall infiltration, chemical and biological processes). The most important hazard phenomena affecting the rocky coasts are represented by cliff mass movements and erosion, both resulting in cliff recession. Sunamura (Citation2015) has provided a relationship of cliff retreat against time, also highlighting those factors, highly variable in space and time, that control the cliff recession rates; moreover, the author describes the typical morphologies that characterize the coastlines depending on the type of rock materials (soft or hard rocks). Lithology plays a relevant role in the susceptibility to weathering and selective decay, since it represents a predisposing factor to rock fracturing and failure propagation. In fact, recession of hard rock cliffs is typically observed to be less than 1 cm/year, whereas soft cliffs, with poor physical and mechanical properties, retreat even more than 1 m/year (Budetta et al. Citation2000; Lim et al. Citation2010; Sunamura Citation2015); in these contexts, the presence of joints and faults within the rock mass forming the cliff generally accelerate the occurrence of instability processes (Trenhaile et al. Citation1998; Anfuso et al. Citation2013). Brooks and Spencer (Citation2010) presented a geomorphological study on cliff recession rates and corresponding sediment losses for the soft rock cliffs forming the Suffolk coast (UK), where shoreline retreat, reaching up to 3-4 m per year, have been inferred in the last century. Griggs et al. (Citation2019), instead, propose a quantitative assessment of cliff retreat in the Central California Coast area, based on geological history, geomorphological analysis and aerial photo analysis, which indicates a maximum cliff retreat rate of about 0.5 m/year. The meteo-marine conditions, as rainfalls, sea and wind erosion, including abrasion, corrosion, marine spray and thermal stresses, as well as wave impact stress during energetic sea storms, can represent the triggering factors of the instability processes, giving rise to the development of rock mass failures and consequent coastal retreat. Concerning the impact of wave action on rocky cliffs, recent studies have suggested that microseismic effects are generated by the energy of wave impact against cliffs (Adams et al. Citation2005; Pellicani et al. Citation2015; Cavaleri et al. Citation2019). Wave abrasion is the process of rock scraping and shattering by rock fragments moved forward and backward by wave-orbital motion (Antonioli et al. Citation2015). Weathering of soft porous rocks is instead related to drying and wetting cyclic processes (Ciantia et al. Citation2015) and salt crystallization (Andriani and Walsh Citation2007) within rock pores and fissures. The effect of sea water weathering on the strength decay of chalk outcropping throughout Northwest Europe and the relative impact on cliff stability has been clearly demonstrated by Duperret et al. (Citation2005) and Lawrence et al. (Citation2013). Marine dissolution processes are an important cause of degradation of carbonate rock cliffs too, when acid seawater and sea spray enter within cracks, joints and fissures (Sunamura Citation1992, Citation2015; Trenhaile Citation1997; Stephenson and Naylor Citation2010).
Regarding specifically the cliffs composed of soft rocks, Sunamura (Citation1992; Citation2015) describes the corresponding recession processes generally accompanying the development of sloping shore platforms. The retreat of soft rock cliffs is generally episodic and evolves through rockfalls, slidings and topplings, which in some cases are initially triggered by the undercutting of the cliff toe induced by wave impact, wave abrasion and weathering (Gong et al. Citation2018). Cliff retreat can be also worsened by the presence of karstic landforms and joint systems. Soft rock cliffs collapse may also be triggered by rainfall infiltration that generates mechanical degradation within rock matrix and joints as well as by rock cyclic stresses and fatigue processes induced by wave impact. In the medium and long term, sea level rise and tectonic set up should be also considered (Lambeck et al. Citation2011) along with seismic stresses for those regions subjected to earthquake hazard. Recently, Gong et al. (Citation2018), Lollino et al. (Citation2018) and Calista et al. (Citation2019) have proposed numerical geomechanical models aimed at interpreting the failure mechanisms of soft rock cliffs as calibrated by means of geomorphological evidences.
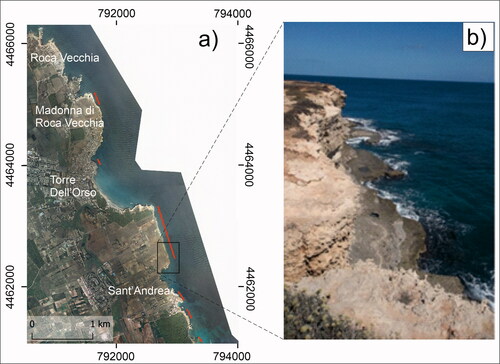
This paper aims at analysing the recent evolution (1954-2017) of a soft rocky coastal stretch belonging to Melendugno Municipality, located on the southern Adriatic sector of the Apulia region (south-eastern Italy; ), which is characterized by relatively fast coastal recession. In this area, the coastal hazard is represented by different types of instability processes affecting the soft rocky cliffs, ranging from concentrated and diffuse erosion to slides and rockfalls. Due to these threatening processes, since 2014 several ordinances of interdiction for any activity along the coastline have been declared by the Coast Guard in the study area.
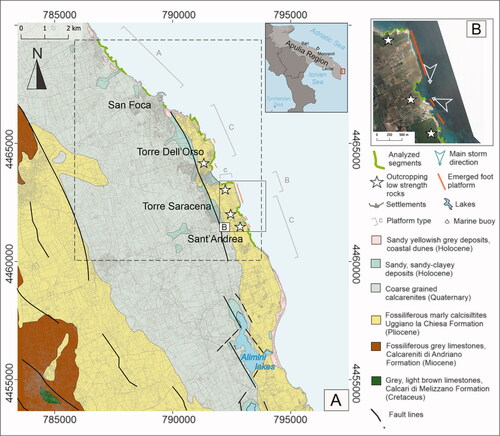
Figure 1. A: Informative map of the study area (black dotted square) and its surroundings summarizing the most relevant features. Simplified geological sketch of the study area modified after the geological sheet 1:100.000 (“Carta Geologica d’Italia”, Foglio 214 “Gallipoli”, Ispra). Tectonic alignments are extracted from Sansò et al. (Citation2016). Platform types follow Sunamura classification (Sunamura Citation1992, Citation2015). B: Detail of the sector 7, with indication of the prevailing wave storm directions and location of the foot platform.
A multi-temporal geomorphological analysis, based on a detailed comparison of the available 1954, 1987, 2006 and 2017 aerial photos and orthophotos, is here presented, highlighting the areas that are more susceptible to recession. In the study proposed, wave and sea storm impact are supposed to represent the most important driving factors for cliff instability processes and recession in the examined area. They are analysed at the scale of the single coastal sector in order to investigate the reasons for higher recession rates in specific sectors, along with other controlling factors, as for example the geomechanical properties of the rock mass and the presence of emerging rock platforms at the cliff foot.
Therefore, the case study application serves as pretext to suggest a multi-scale framework of analyses to execute when the recession evolution of a wide coast segment needs to be explored. In fact, the photointerpretation allows to recognize sectors with most relevant changes, where more detailed site-specific investigations can be subsequently carried out to derive the role of the different factors in coastal evolution.
2. Study area
The study area is located on the southernmost portion of Apulia region (Italy). It stretches along the Adriatic coast from 4 km North of San Foca to Sant’Andrea locality (). The area belongs to the Salento peninsula that represents part of the emerged Adriatic foreland. It’s built on thick Mesozoic carbonate sequence overlain by calcareous clayey sands, calcarenites and sandstones belonging to more recent geological formations such as Calcareniti di Andriano Formation (Miocene) and Uggiano la Chiesa Formation (Pliocene) () (Bossio et al. Citation1985; Ricchetti et al. Citation1988; Sansò et al. Citation2016).
In particular, the coastal cliffs, stretching from Sant’Andrea, to the South, to San Foca, to the North, are cut in the soft rocks belonging to the Uggiano la Chiesa Formation (Middle-Upper Pliocene) (Tropeano et al. Citation2004; Bossio et al. Citation2005). The litho-facies are represented by stratified fossiliferous yellowish marly calcisiltites and yellowish to light grey calcarenites fine and medium grained, poorly cemented, locally well stratified, with the presence of benthic foraminifera, echinoids, briozoa, red algae. The texture is grainstone or packstone (Fazio et al. Citation2019). The Apulian foreland is weakly deformed and affected by Apenninic (NW-SE) and anti-Apenninic (NE-SW) trending faults (Fazio et al. Citation2019).
The area is affected by a number of NW–SE or NNW–SSE normal faults, which in some cases cut Lower Pleistocene deposits (Martinis Citation1962, Citation1967; Bosellini et al. Citation1999) that crop out in some patches along the coast near Otranto (Mastronuzzi et al. Citation2007). Secondarily, the area is characterized by other NE-SW trending faults usually covered by Quaternary deposits, which can be hardly identified in the field (Funiciello et al. Citation1991; Delle Rose Citation2007). Different joint systems with various orientation are present, along with tension cracks resulting from the stress release related to the evolution of the instability processes. Joints show four sets of orientations NNW-SSE, NE-SW besides a secondary direction striking WNW-ESE and ENE-WSW (Mastronuzzi et al. Citation1992; Sansò et al. Citation2016). In particular, joints at the scale of the cliff are supposed to have larger influence in the study area than proper faults, which are indeed rather limited. Such discontinuities, where existing, represent predisposing factors with respect to cliff failure and recession and generally tend to delimit the unstable rock volumes.
From the hydrogeological point of view, the Mesozoic karstified rocks host a wide and deep aquifer, resting on intruded seawater along the coastline, while the overlying clayey layers of the Upper-Pliocene calcarenite bedrock provide several and shallow aquifers (Delle Rose Citation2007; Sansò et al. Citation2016).
Geomorphologically, the territory constitutes a plateau, which progressively degrades from the hinterland towards the coast (Delle Rose and Parise Citation2005). In the area, six order of terraces can be recognized between 103 m to few meters a.s.l., locally interrupted by elongated depressions with direction NNW-SSE, one of which (the deepest) hosts the Alimini lakes (Sansò et al. Citation2016).
The coastal stretch examined is characterized by the alternation of cliffs, rocky sloping coasts, small embayment and small beaches. Short portions are characterized by small pocket beaches in the proximity of San Foca and Torre dell’Orso localities and south of Sant’Andrea (). According to the Sunamura classification (Sunamura Citation1992; Citation2015) coastal cliff can be ascribed to the A, B and C (plunging cliff) types and, as pointed out by Sansò et al. (Citation2016), these types alternate along the analyzed coastal area ().
In the sectors are ascribed to the different classes of the Sunamura classification according to the observed prevailing type. The classification was operated following the reconstruction carried out by Sansò et al. (Citation2016), and integrated by field survey and Google Earth image observation.
The height of the steep plunging cliffs changes from 7 m up to 20 m. A wave cut emerged platform, placed roughly at +3 m a.s.l. and attributable at the Holocenic Climatic Optimum (6000 yr BP) (Mastronuzzi et al. Citation1994), is also present at places. Whereas the coast shows erosion at the foot (notch) the aforementioned platform is not present. Along the coastline, the karstic landforms take place with small or large caves, canalizations, sinkholes, which represent weakness areas that are more vulnerable to instability processes (Delle Rose and Parise Citation2005).
Based on rock laboratory experimental studies, Ciantia et al. (Citation2015) and Castellanza et al. (Citation2018) have highlighted that environmental weathering affects calcarenites, in terms of both wetting and chemical processes, thus reducing their rock mass strength. Andriani and Walsh (Citation2007) have instead described that rainfall water, marine spray and wind erosion, particularly active during storms, remove fine particles from the rock matrix leaving only the grain skeleton, thus contributing to the general degradation and dissolution of the rock cliff surfaces.
The low mechanical strength of the rock masses represents a predisposing factor of the failure processes, along with discrete joint patterns; in particular, joint systems and cracks that are enlarged by the hydraulic action and abrasion processes represent highly weak elements where failure propagation accelerates (Fazio et al. Citation2019) (). The most widespread mechanism of cliff instability in the study area is represented by block falls followed by free fall of debris, controlled by the presence of tension cracks, parallel to the cliff face; however, when persistent joints exist in the rock mass, slice detachments, topplings and wedge failures along two intersecting fractures can also occur. Falls of blocks and big slices of rocks are frequently triggered by the propagation of undercutting at the base of the cliff (notch) (Delle Rose and Parise Citation2004;Citation2005; Fazio et al. Citation2019).
Figure 2. Example of a typical coastal landscape close to San’Andrea Village (a); Examples of rock cliff failures occurred in the shoreline studied (b–d). Locations are reported in the upper right inset.
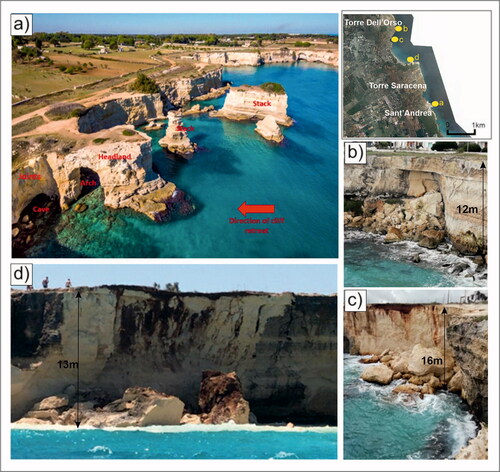
Numerous cliff instability processes have occurred in the last years throughout the study area (Caprioli et al. Citation2016, Sansò et al. Citation2016). These processes generally take place after strong wave storms or rainfalls, the first inducing strong impulsive actions along the cliff and the latter determining weathering and mechanical degradation processes within the rock mass ().
Field surveys carried out after the failure events have indicated that collapses often develop where red soil volumes exist within the shallow strata of the cliff or in the cliff sectors where softer fine-grained rocks outcrop. Such failure processes frequently occur according to brittle mechanisms, within very limited time spans and with few precursory signs, so that monitoring activities aimed at the hazard mitigation is relatively complex to be pursued.
3. Multi-temporal geomorphological analyses
In order to investigate the coastal retreat of the study area over space and time, a detailed morphological analysis has been carried out for eight segments of the coastline portion examined. Rocky coast cliff retreat estimation based on multi-temporal analysis of maps and images has been carried out on multiple areas of the world, such as in Normandy (France) (Costa et al. Citation2004), in UK (Dornbusch et al. Citation2008) or in California (Hapke and Reid Citation2007; Hapke et al. Citation2009; Young Citation2018). A variety of techniques have been exploited to calculate recession rates (Sunamura Citation1992; Hapke Citation2004) usually as distance against time interval. The most common method is based on a multi-temporal analysis of aerial photographs and/or historic maps to trace the changes in the position of a cliff top or edge Sunamura (Citation2015).
Here, the coastline changes have been detected by means of an analytical approach based on photo-interpretation of aerial photos and orthophotos with different scales from multiple years. To this aim, a dataset composed of 1954 and 1987 aerial photos as well as 2006 and 2017 orthophoto images have been accounted. In particular, the 1954 and 1987 aerial photos have been acquired from the Italian Military Geographical Institute (IGMI) () and digitized by scanning with 800 dpi resolution and geo-referenced; the 2006 and 2017 orthophoto images, with respectively 1 m and 0.15 m pixel resolution, have been instead acquired from the Apulian regional database.
Table 1. Images used for the multitemporal photointerpretation and mapping.
In order to reduce errors, aerial photos (1954-1987) were orthorectified and co-registered. Orthorectification was applied using DTM with 8 m pixel resolution, by assigning 12 Ground Control Point (GCPs) and 20 Tie points and 3 Check-points for each photograph. GCPs were assigned to well recognizable points such as road intersections or buildings. Co-registration was carried out to all the orthorectified images and were aligned to the 2006 orthophoto, as it was considered to have the best spatial constraint and coverage. For the alignment error, the RMSE (Root Mean Square Error) of GCPs was evaluated by considering only points with an RMSE < 2.5 m, and after the co-registration the RMSE was reduced to less than 2 m. These values were satisfactory considering the characteristics of the images used and the purpose of the work. Orthorectified images were then processed by using Erdas Image software in order to create an orthomosaic covering the study area.
Based on the available dataset, a multi-temporal coastline mapping has been processed in a GIS environment to derive the coastline changes. Segments were chosen by identifying the line that corresponds to the cliff edge, while segments of low coast were excluded from the analysis. This line was digitized for each image of different time period, resulting in segments of different lengths.
For the analysis, the entire period 1954-2017 was evaluated and the intermediate time steps (i.e. 1987 and 2006) were used to assess the rates of coastline retreat in the different time periods. The coastal retreat was evaluated by exploiting the ArcGis tool Digital Shoreline Analysis System (DSAS) developed by the United States Geological Survey (USGS) (Himmelstoss, Citation2009). Multiple transects perpendicular to a reference baseline located offshore with respect to the mapped shoreline segments have been generated in order to calculate shoreline changes and a number of statistical parameters (Hapke and Reid Citation2007; Hapke et al. Citation2009; Thieler et al. Citation2009; Moussaid et al. Citation2015; Rosskopf et al. Citation2018). In particular, transects were generated with 10 m spacing. Once the analysis was completed, transects were evaluated manually in order to delete those affected by errors due to software misinterpretation of the shoreline changes. In this case, errors were due to the impossibility of the tool to interpret the morphology of the most irregular and curved sectors of the coast. Changes were evaluated by exploiting the End Point Rate (EPR) and the Shoreline Change envelope (SCE) parameter (DSAS v4.3 user guide 2008), allowing the calculation of the maximum and average changes along the time period 1954-2017.
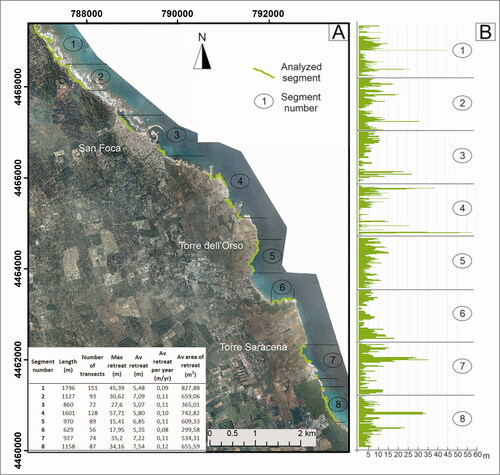
The multitemporal approach and the automatic shoreline analysis enabled the exploration of the spatial and temporal evolution of the Apulian coast sector described in section 2. For the mapping analysis eight segments of different lengths were identified (). For each segment, a number of transects that analyse the retreat along the shoreline has been drawn with the DSAS tool, so that a total number of 837 transects were depicted; later on, by applying a manual cleaning procedure, only 750 were left for consideration. Based on the EPR and the SCE, the retreat shown in has been calculated. Although retreat data lower than 3 m were not considered, due to the fact that they can be attributed to uncertainties derived from ortho-rectification and mapping procedure, the outcomes reveal that most of the analysed area is affected by retreat. Overall, the average retreat ranges from a minimum of 5.5 m (segment 1) to a maximum of 7.5 m (segment 8). In detail, the results obtained shows different rates of retreat in the analysed time period (), with segments characterized by homogeneous cliff recession rated (segments 5 and 6) and others with outstanding peaks of significant retreat. For instance, both segments 1 and 4 indicate high changes for a limited number of transects that reach maximum retreats of 45.4 m (segment 1) and 57.7 m (segment 4), with significant lower changes around 10-15 meters. Conversely, segments 7 and 8, are an intermediate between the extremes 5 and 6 (homogenous) and the extremes 1 and 4 (that have very high rates coupled with smaller rates), being characterized by a consistent number of transects showing less severe but more homogeneous retreats. These segments are characterized on average by a retreat of around 35-40 meters for the considered time span. Cliff rates per year (Table within ) are spanning from 0.08 m/yr (segment 6) to 0.12 m/yr (segment 8), values are provided by DSAS tool and is calculated for each segment as average segment retreat against segment length (m/yr).
Figure 3. (A) Analysed segments along the coastline; in the left bottom corner the most relevant parameters obtained are shown. (B) Changes detected by transects for each segment.
For the examined coastline, the observed outcomes are in accordance with earlier studies carried out in the same areas (Delle Rose and Parise Citation2005), which has shown how instability phenomena along the coastline is supposed to be mainly controlled by geological and geomorphological features such as lithology, local discontinuities, marine erosion or presence of notch at the base of the cliff. Globally, values observed can be compared with the ones reported by other authors around the world for Tertiary sediments, such as Woodroffe (Citation2002); Hapke and Reid (Citation2007) and Prémaillon et al. (Citation2018).
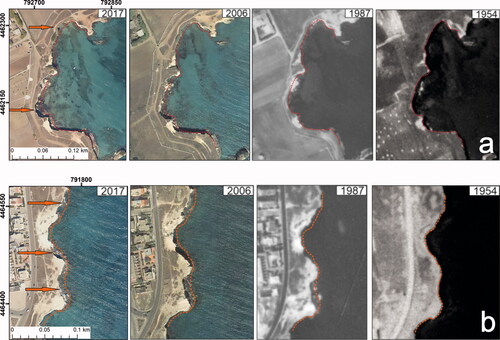
However, the multitemporal mapping performed provided a deeper understanding of the coastal dynamics, since it has provided information not only on the cumulated retreat in the analysed period, but also allowed to highlight cases where significant retreat occurred in a more limited fraction of the period. Two of the most meaningful cases are reported in . In particular, in it is possible to observe how the most significant change occurred in the period between 1987-2006 in the areas indicated by the orange arrow, followed by further retreat between 2006 and 2017, with the deposition of rock masses at the cliff toe, as indicated by the arrows. In the second example (), it is possible to observe how an evident retreat is already visible in the period 1954-1987. Moreover, on the upper side indicated by the topmost arrow, there is a significant retreat between 1987-2006 with the deposition of rock masses highlighted by the arrows.
Figure 4. Examples of some of the most outstanding changes observed along the study area, from multi-temporal analysis, taken from segment 7 (a) and 5 (b). The red dotted line indicates the shoreline in 1954 and the arrows highlight the most relevant changes.
4. Controlling factors
Multi-temporal mapping and analysis described in the previous section allowed the identification of the shoreline areas with deeper recession in the analysed time period. On the basis of the evidences provided by this study performed at a general scale, a series of in-depth studies have been carried out in order to investigate the most important processes or properties that play a role as conditioning factors in the coastal recession for the case study. Therefore, the role of the rock mechanical properties (section 4.1), the incidence of emerged rock platforms at the toe (section 4.2) and the influence of the storm waves (section 4.3) are discussed.
4.1. Rock geomechanical properties
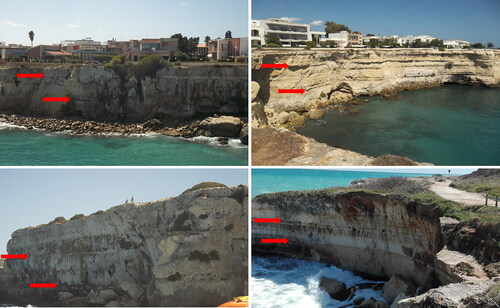
The rocks belonging to the Uggiano la Chiesa Formation outcrop in two different facies. A first coarse-grained calcarenite facies, rich in bivalves, red algae, and benthic foraminifers, outcrops in the upper and lower strata of the cliff; this rock material is generally stiffer with respect to erosion and instability phenomena. A fine-grained calcisiltite facies, composed of a well-stratified sequence of marly carbonate sediments and characterised by lower strength properties, instead, outcrops with high frequency in the middle part of the cliff. A typical stratigraphic profile representative of the aforementioned sequence, as resulting from a borehole drilled at a distance of about 10 m from the cliff surface, is shown in . Such vertical lithological succession is often visible also at macroscale (), and, according to field evidences, is frequently representative of the cliff lithological sequence in the areas where failures have occurred.
Figure 5. Schematic lithological profile of the study area (modified from Perrotti et al. Citation2020)
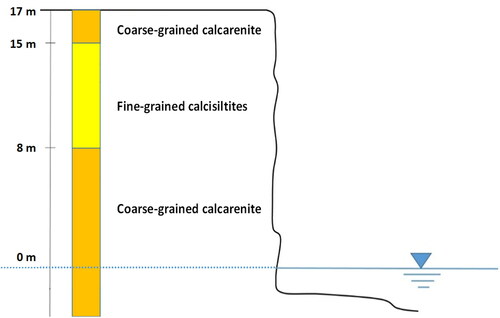
Figure 6. Example of vertical lithological variations along cliffs belonging to the study area.
Owing to the different porosity and the fine material content in the two rock facies, the mechanical behaviour of the coarse-grained calcarenite and the fine-grained calcisiltite may differ significantly, although the two facies are frequently mixed and not easily detectable as an effect of the complex depositional history.
In order to define the main physical and mechanical properties of the rock materials, laboratory tests were performed for both dry and saturated calcarenite and calcisiltite samples taken throughout the study area; in particular, uniaxial compression strength (UCS) tests were carried out on cylindrical samples with diameter d = 50 mm and height h = 120 mm, whereas brazilian tests were performed on disk samples, with diameter d = 50 mm and height h = 25 mm, to quantify rock tensile strength. Based on the laboratory measurements, under dry conditions, the rock unit weight ranges between 12 and 17.9 kN/m3, with the lower values registered for samples with predominantly calcisiltite component. Under saturated conditions, the unit weight is measured to be between 17.5 and 21.6 kN/m3. Porosity generally ranges between 30% and 59%.
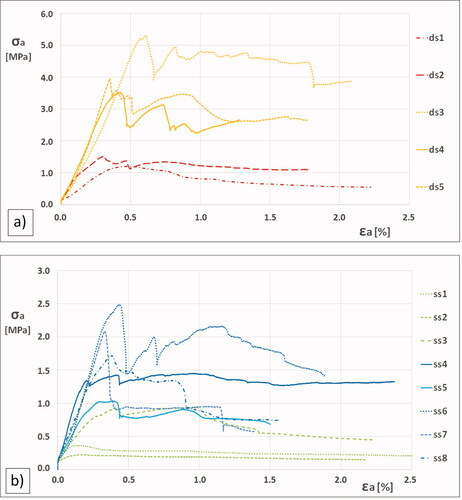
In the axial stress – axial strain curves obtained from the UCS tests are summarised. In particular, ) shows the curves obtained from the tests carried out on dry samples and indicates that the uniaxial compressive strength ranges approximately between 1.2 and 5.3 MPa, with values of σc in the range between 1 and 2 MPa for the calcisiltite samples (ds1 and ds2 samples, red curves in ) and values larger than 2 MPa for the calcarenite samples (ds3, ds4 and ds5 samples, yellow curves in ). Moreover, the plot in also highlights that a more ductile behaviour is generally observed for the calcisiltite samples (Lollino and Andriani Citation2017). reports the results of UCS tests for saturated samples and shows a remarkable decrease of the strength values with respect to the dry condition. In fact, under saturated conditions, UCS strength lies in the range between 0.2 and 2.5 MPa, with the lowest values obtained for the calcisiltite samples (σc < 1 MPa; ss1, ss2 and ss3 samples, green curves in ) and larger values measured for the calcarenite ones (σc > 1 MPa; ss4 to ss8 samples, blue curves in ). It comes out that the UCS decrease, from dry to wet conditions, is generally larger than 50% of the dry UCS strength, this being generally in agreement with the results observed by Ciantia et al. (Citation2015) for rocks belonging to the same formation and by Hashiba and Fukui (Citation2015) for different porous rocks.
Figure 7. UCS stress-strain curves for calcarenite/calcisiltite rock. In (a) curves for dry samples (ds) are shown, with yellow curves obtained from calcarenite samples and red curves obtained from calcilsiltite samples; In (b) curves for saturated samples (ss) are shown, with blue curves obtained from calcarenite samples and green curves obtained from calcilsiltite samples (modified from Perrotti et al. Citation2020).
Larger stiffness values, E50, measured at 50% of the uniaxial strength, have been observed for the samples with predominant calcarenite component (ds4 and ds5 dry samples and ss4, ss6, ss7 and ss8 saturated samples, ). Also, a significant influence of the saturation degree has been found on the stiffness value. In fact, values of E50 lie in the range between 300 and 2000 MPa for dry samples and from 100 to 1500 MPa for saturated samples.
Taking as a reference the uniaxial compressive strength at the dry state, the rock materials examined can be classified as moderately to extremely soft rock, according to the classification proposed by Andriani and Walsh (Citation2010), and weak, according to the ISRM one (1978).
Indirect tensile tests were also performed in the laboratory, under both dry and saturated conditions. In dry conditions, the indirect tensile strength ranges between 240 and 600 kPa, whereas, under saturated conditions, results to be between 60 and 290 kPa, with the lowest values measured for the calcisiltite samples. These results confirm that, under saturated conditions, rock strength tends to decrease of more than 50%.
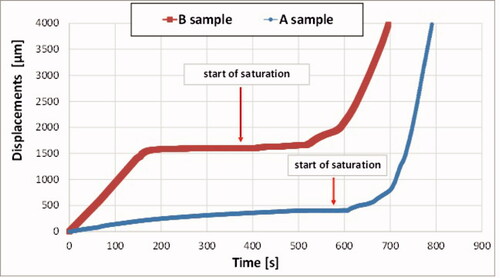
The incidence of water in the rock disaggregation and fragmentation process of these porous rocks has been also investigated by means of two constant-stress UCS wetting tests () performed on calcarenite samples. In particular, the samples have been initially subjected to a linear increase of the axial stress with respect to time, under dry conditions, up to reaching values lower than the corresponding UCS strength values (final value reached of 0.7 MPa for sample A, 0.4 MPa for sample B). Later on, the samples have been left subjected to such constant stress over time at the final value of uniaxial stress reached at the end of the previous stage. At this stage, axial displacement is observed to maintain a constant value with time, which means no failure (). Then, the samples have been completely submerged by filling of water a recipient containing the sample. During the wetting process, axial displacement is seen to increase unlimitedly and cracks propagate all over the samples, thus indicating failure conditions of the samples (). These tests confirm the role of weather-driven wetting processes in the progressive development of failure within the calcarenite rock cliffs, which may result, for instance, as a consequence of rainfall infiltration or wave-induced wetting process.
Figure 8. Displacement-time curves obtained from UCS constant-stress wetting tests on two calcarenite rock samples (constant stress applied to sample A = 0.7 MPa; sample B = 0.4 MPa).
Along the shoreline studied, the sectors that are characterized by faster retreat have been observed to be frequently associated to the presence of calcisiltite layers within the cliff and, therefore, to rock portions characterized by lower mechanical properties (see ). As a matter of fact, shows the locations where a calcisiltite layer has been clearly detected at mid height of the cliff (see star symbols in the same figure) and these locations also correspond to areas where a faster coastline regression is recorded.
4.1.1 2D FEM modelling
A different recession rate can be even observed through the whole cliff height, between the different calcarenite facies levels. A stronger enhancement of erosion is observed for the middle calcisiltite layer with respect to the upper and lower calcarenite layers. In order to investigate the influence of the differential weakening process of the two facies on the cliff stability a two-dimensional finite element model has been developed.
Finite element model has been performed with PLAXIS 2 D FEM software, taking in account a domain geometry characterised by 50 m width and 40 m height. The discretization mesh (composed by 17245 soil elements with an average size of about 0,4 meters) used in the analysis, which is relatively fine in the domain portion close to the cliff surface, is shown in . A linear elastic perfectly plastic model, with Mohr-Coulomb failure criterion, has been adopted for both the two materials (calcisiltite, in green, and calcarenite, in light brown in ). The unweathered rock strength parameters used in the modelling have been derived from a procedure of linearization of the intact rock Hoek-Brown failure envelopes obtained by using the results of UCS tests reported in (). The weathering process has been then simulated in the analysis by reducing progressively the cohesion of the rock materials, as representative of a cementation degradation process, starting from strength parameters representative of unweathered conditions (c’ = 250 kPa and ϕ’ = 28° for the calcarenite; c’ = 150 kPa and ϕ’ = 26° for the calcisiltite), for which no failure conditions are observed. The condition of a moderate reduction of the rock cohesion, down to c’ = 180 kPa for the calcarenite and c’ = 80 kPa for the calcisiltite, produces a local failure mechanism within the calcisiltite layer () that resembles the undermining of the middle part of the cliff. Then, after a further reduction, down to c’ = 140 kPa for the calcarenite and c’ = 40 kPa for the calcisiltite, a general failure mechanism is instead simulated, with plastic points that propagate within the whole calcisiltite layer and tensile failures in the upper calcarenite layer, reaching the ground surface, due to tensile stresses generated in the same area (). The contours of vertical displacement in the last simulation are plotted in and confirm the general failure above described as a rockfall mechanism.
Figure 9. 2-D finite element model. (a) Discretization mesh adopted; (b) plastic points (red points) with moderately degraded strength parameters; (c) plastic points and tensile failures (black points) with highly degraded strength parameters; (d) contours of cumulated displacement with highly degraded strength parameters.
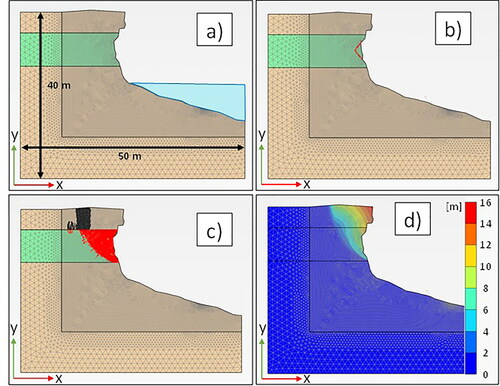
Table 2. Rock mechanical properties adopted in the FEM model for the two rock materials.
The simulation proposed is representative of a typical failure mechanism occurring in such geological environment, as a consequence of wetting processes generated by rainfall infiltration or sea spray, and refers to a type C – plunging cliff, which is largely diffuse throughout the study area. Other typical failure mechanisms occurring along the coastline examined are for example those directly triggered by wave action and erosion at the foot.
4.2. Incidence of emerged rock platforms at the toe
The influence of the wave cut emerged platforms on the shoreline recession processes in the study area has been also investigated by exploring the sectors that are affected by the presence of emerged platforms at the foot of the cliffs (). shows the areas of the shoreline studied that are characterized by the presence of an emerged platform, with maximum height of about 1 m a.s.l. Where platforms exist at the toe of the cliff, a significantly lower degree of retreat is observed with respect to the remaining areas that are instead affected by stronger retreat rates, with the tendency of creating small embayments. This should suggest that such platforms act as an efficient barrier against wave energy and wave impact, thus reducing significantly the susceptibility to failure of the overlying rock cliffs.
Figure 10. (a) Plan of the shoreline studied with indications (in red) of the sectors characterised by emerged rock platforms at the toe; (b) Picture of an emerged rock platform at the cliff toe.
4.3. Storm wave features
Throughout the study area, coastline is mainly oriented along NNW – ESE, so that it is generally exposed to wave storms produced by winds coming from the sector between 310° and 130° directions with respect to North (see ).
Figure 11. (a) Wave orientation recorded for 2011 (Jan–Dec); (b) wave height recorded along the Adriatic south coast of the Apulia region in January 2011 (data RON, Bencivenga et al. Citation2012).
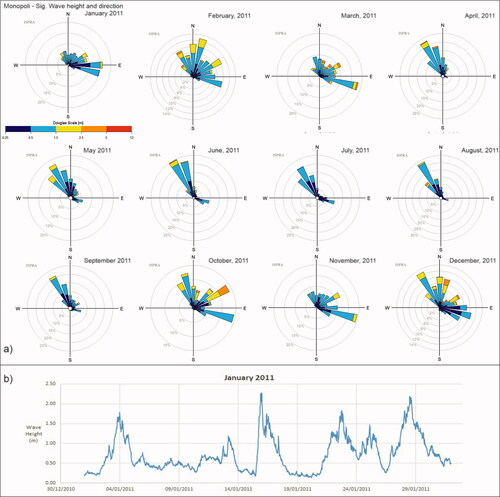
In the present work, wave height and wave direction data for the examined area in a 5-year time period, i.e. between January 2010 and December 2014, as derived from the dataset RON (National Wavemeter Net, Rete Ondametrica Nazionale) provided by ISPRA (Istituto Superiore per la Ricerca Ambientale, Bencivenga et al. Citation2012), have been analysed in order to investigate the main typical features of the wave storms impacting the shoreline. In particular, the data examined are referred to the wavemeter station installed in Monopoli, about 120 km North of the study area.
indicates that the most frequent storms follow the wind directions from Northern and Eastern sectors (i.e. direction 310° to 60°, and directions 60° to 130°, respectively). The storms coming from the Northern sectors are frequent throughout the year, whereas those coming from the Eastern directions are recurring in autumn and winter. Moreover, those occurring during winter are more capable to generate higher waves. shows the continuous recording wave height data against time acquired respectively for January 2011, as an example of the typical frequency of seawave storms and corresponding time duration. In particular, indicates that seawave storms, characterised by wave height larger than 1.5-2 m and multiple-days duration, can occur with a frequency of 5 times per month in the winter season.
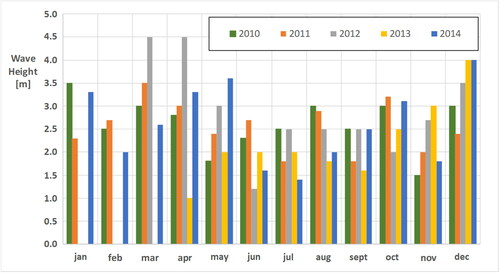
reports the maximum values of the wave height, for each month, recorded in the 5-year time span considered. The figure shows that the average value of the wave height ranges between 2 and 3 m. Moreover, larger wave height values are measured in the winter and spring seasons, generally ranging between 2.5 and 4.5 m, with two peaks of highest values approximately equal to 4.5 m in March 2012 and April 2012. Lower values are observed in the summer season, with values generally between 1.2 and 3 m. Based on the relationships proposed in the specific literature (Cuomo et al. Citation2010), wave height values in the range between 3 and 4.5 m correspond to values of the impact pressure on the vertical cliff of about 40 kPa to 60 kPa, which should be also thought as a dynamic load acting at the base of the cliff. It is worthwhile noting that the wavemeter device was located at about 4 Km from the coastline, so that the actual wave height impacting on the shoreline should be potentially considered as underestimated due to wave amplification processes in the areas close to the shoreline.
Figure 12. Maximum wave height values recorded along the Adriatic south coast of Apulia region between 2010 and 2014.
The effects of the strongest storm waves are considered to be connected to instability phenomena that have occurred along the coastline (). In particular, most of the rockfall phenomena have been observed to occur during or soon after intense and prolonged wave storms, with wave height generally larger than 2 m caused by wind speed higher than 50 km/h.
Table 3. Wind speed and rainfall height recorded during or in the 10 days before the cliff failure events occurred in multiple locations along the analysed coastal stretch.
5. Discussion
The analysis of the evolution of a soft rock coastal cliff sector in Apulia region has been carried out starting with a geomorphological multi-temporal analysis through photo interpretation. From the inspection and interpretation of multiple images (aerial photos and orthophotos) the coastline has been identified and outlined in GIS environment. In this area, changes in the coastline evolution, i.e. recession, have been highlighted and on this basis the most relevant conditioning factors for the case study (namely rock geomechanical properties, presence of emerged platform at the toe, and storm waves) have been selected for a more in-depth investigation.
The analysis of the rock geomechanical properties highlighted how different recession rates of some portions of the coast can be attributed to the presence of rocks of low strength and highly susceptible to water-induced weakening. When such rocks outcrop along the cliff surface, cliff recession is undoubtedly stronger and faster in the same area. Moreover, the correlation of the observed recessions from photo interpretation and the presence of platforms at the toe of the cliff suggested that platform can play an important role against the effects of waves, dampening the wave energy transmitted to the cliff surface, given that in the platform areas a significantly lower degree of retreat is detected. Finally, for the study area, the wave storm features, such as direction and height, have been evaluated as another important contributing factor. In general, it has been noticed that the sectors with the largest recession rates are those directly exposed, for most of the cases, to the stronger Eastern storms during winter or, to a lower extent, to the Northern storms. Furthermore, the correlation of the storm wave and wind speed information with the known rockfalls and interdicted areas, suggested that there is frequently an immediate effect of the strongest events (generally with wave height at least larger than 2 m and wind speed higher than 50 km/h) on the stability of the cliff. Consequently, the cliff recession scenarios outlined by these results are deemed to enhance over time.
Moreover, the areas more susceptible to collapses have been observed to be those directly exposed to the directions of the most recurrent and most intense wave storms, as described above. The coasts, for the sectors 1–4 and 8, are exposed to the wave storms coming from the North and secondarily from the East. On the other side, sectors 5 and 7, which are characterized by the presence of entrances, are more exposed to storms from the South-East direction, that are also prevailing in the study areas. However, retreat in sector 5 is observed to be less intense than sector 7, due to the fact that, owing to its orientation, it is protected from storms coming from the North. Sector 7 in and is a clear example on how the three conditioning factors may combine, determining the higher or lower retreat for the analysed coast. In fact, transects of sector 7 indicate a coast portion affected by intense retreat that is the result of the combination of the absence of foot platform, impacting wave storms from both NE and ESE directions, and low mechanical properties of the outcropping rocks. However, in the same sector, for the portions where an emerged platform is observed, the retreat is more restrained (). Similar conditions can be attributed to sector 8.
6. Concluding remarks
The approach presented within this contribution serves also as applicative example to show a workflow to apply in the study of coastal recession through time. The initial multi-temporal analysis via photo-interpretation is a low time-consuming analysis that allows to gain a general understanding of the cliff evolution of the study area. From that, the most susceptible sectors can be identified, and then site-specific analyses should be performed focusing on these sectors to have an insight into the most important contributing factors. Such a multi-scale methodological approach could be helpful for efficient risk mitigation and land management strategies.
Acknowledgements
The authors would like to thank the Apulia regional office of ‘Servizio Demanio Costiero e Portuale’ for making the orthophoto available. We are deeply grateful to the Editor, the Associated Editor and the two anonymous referees whose suggestions undoubtedly contributed to improve our article.
Disclosure statement
No potential competing interest was reported by the authors.
Data availability statement
The data that support the findings of this study are available from the corresponding author, V.Z., upon reasonable request.
Additional information
Funding
References
- Adams PN, Storlazzi CD, Anderson RS. 2005. Nearshore wave-induced cyclical flexing of sea cliffs. J Geophys Res. 110(F2):F02002.
- Andriani GF, Pellegrini V. 2014. Qualitative assessment of the cliff instability susceptibility at a given scale with a new multidirectional method. Int J Geol. 8:73–82.
- Andriani GF, Walsh N. 2007. The effects of wetting and drying, and marine salt crystallization on calcarenitic rocks used as building material in historic monuments. Geol Soc London Special Publ. 271(1):179–188.
- Andriani GF, Walsh N. 2010. Petrophysical and mechanical properties of soft and porous building rocks used in Apulian monuments (south Italy). Geol Soc London Special Publ. 333(1):129–141.
- Anfuso G, Gracia FJ, Battocletti G. 2013. Determination of cliffed coastline sensitivity and associated risk for human structures: a methodological approach. J Coast Res. 29(6):1292–1296.
- Antonioli F, Lo Presti V, Rovere A, Ferranti L, Anzidei M, Furlani S, Mastronuzzi G, Orrù PE, Scicchitano G, Sannino G, et al. 2015. Tidal notches in Mediterranean Sea: a comprehensive analysis. Quat Sci Rev. 119:66–84.
- Bencivenga M, Nardone G, Ruggiero F, Calore D. 2012. The Italian data buoy network (RON). WIT Trans Eng Sci. 72:321–332.
- Bosellini A, Bosellini FR, Colalongo L, Parente M, Russo A, Vescogni A. 1999. Stratigraphic architecture of the Salento coast from Capo D’Otranto to S. Maria di Leuca (Apulia, Southern Italy). Rivista Italiana Paleontol Stratigrafia. 105(3):397–416.
- Bossio A, Landini V, Mazzei R, Salvatorini G, Varola A. 1985. Studi sul Neogene e Quaternario della Penisola Salentina. I – La sequenza pliocenica di S. Andrea (Lecce) ed il suo contenuto in pesci, ostracodi, foraminiferi e nannofossili. Atti Soc Tosc Sc Nat. 92:35–93.
- Bossio A, Mazzei R, Monteforti B, Salvatorini G. 2005. Stratigrafia del Neogene e Quaternario del Salento Sud-Orientale (Con rilevamento alla scale 1:25.000). Geol Romana. 38:31–60.
- Brooks SM, Spencer T. 2010. Temporal and spatial variations in recession rates and sediment release from soft rock cliffs, Suffolk coast, UK. Geomorphology. 124(1-2):26–41.
- Budetta P, Galietta G, Santo A. 2000. A methodology for the study of relation between coastal cliff erosion and the mechanical strenght of soils and rock masses. Eng Geol. 56(3-4):243–256.
- Calista M, Mascioli F, Menna V, Miccadei E, Piacentini T. 2019. Recent geomorphological evolution and 3D numerical modelling of soft clastic rock cliffs in the Mid-Western Adriatic sea (Abruzzo, Italy). Geosciences. 9(7):309.
- Caprioli M, Trizzino R, Mazzone F, Scarano M. 2016. Experiences of UAV Surveys Applied to Environmental Risk Management. The International Archives of the Photogrammetry, Remote Sensing and Spatial Information Sciences, Volume XLI-B1, 2016, XXIII ISPRS Congress, Prague, Czech Republic.
- Caprioli M, Trizzino R, Pagliarulo R, Scarano M, Mazzone F, Scognamiglio A. 2015. Management of environmental risks in coastal areas. The International Archives of the Photogrammetry, Remote Sensing and Spatial Information Sciences, Volume XL-3/W3, 2015, ISPRS Geospatial Week 2015, France.
- Castedo R, Paredes C, de la Vega-Panizo R, Santos PAP. 2017. The modelling of coastal cliffs and future trends. https://doi.org/http://dx.doi.org/10.5772/intechopen.68445.
- Castellanza R, Lollino P, Ciantia MO. 2018. A methodological approach to assess the hazard of underground cavities subjected to environmental weathering. Tunnell Underground Space Technol. 82:278–292.
- Cavaleri L, Bajo M, Barbariol F, Bastianini M, Benetazzo A, Bertotti L, Chiggiato J, Davolio S, Ferrarin C, Magnusson L, et al. 2019. The October 29, 2018 storm in Northern Italy – an exceptional event and its modeling. Prog Oceanogr. 178:102178.
- Ciantia MO, Castellanza R, di Prisco C. 2015. Experimental study on the water-induced weakening of calcarenites. Rock Mech Rock Eng. 48(2):441–461.
- Costa S, Delahaye D, Freiré-Diaz S, Di Nocera L, Davidson R, Plessis E, 2004. Quantification of the Normandy and Picardy chalk cliff retreat by photogrammetric analysis. Geol Soc London Eng Geol Special Publ. 20(1):139–148.
- Cuomo G, Allsop W, Bruce T, Pearson J. 2010. Breaking wave loads at vertical seawalls and breakwaters. Coast Eng. 57(4):424–439.
- Delle Rose M. 2007. Sedimentological features of the plio-quaternary aquifers of Salento (Puglia). Mem Descr Carta Geol Ital. 76:137–146.
- Delle Rose M, Parise M. 2004. Slope instability along the Adriatic coast of Salento, southern Italy. Atti IX International Symposium on Landslides, Rio De Janeiro, Vol. 1, 399–404.
- Delle Rose M, Parise M. 2005. Speleogenesi e geo- morfologia del sistema carsico delle Grotte della Poesia nell’ambito dell’evoluzione quaternaria della costa Adriatica Salentina. Atti Mem Comm Grotte “E. Boegan”. 40:153–173.
- Dornbusch U, Robinson DA, Moses CA, Williams RBG. 2008. Temporal and spatial variations of chalk cliff retreat in East Sussex, 1873 to 2001. Mar Geol. 249(3-4):271–282.
- Duperret A, Taibi S, Mortimore RN, Daigneault M. 2005. Effect of groundwater and sea weathering cycles on the strength of chalk rock from unstable coastal cliffs of NW France. Eng Geol. 78(3-4):321–343.
- Fazio NL, Perrotti M, Andriani GF, Mancini F, Rossi P, Castagnetti C, Lollino P. 2019. A new methodological approach to assess the stability of discontinuous rocky cliffs using in-situ survey supported by UAV-based techniques and 3-D finite element model: a case study. Eng Geol. 260:105205.
- Funiciello R, Montone P, Parotto M, Salvini F, Tozzi M. 1991. Geodynamic evolution of an intra- orogenic foreland: the Apulia case history (Italy). Boll Soc Geol It. 110:419–425.
- Gariano SL, Guzzetti F. 2016. Landslides in a changing climate. Earth Sci Rev. 162:227–252.
- Gerivani H, Stephenson W, Afarin M, Stephenson W. 2020. Sea cliff instability hazard assessment for coastal management, 1–17.
- Griggs G, Davar L, Reguero BG. 2019. Documenting a century of coastline change along central California and associated challenges: from the qualitative to the quantitative. Water. 11(12):2648.
- Gong B, Wang S, Sloan SW, Sheng D, Tang C. 2018. Modelling coastal cliff recession based on the GIM-DDD method. Rock Mech Rock Eng. 51(4):1077–1095.
- Hapke CJ. 2004. The measurement and interpretation of coastal cliff and bluff retreat. US Geological Survey Professional Paper, 1693, p. 39–50.
- Hapke CJ, Malone S, Kratzmann M. 2009. National assessment of historical shoreline change: a pilot study of historical coastal bluff retreat in the Great Lakes, Erie, Pennsylvania. U.S. Geological Survey Open-File Report 2009–1042.
- Hapke CJ, and Reid D. 2007. National assessment of shoreline change, Part 4: Historical coastal cliff retreat along the California Coast: U.S. Geological Survey Open-file Report 2007–1133.
- Hashiba K, Fukui K. 2015. Effect of water on the deformation and failure of rock in uniaxial tension. Rock Mech Rock Eng. 48(5):1751–1761.
- Himmelstoss EA. 2009. DSAS 4.0 Installation Instructions and User Guide In: Thieler ER, Himmelstoss EA, Zichichi JL, and Ergul A. 2009. Digital shoreline analysis system (DSAS) version 4.0 — An ArcGIS extension for calculating shoreline : U.S. Geological Survey Open-File Report 2008-1278. *updated for version 4.3
- ISRM. 1978. Suggested methods for the quantitative description of discontinuities in rock masses. Int J Rock Mech Min Sci Geomechan Abstr. 15:319–368.
- Lambeck K, Antonioli F, Anzidei M, Ferranti L, Leoni G, Scicchitano G, Silenzi S. 2011. Sea level change along the Italian coast during the Holocene and projections for the future. Quat Int. 232(1-2):250–257.
- Lawrence JA, Mortimore RN, Stone KJ, Busby JP. 2013. Sea saltwater weakening of chalk and the impact on cliff stability. Geomorphology. 191:14– 22.
- Lim M, Rosser NJ, Allison RJ, David N, Petley DN. 2010. Erosional processes in the hard rock coastal cliffs at Staithes, North Yorkshire. Geomorphology. 114(1-2):12–21.
- Lollino P, Andriani GF. 2017. Role of brittle behaviour of soft calcarenites under low confinement: laboratory observations and numerical investigation. Rock Mech Rock Eng. 50(7):1863–1882.
- Lollino P, Pesola MD, Fazio NL, Perrotti M, Andriani GF. 2018. Influence of brittleness of soft calcarenites in cliff stability problems: insights from FEM-DEM modelling. In: Lawrence JA, Preene M, Lawrence UL, Buckley R, editors. Engineering in chalk. ICE Publishing, London (UK); p. 331–337.
- Martinis B. 1962. Gli elementi strutturali della parte meridionale della Penisola Salentina. Geol Romana. I:11–23. Roma.
- Martinis B. 1967. Note geologiche sui dintorni di Casarano e Castro (Lecci). Riv It Pal Strat. 73(4):1297–1380. Milano
- Mastronuzzi G, Palmentola G, Sansò P. 1992. Morphological types of rocky coast on Southeastern Apulia. In: Proc. International Coastal Congress, Kiel (Germany).
- Mastronuzzi G, Palmentola G, Sansò P. 1994. Le tracce di alcune variazioni del livello del mare olocenico tra Torre dell’Orso e Otranto (Lecce). Geogr Fis Din Quat. 17:55–60.
- Mastronuzzi G, Quinif Y, Sansò P, Selleri G. 2007. Middle-Late Pleistocene polycyclic evolution of a stable coastal area (Southern Apulia, Italy). Geomorphology. 86(3-4):393–408.
- Pellicani R, Miccoli D, Spilotro G, Gallipoli MR, Mucciarelli M, Bianca M. 2015. Dynamic response of a rocky cliff under the sea wave pulse: a study along the Adriatic coast of Polignano (Apulia, Italy). Environ Earth Sci. 73(10):6243–6257.
- Prémaillon M, Regard V, Dewez TJB, Auda Y. 2018. GlobR2C2 (Global Recession Rates of Coastal Cliffs): a global relational database to investigate coastal rocky cliff erosion rate variations. Earth Surf Dynam. 6(3):651–668.
- Perrotti M, Godone D, Allasia P, Baldo M, Fazio NL, Lollino P. 2020. Investigating the susceptibility to failure of a rock cliff by integrating structure-from-motion analysis and 3D geomechanical modelling. Remote Sens. 12(23):3994.
- Moussaid J, Fora AA, Zourarah B, Maanan M, Maanan M. 2015. Using automatic computation to analyze the rate of shoreline change on the Kenitra coast, Morocco. Ocean Eng. 102:71–77.
- Ricchetti G, Ciaranfi N, Luperto Sinni E, Mongelli F, Pieri P. 1988. Geodynamics and sedimentary and tectonic evolution of the Apulian Foreland. Mem Soc Geol Italiana. 41:57–82. (in Italian)
- Rosskopf CM, Di Paola G, Atkinson DE, Rodríguez G, Walker IJ. 2018. Recent shoreline evolution and beach erosion along the central Adriatic coast of Italy: the case of Molise region. J Coast Conserv. 22(5):879–895.
- Sansò P, Gianfreda F, Leucci G, Mastronuzzi G. 2016. Cliff evolution and late Holocene relative sea level change along the Otranto coast (Salento peninsula, southern Apulia, Italy). GeoResJ. 9-12:42–53.
- Stephenson W, Naylor L. 2010. Rock coast geomorphology. Geomorphology 114(1–2):1–100.
- Sunamura T. 1992. Geomorphology of rocky coasts. Wiley & Sons, Chichester, UK; p. 1–314.
- Sunamura T. 2015. Rocky coast processes: with special reference to the recession of soft rock cliffs. Proc Jpn Acad Ser B Phys Biol Sci. 91(9):481–500.
- Thieler ER, Himmelstoss EA, Zichichi JL, Ayhan E. 2009. Digital Shoreline Analysis System (DSAS) version 4.0 – an ArcGIS extension for calculating shoreline change: U.S. Geological Survey Open- File Report 2008–1278.
- Trenhaile AS. 1997. Coastal dynamics and landforms. Oxford (UK): Oxford University Press; p. 1–366.
- Trenhaile AS, Pepper DA, Trenhaile RW, Dalimonte M. 1998. Stacks and notches at Hopewell rocks, New Brunswick, Canada. Earth Surf Process Landforms. 23(11):975–988.
- Tropeano M, Spalluto L, Moretti M, Pieri P, Sabato L. 2004. Depositi carbonatici pleistocenici di tipo foramol in sistemi di scarpata (Salento – Italia Meridionale). Il Quaternario. 17:537–546.
- Young AP. 2018. Decadal-scale coastal cliff retreat in southern and central California. Geomorphology. 300:164–175.
- Woodroffe CD. 2002. Coasts: form, process and evolution. Cambridge University Press, Cambridge (UK).