
 ?Mathematical formulae have been encoded as MathML and are displayed in this HTML version using MathJax in order to improve their display. Uncheck the box to turn MathJax off. This feature requires Javascript. Click on a formula to zoom.
Abstract
Highly accurate air-borne Digital Elevation Models (DEMs) are not commonly available in most regions of the world, particularly developing countries like Nepal. Better topographic data are required to assess catchment hydrology, flood/inundation propagation, and sediment transport/deposition. Ground-based surveys (i.e., topographic and bathymetry) and Light Detection and Ranging (LIDAR) are expensive in terms of cost and time. We rely mostly on space-borne DEMs when the area of interest is quite large. And, for river cross-sections at specific regions, ground-based surveys are conducted at some regular intervals. The ALOS World 3 D − 30 m (AW3D30), ASTER Global DEM Version 3 (ASTER GDEM v3), SRTM-30, and Carto DEM v3 are some of the popular and latest space-borne DEMs that have been made available to the general public free of charge at a spatial resolution of 30 m. The availability of multiple space-borne DEMs may likely puzzle the practitioners on the selection of appropriate products. Here in this study, we evaluate the vertical accuracy of different space-borne DEMs with respect to the ground-based survey points (2891 points) at river cross-sections and ground-based indicative spot heights (8102 points) across the West Rapti River basin, Nepal. Performance metrics, like mean error and root mean square error (RMSE), were used to quantify deviation with respect to observed elevation. The AW3D30 showed the lowest RMSE value (i.e., 3.41 m) in the lower region of the study area. We numerically simulated the inundation propagation based on four selected DEMs using a calibrated two-dimensional runoff inundation model, and we find the AW3D30 outperforms other DEMs. All four DEMs showed a similar tendency on a catchment scale with respect to the information of indicative spot heights, suggesting interchangeable applications of all four DEMs in hydrologic analyses. However, precise ground-based observations across the catchment are needed for assuring the applicability.
1. Introduction
Digital elevation model (DEM) is a grid-based matrix structure, which represents squared cells (pixels) with an elevation value associated with each pixel (Manuel Citation2004). It became popular mainly in modeling and analyzing spatial topographic information in geography, geomorphology, hydrology, hydrogeology, numerical modeling, hydrodynamic analysis, and studies on soil, vegetation cover, land use land cover, and many other disciplines. DEM is either a digital surface model (DSM) representing a three-dimensional elevation model of Earth's surface that includes objects, such as buildings, or a digital terrain model (DTM) representing the elevation of bare Earth without any temporary objects. Therefore, both the DTM and DSM are identical in areas with no ground cover, and most data providers use the same term for both products as DEM. DEMs can also characterize topographic complexity and provide information on topographic and geomorphic variables influencing numerous environmental dynamics. They help improve understanding of a given area's geographical, geomorphological, and environmental properties (Alexander et al. Citation2016; Amatulli et al. Citation2020).
Accurate elevation data are required for hydrologic and hydrodynamic analyses, including future predictions (Yamazaki et al. Citation2012; Yamazaki et al. Citation2017), which could be obtained through various ways, including field surveys and observations, contour lines, topographic maps, and laser altimetry (Manuel Citation2004). DEMs are generated by different techniques, such as photogrammetric, interferometry, laser scanning (LIDAR), aerial stereo images, and topographic surveys (Mondal et al. Citation2017). Ground-based topographical surveys, drone-based photogrammetric, or/and air-borne laser scanning DEMs are often preferred as topographic inputs for detailed water resource assessment analyses. However, such data are limited in developing countries (Talchabhadel et al. Citation2019).
The elevation data can be obtained from ground-based topographic surveys, aerial photography, LIDAR survey, radar detection altimetry to independently determine DEMs' vertical accuracy, but the techniques are costly and time-consuming. In developing countries like Nepal, such advanced high-resolution ground-based topographic survey data are not available due to associated cost and time. In Nepal, series of national topographic maps and databases are available for Tarai and middle Hills in 1: 25,000 scale covering 7.5 minutes latitude and longitude, and for high Hills and Himalayas in 1: 50,000 scale covering 15 minutes latitude and longitude (Wagle and Acharya Citation2020). in the supplement section shows the number of topographic sheets across the country available at different scales. Similarly, ortho-photo maps, aerial photographs are available in 1: 5,000 and 1: 10,000 scale (Kayastha Citation2002). The topographic and ortho-photo maps are almost prepared 20 years back (Wagle and Acharya Citation2020) and need updating.
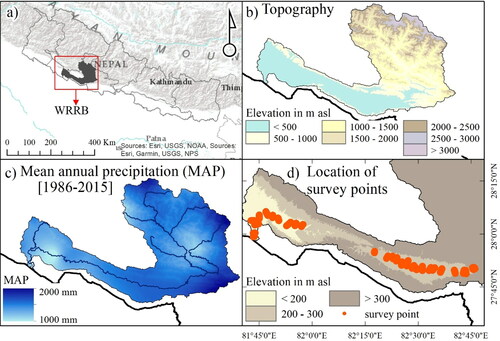
Figure 1. a) Location of the study area shown over the map of Nepal, b) Topography of the West Rapti River basin (WRRB) presented in every 500 m elevation interval, c) mean annual precipitation (1986 – 2015) of the study area, and d) location of survey points (2891 points) at different river cross-sections shown in red and the topography of lower region presented in every 100 m elevation interval.
In recent days, several government institutes commissioned the LIDAR-based surveying for project planning and management, particularly for large projects like hydropower, water diversion, etc. Similarly, the government recently used the LIDAR technology to map the country's forest areas and the irrigation sector. Even though these techniques are effective, they could not be continued for mapping the whole country due to the associated massive cost. Hence, most of Nepal's projects are still planned based on either long back data provided by the Department of survey (DoS) or/and freely available DEMs and commercial satellite images. In this context, most of the hydro(geo)logical, hydrodynamic, and environment-related previous studies such as; Aryal et al. (Citation2019); Pandey et al. (Citation2020); Bhatta et al. (Citation2020); Talchabhadel et al. (2020a and 2020c); Thapa et al. (Citation2016; Citation2017) and many others used those freely available DEMs. We find that a sound understanding of such available DEMs' accuracy is required before using them for any applications such as catchment hydrology, flood/inundation propagation, and sediment transport/deposition. This study evaluates the performances of freely available space-borne DEMs as the first kind of such research in Nepal.
In general, remote sensing techniques based on different satellite-based products are employed to capture topographic information. Recently, many space-borne DEMs are available to the general public free of charge at a spatial resolution of 30 m (Santillan and Makinano-Santillan Citation2016). The Shuttle Radar Topography Mission (SRTM), Advanced Space-borne Thermal Emission and Reflection Radiometer (ASTER), Advanced Land Observing Satellite (ALOS) World 3 D – DEM (AW3D), and CartoSat-I DEM (Carto DEM) are freely available and widely used in recent days. And for precise information, commercial products are available at very high resolutions, i.e., few meters (such as 2.5 m or 5 m).
Recent advances in remote sensing techniques have steadily and significantly increased the accuracy of terrain elevation (Talchabhadel et al. Citation2019). Therefore, the SRTM measured land elevations using radar interferometry has limitations over the water bodies and inundated areas. However, the SRTM DEM products provide the most complete and highest resolution freely available DEM covering the entire earth. The SRTM data are sampled over a grid of 1 arcsecond x 1 arcsecond (approximately 30 m x 30 m) (Patel et al. Citation2016). Similarly, The ASTER DEM product frame covers 60 km x 60 km with an output DEM resolution at 30 m with enhanced accuracy due to multiple ASTER images over the same location (Patel et al. Citation2016).
More recently, ASTER, AW3D, and Carto DEM have been developed using stereo viewing of optical satellite images (Krishnan et al. Citation2016). However, space-borne DEMs contain various observational errors like speckle noise, strip noise, absolute bias, tree height bias, and so on (Talchabhadel et al. Citation2019). Therefore, the errors caused by the vertical accuracy of the elevation data should be considered while using these space-borne DEMs (Hashimoto et al. Citation2018). Several studies (such as Li and Wong Citation2010; Tarekegn et al. Citation2010; Thomas et al. Citation2014; Saksena and Merwade Citation2015; Hsu et al. Citation2016; Santillan and Makinano-Santillan Citation2016; Hashimoto et al. Citation2018; Rana and Suryanarayana Citation2019; Talchabhadel et al. Citation2019) have been conducted for assessment of accuracy of different DEMs in different regions of the world. Those accuracy were evaluated with respect to ground-based data using different techniques like using digital global positioning system with SRTM, ASTER, and Carto DEMs by Patel et al. (Citation2016), vertical accuracy on the southern central Andean plateau (Purinton and Bookhagen Citation2017), over the Australian continent (Rexer and Hirt Citation2014) and vertical accuracy of SRTM with survey field points in Brazilian region (Orlandi et al. Citation2019). Not only in the accuracy assessment of different DEMs, those DEMs were used by different researchers for different purposes. DEMs has been used to individually extract and analyze the relief, surface, size, shape, and texture properties of Indian mountainous drainage basin (Das et al. Citation2016), hydrologic and environmental modeling, and hydraulic modeling (Md Ali et al. Citation2015; Hashimoto et al. Citation2018). However, such studies are not yet conducted in the central Himalayan region, Nepal. This is despite the fact that different space-borne DEMs are widely used as the chief sources of topographic information for many hydrologic and hydrodynamic applications across the country. The quality and accuracy of DEMs were not adequately assessed with respect to measured control points.
In this study, we made an effort to explore the efficacy of applying different space-borne DEMs in one of Nepal's medium-sized catchments. We chose the West Rapti River basin (WRRB) as the study area because of the availability of surveyed river cross-section data and a comparatively denser network of hydrometeorological stations. Also, the basin represents the medium-sized watersheds of Nepal's western region, which are rather less explored. This study's objective is to assess the vertical accuracy of four selected space-borne DEMs (SRTM, ASTER, AW3D, and Carto DEM) with respect to the surveyed points and spot heights across the study area. The comparisons were made on different elevation bands (500 m interval) across the catchment and elevation bands (100 m interval) around the river channel in the lower region of the study area. Numerical simulation of inundation propagation was computed for verifying the superiority of different DEMs for hydrodynamic analysis.
2. Study area
The West Rapti River originates from the middle mountains, enters the lowlands, and finally drains to the Ganges in India. and show the location of the study area in Nepal and its topography. The elevation ranges from about 100 m above sea level (asl) to 3600 m asl. We divide the topography into elevation bands with 500 m intervals and compare the accuracy of different space-borne DEMs with respect to spot heights of the DoS at those elevation bands across the study area. shows the spatial distribution of mean annual precipitation (MAP) from 1986 to 2015 across the study area. We observe drier river valleys compared to mountain slopes. The MAP of the WRRB is 1500 mm, and more than 80% of it occurs during four months (June – September). Detailed information on the study area could be found in Talchabhadel et al. (Citation2020a). shows survey points (2891 points) at 30 river cross-sections across the river channel in the study area's lower region. The cross-section survey was conducted in 2014 by the Department of Water Resources and Irrigation (DoWRI), previously the Department of Irrigation. The same cross-section data were used by Devkota et al. (Citation2020) while analyzing floods across the study area. The Department of Hydrology and Meteorology (DHM) issues timely flood forecasts for the study basin using the same data by forcing hydrodynamic models, such as HEC-RAS and MIKE. Across the floodplain in the lower region of the study area, we categorize the region into three elevation bands (< 100 m, 100 − 200 m, and > 200 m asl) and later assess the DEMs at those categories with respect to surveyed data in the subsequent section.
3. Materials and methods
Spot heights are the digital point data published by the DoS, Government of Nepal using the topographic map of 1: 25,000/1: 50,000 scale between 1992 and 2001. The elevation of these spot heights is routinely validated using the Global Positioning System (GPS) during field visits. In the DoS, the topography data are available in two formats: one as contours and another as spot heights. Other available digital data are transportation (roads, trails), land cover, hydrography (river edges), designated area (national parks and protected areas), administrative area, place name, and building (settlement). These databases are based on scanning original maps, vectorization, and several cleaning processes (Chhatkuli Citation2003). In general, the spot height informs the hill's peak, the average height of flat land, and overall elevation of locally high positions. The distance between adjacent spot heights varies from approximately 200 m to a few km. There has been a continuous updating of topographic base maps using several latest remote sensing techniques. Detailed information could be found in Wagle and Acharya (Citation2020). The river cross-section data were measured on the ground using the total station and level machine. The total station contains a very accurate clinometer which computes elevation differences with accuracy on a cm scale. Relative horizontal distance and elevation differences between the measuring point and targets are calculated based on measured sloping distances and angular differences. The level machine measures a height difference using a highly accurate bubble level, but it can only measure in a horizontal plane. Therefore, it is used to transfer vertical distance from one station to another. And total stations are set on these locations to measure the elevation at several target locations. These data are one of the accurate datasets available for the study area. The same data are used in different studies (Devkota et al. Citation2020), national documents (ADB Citation2016), and for operational flood forecasting and early warning systems (DHM Citation2018).
The SRTM DEM is recently published with 30 m spatial resolution (hereinafter SRTM-30), which is prepared by the interferometry method. The SRTM data was acquired over an 11-day mission in February 2000, with data points posted every one arcsecond (∼ 30 meters). Initially, the SRTM DEM was available at 90 m resolution. The SRTM-30 is an enhancement to low-resolution SRTM data having 90 m spatial resolution (Santillan and Makinano-Santillan Citation2016). According to its mission objectives, SRTM DEMs are likely to have linear vertical absolute height error of <16 m, linear vertical relative height error of <10 m, circular absolute geolocation error of <20 m, and circular relative geolocation error of <15 m on a global scale (Farr et al. Citation2007). ASTER and Carto DEM are taken from recently published data (ASTER GDEM v3 and Carto DEM v3, spatial resolutions at 30 m), which are prepared using stereo-pairs of satellite imagery. The ASTER GDEMv2 was released in 2011 with significant improvement on the previous version of 2009, particularly by reducing artifacts, higher-resolution correlation, and filling holes. It is based on data from 2000 − 2013. Furthermore, in 2019, ASTER GDEMv3 was released with further improvements, and detailed information could be found in Abrams et al. (Citation2020). The vertical accuracy of ASTER GDEMv3 ranges from 7 to 14 m.
Recently, the Carto DEM has gained popularity for Indian regions, including Nepal. The CARTOSAT −1 spacecraft was launched in 2005 by the Indian Space Research Organization (ISRO)(Krishnan et al. Citation2016). The commercial product is available at 10 m resolution and is based on orthoimages of 2.5 m resolution. The vertical accuracy of Carto DEM is about 8 m. The AW3D30 (i.e., AW3D at 30 m resolution) is a resampling of the commercial 5-m mesh version of World 3 D Topographic Data. The AW3D30 was generated using the optical stereo matching technique as applied to images acquired by the Panchromatic Remote-sensing Instrument for Stereo Mapping (PRISM) sensor onboard the ALOS from 2006 to 2011 (Takaku et al. Citation2014). The vertical accuracy of AW3D30 ranges from 4 − 8 m. We used AW3D30 version 2.1 released in April 2018, where areas of no-data or low-quality data are filled using other data sources. The vertical accuracy of these products varies spatially, and their performances are quite different in different regions.
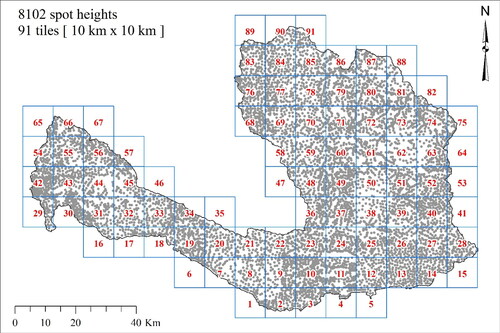
shows the spatial distribution of elevation based on different space-borne DEMs. AW3D30 and Carto DEM v3 had no data gaps, whereas SRTM-30 and ASTER GDEM v3 still had some data gaps at a few locations. shows the location of spot heights of DoS across the study area. We divide the study area into tiles of 10 km x 10 m (91 tiles). These tiles are simply just the division of the entire study area to look into local scale.
Figure 2. Spatial distribution of elevation based on different space-borne DEMs. The two insets for SRTM-30 and ASTER GDEM v3 show data gaps at few locations. The red box in Carto DEM v3 shows the area where significant differences are observed compared with the other three DEMs.
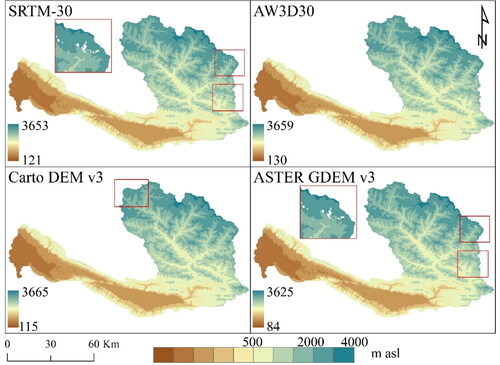
Figure 3. Spot height locations of the Department of Survey, Government of Nepal across the West Rapti River basin. The tile size is 10 km x 10 km. There are 91 tiles covering the entire study area.
We resampled space-borne DEMs' resolution from 30 m into 100 m, 250 m, 500 m, and 1 km. For this, we exported the 30 m resolution DEM into different resolutions DEMs in the ArcGIS platform. The resampled elevation at these coarser resolutions provides the average height computed from 30 m pixels for the designated resolution pixel. It is similar to the average value calculated using the zonal statistics in the ArcGIS platform. In general, 100 m resolution is nearly equal to 3 × 3 grid cells of 30 m resolution, whereas 250 m resolution is almost equal to 8 × 8 grid cells of 30 m resolution. The 500 m and 1 km resolution DEM are very coarse, and they provide a lumped elevation value. However, this study tries to look at the intercomparisons of values based on different space-borne DEMs rather than the absolute comparison with the spot heights. And for the remote locations, the distance between two adjacent spot heights is more than 1 km.
We compared different space-borne DEMs with respect to surveyed data and spot heights at each point. Performance metrics, like mean error and root mean square error (RMSE), were then computed at different elevation bands and different tiles to check DEMs' performance at different local scales. The deviations were calculated between DEMs and observed data (meaning DEM minus observed data). Hence, negative values of mean error denote underestimation, and positive values represent overestimation of elevation with respect to the observed data. A lower value of RMSE represents better performance.
The flood simulation model (Talchabhadel et al. Citation2020) is a two-dimensional unsteady flow model based on a shallow water equation.
[1]
[1]
[2]
[2]
[3]
[3]
where,
is the water depth,
and
are fluxes in the
and
directions respectively,
and
are velocities in the
and
directions respectively,
is the water level, and
is the acceleration of gravity. A leap-frog difference scheme was employed to solve these equations. We used unstructured meshes. Flow velocity and flow flux are defined at the unstructured mesh boundary, and water depth is determined at the centroid of the unstructured mesh (Musumari et al. Citation2019). More details on discretization for solving in the unstructured mesh are presented in Kawaike et al. (Citation2000). Smaller meshes were specified in the river system, and relatively coarser meshes were set for the remaining. The total number of computation meshes was 34670 with 18296 nodes. Manning's roughness coefficient for a river channel was given 0.025, and 0.04 was given for the remaining meshes. We then used an individual DEM for each case. We finally simulated the calibrated inundation propagation model (Talchabhadel et al. Citation2020) in a larger flood plain based on different space-borne DEMs down to India for the event of August 10 − 20, 2014, one of the highest recorded streamflow in the WRRB.
We compare the inundation extent with the simulated inundation extent of other studies and satellite-based estimates. Devkota et al. (Citation2020) simulated the flood inundation extent for the WRRB using HEC-RAS 1 D. They validated with the watermarks and depths reported by the local people during the field survey. We also used the SENTINEL-1 Synthetic Aperture Radar (SAR) to estimate the inundation extent during extreme events. The SENTINEL-1 SAR has a wide swath of 250 km with a high geometric resolution at ∼20 m. With a frequency of 12-days, the satellite collects the imagery. The first satellite, SENTINEL −1 A, was launched in April 2014, and the second SENTINEL-1B was launched in April 2016. We explore the data from 2017 onwards and look at the study area's inundation area by referring to the extreme events. We could not compare the inundation extent of the same instance due to the limitation of other optical satellite images due to the clouds.
4. Results
shows comparisons of elevation between different space-borne DEMs and surveyed data at 2891 points. Generally, all products showed a good correlation. Since the absolute magnitudes are in m asl (ranging from 100 − 400 m asl), the changes among different space-borne DEMs are comparatively less with respect to the absolute magnitudes. However, AW3D30 showed a greater correlation (i.e., 0.9964) than the remaining three. The ASTER GDEM v3 showed the least correlation (i.e., 0.9866), which is even a good agreement value for absolute magnitude. describes the error statistics putting all data in a single pool. The ASTER GDEM v3 showed many locations with significant underestimation of elevations, whereas the AW3D30 showed the least number of locations with underestimated elevations. However, all products also revealed that there are locations with substantial overestimation. As one could expect, the magnitude of overestimation is comparatively less for the ASTER GDEM v3 because the tendency of the ASTER GDEM v3 is overall an underestimation with respect to the observations.
Figure 4. Comparison of elevation between different space-borne Digital Elevation Models (DEMs) and survey points at 2891 points.
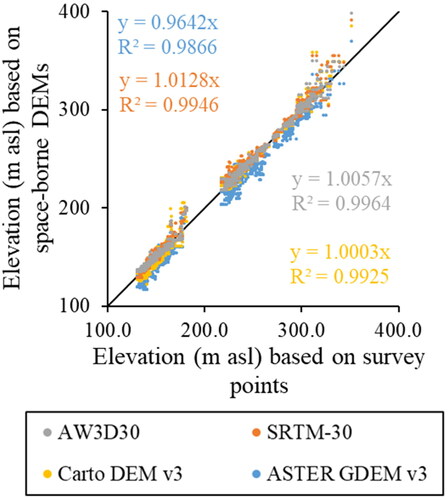
Table 1. Error Statistics (in m) of vertical accuracy of difference space-borne Digital Elevation Models (DEMs) with respect to survey locations (2891 points). The bold value represents the lowest, and the italics value represents the second lowest.
The mean error value is least for the Carto DEM v3 (i.e., −0.6 m), followed by the AW3D30 (i.e., 1.25 m). However, the RMSE value of the Carto DEM v3 is greater than the SRTM-30 and AW3D30. Overall, the AW3D30 showed better performance in terms of RMSE and acceptable mean value (to some extent similar to that of the Carto DEM v3). In contrast, the ASTER GDEM v3 showed a mean error of −8.33 m and an RMSE of 10.3 m, indicating a larger under-estimation amongst all selected DEMs. Disaggregated performance of error statistics at different elevation bands is shown in and . The AW3D30 demonstrated better performance in all individual elevation bands followed by the SRTM-30 at elevation < 200 m asl and the Carto DEM v3 at elevation > 200 m asl.
Figure 5. Error for different space-borne DEMs with respect to survey points at different elevation in West Rapti River basin (WRRB) [at left], and mean error and RMSE at different elevation bands in WRRB for different space-borne DEMs [at right].
![Figure 5. Error for different space-borne DEMs with respect to survey points at different elevation in West Rapti River basin (WRRB) [at left], and mean error and RMSE at different elevation bands in WRRB for different space-borne DEMs [at right].](/cms/asset/e4dac5cc-d0d3-48a0-9c2d-96e0eb1253f0/tgnh_a_1910575_f0005_c.jpg)
Table 2. Error Statistics (in m) of vertical accuracy of difference space-borne Digital Elevation Models (DEMs) with respect to survey locations (2891 points) at different elevation bands. The bold value represents the lowest, and the italics value represents the second lowest.
Carto DEM v3 demonstrated an under-estimation for elevation < 200 m asl and over-estimation for elevation >200 m asl. In an earlier case, when we evaluated all data in a single pool, the errors were compensated and resulted in a minimum mean error. The ASTER GDEM v3 under-estimated at all three elevation bands, and the tendency was decreasing towards increasing elevation. In contrast, the SRTM-30 and AW3D30 over-estimated for all three elevation bands. The tendency of over-estimation rose towards increasing elevation, i.e., the larger the elevation value higher is the over-estimation. Overall, we find that the AW3D30 proved superior among four space-borne DEMs in the study area's lower region. We also find that since the ASTER GDEM v3 underestimates at most locations, indicating that the use of ASTER GDEM v3 requires a systematic bias correction with respect to observed data for lower regions.
We find there were locations with both under-estimations and over-estimations for all four DEMs over all tiles. Most of the under-estimations were observed at the upper tiles, whereas most of the overestimations were found at the lower tiles. The error variability is more controlled by the elevations than the latitude and longitude (spatial locations). Similar to , we show the error statistics across the study area with respect to 8102 spot heights in . The Carto DEM v3 over-estimated by ∼500 m at some locations. All four DEMs under-estimated even ∼1 km at some locations, indicating that spot heights are the only representative and it does not reflect the exact location data. However, looking at the overall tendency, we find Carto DEM v3 performed slightly better among all products in terms of both mean error and RMSE. On resampling the DEMs for a coarser resolution, the errors were enlarged, which is expected. Most of the time, the AW3D30 showed better choice after the Carto DEM v3 for catchment-scale with respect to the spot heights' information.
Table 3. Error Statistics (in m) of vertical accuracy of difference space-borne Digital Elevation Models (DEMs) with respect to spot heights (8102 points). The bold value represents the lowest, and the italics value represents the second lowest.
Similar to , we show the error statistics for the elevation across the different elevation bands of 500 m intervals with respect to spot heights in . For most of the elevation bands, the Carto DEM v3 showed slightly better performance in mean error and RMSE. For the region with the elevation < 500 m asl, the SRTM-30 showed a better mean value, but the Carto DEM v3 revealed a better RMSE value. In contrast, for the region with the elevation between 1500 to 2000 m asl, the SRTM-30 showed a better RMSE value, but the Carto DEM v3 demonstrated a better mean value. In general, all DEMs showed a similar tendency on the catchment scale, indicating a wider application of all four DEMs in hydrologic analyses. But for precise analysis, a LIDAR survey, drone photogrammetric analysis, or/and ground-based topographic survey are necessary to reconfirm the current assessment for vertical accuracy on a catchment scale.
Table 4. Error Statistics (in m) of vertical accuracy of difference space-borne Digital Elevation Models (DEMs) with respect to spot heights (8102 points) at different elevation bands. The bold value represents the lowest, and the italics value represents the second lowest.
shows a longitudinal profile of the lower portion of the West Rapti River's center-line from roughly 500 m asl up to the Nepal-India border based on selected four space-borne DEMs. It is noticeable that ASTER GDEMv3 showed comparatively lower values throughout the center-line location, and the remaining three DEMs showed similar elevation values. At about 61% of locations, the SRTM-30 demonstrated the highest elevation among four space-borne DEMs. Similarly, at about 28% of locations, the Carto DEM v3 showed the highest elevation. At the remaining 11% of locations, the AW3D30 exhibited the highest elevation among four selected space-borne DEMs across the river's center-line. A better decision on selecting appropriate space-borne DEMs could only be made if they could be compared with control points such as high-resolution Global Positioning System (GPS) or surveyed-data. shows representative cross-sections at two locations of the WRRB on surveyed (observed) and selected space-borne DEMs. It is quite clear that the ASTER GDEM v3 under-estimated the topography around the river. And the SRTM-30 had a slightly different tendency of elevation variation even though the mean values are better than the ASTER GDEM v3.
Figure 6. Longitudinal profile along the center-line of the lower portion of the West Rapti River from point A to point B based on four different space-borne DEMs.
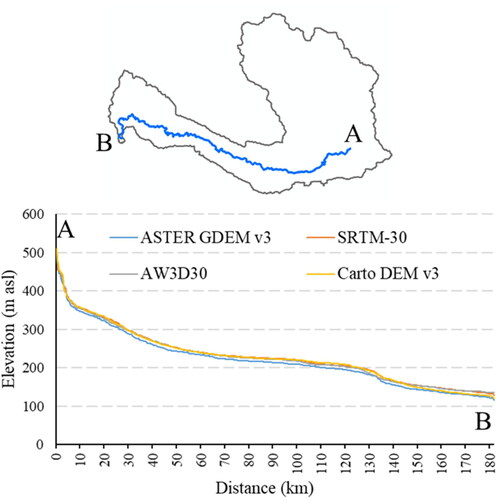
Figure 7. Representative cross-sections based on surveyed (observed) and four different space-borne DEMs.
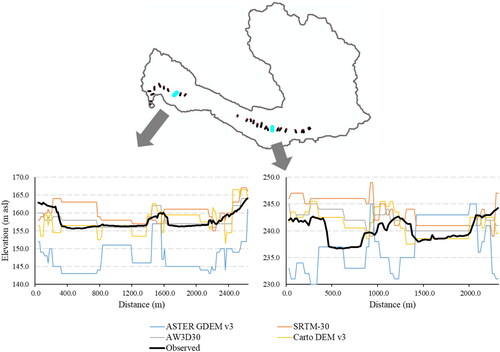
The Carto DEM v3 and AW3D30 had better performance than the other two, and the tendency of elevation variation throughout the cross-sections is almost similar to that of the observed one. However, the precise ground variations are still not mimicked by both DEMs. By making visual inspections on all available cross-sections and the above-mentioned quantification of mean error and RMSE, we find the AW3D30 had superior ability across the lower region of the study area.
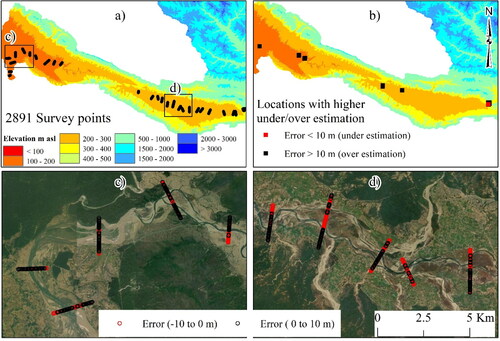
Therefore, we here highlight the error distribution for the AW3D30 in the lower region of the study area (other cases not shown). shows the location of 2891 survey points on AW3D30 in the study area. There were larger under-estimations (i.e., < 10 m) at three points and larger over-estimations (i.e.,> 10 m) at 66 points with respect to survey points. Errors were in the range of −10 m to + 10 m (locations shown in ) at the remaining points. and show samples of cross-sections and performance of the AW3D30 with respect to survey points. It is quite clear that the over-estimation was found at the river course, meaning the AW3D30 was not capable of estimating precise river bathymetry, which was expected to some extent because of underlying limitations of space-borne DEMs in capturing bathymetry inside the water surface.
Figure 8. a) Overlay of 2891 survey points on AW3D30, b) spatial locations of points where AW3D30 suffers severe under/over estimations with respect to survey points and c-d) sample cross-sections showing performance of AW3D30. Red color denotes underestimation, and black color indicates overestimation in Figures b-d.
Understanding flood/inundation propagation is crucial for properly designing the evacuation plans and delineating hazardous locations (Hashimoto et al. Citation2018). shows spatial distributions of inundation patterns based on different space-borne DEMs for the event of August 2014 across the study area downstream of the Kusum hydrometric station maintained by the DHM, Government of Nepal. The observed discharge during August 15 − 16, 2014, is shown in . The torrential rain affected the southern plain of western Nepal seriously, and water levels in most rivers increased above warning and danger levels. In Babai River, adjacent to the WRRR, the early warning system (EWS) was completely washed away by the flood, and no EWS worked, which caused human deaths and huge property loss (Reliefweb Citation2014). The rain gradually reduced from the afternoon of 15 August 2014, even though floodwaters took some days to recede from inundated villages (Karki et al. Citation2018).
Figure 9. Spatial distributions of inundation patterns based on different space-borne DEMs for the event of August 2014 (August 10 -19 event is shown at top) across the West Rapti River basin.
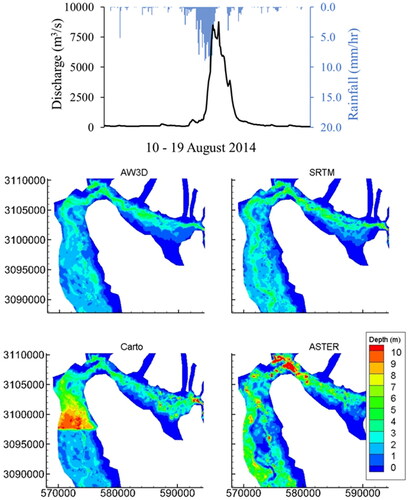
The AW3D30 and SRTM-30 showed similar patterns, whereas the ASTER GDEM v3 showed a different pattern than these two. Upon comparisons with the inundation extent by Devkota et al. (Citation2020) and SENTINEL-1 SAR based estimates, we find the simulated results based on the AW3D30 and SRTM-30 are congruous with them (also refer to and in the supplement section). Interestingly, the Carto DEM v3 showed a curious scenario of the accumulated water along the course of the river. While looking into the data of Carto DEM v3, we find there was a sudden jump of elevation, which is not pragmatic. The causes might be the images used for creating stereo-pair had some defects over that area, indicating a thorough check of elevation is most before making any precise analysis. The comparisons of surveyed points at river cross-sections showed the Carto DEM v3 to be the one with the least mean error, but at the downstream (we don't have measured data at that region), a sudden jump was observed. Therefore, overall error statistics can sometimes misguide reality. One DEM's errors could be resolved using other DEMs' relative values proposed by Talchabhadel et al. (Citation2019). This study limits the quantitative comparisons of inundation depth with observed inundation. A perception-based analysis (questionnaire survey during a site visit in July 2019) supported the simulated results. Comparison with observed data is always necessary, wherever possible. In the lack of observed surveyed data, the inter-comparison between different space-borne DEMs could be another option to rectify the errors.
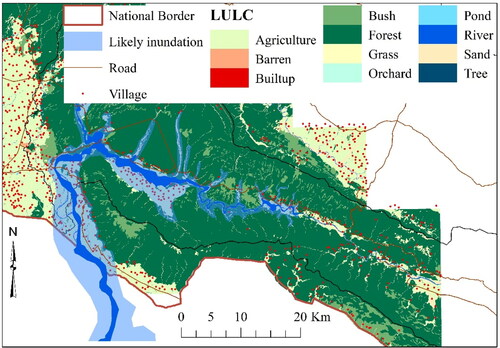
shows the extent of the frequently inundated map superimposed over the land use land cover (LULC, collected from the DoS). 150 villages (Nepal side) are located in frequently inundated regions meaning the people residing in those 150 villages are vulnerable to recurrent flooding and inundation. Most of the settlements prone to inundation are located near the Nepal-India border. Only nine villages, namely Badar Bhariya, Bhawaniyapur, Rolpalikhuti, Jaruwa, Baskholigaun, Amuwa, Gabar, Agaiya, and Sikta at the upper location of the simulated region (meaning around Kusum hydrometric station) are moderately vulnerable to flooding.
Figure 10. Frequently inundated area superimposed over land use land cover (LULC) of the West Rapti River basin and locations of settlements.
5. Discussions
All four space-borne DEMs revealed a strong correlation with the absolute values of the elevation with ground-based observations. It highlights that any of the DEMs could generate the catchment characteristics. However, if our interest is in a precise analysis like running a hydrodynamic simulation, an accurate vertical accuracy plays a crucial role. We find different DEMs demonstrating a quite different nature of hydrodynamic phenomena.
All products reveal the overall performance within their accuracy based on the global and regional level analyses. The variation of their accuracy in the study area is comparatively low compared to their specification ranges. As ASTER GDEM v3 and SRTM-30 expect to have >10 m vertical accuracy, we find they are equally comparable with Carto DEM v3 and AW3D30. In general, the ASTER GDEM v3 under-estimated the elevation throughout the WRRB, and it showed the maximum mean error and RMSE compared with the other three. Therefore, a systematic bias could be evaluated, and biases could be reduced using other space-borne DEMs or/and ground-based observations. The ASTER GDEM v3 uses a stereo viewing of optical satellite images, which is generally superior to the traditional radar interferometric techniques such as SRTM-30. The variability of ASTER GDEM v3 is higher than SRTM-30, as indicated in their specifications. The ASTER GDEM v3 is not consistent and might possess some local noises due to some observational errors across different areas. The SRTM-30 generally over-estimated due to the biases caused by the reflective surface nature of the data. Also, the SRTM-30 was derived from radar interferometry in 2000. As one could expect, the SRTM-30 generally shows poor performance over the water bodies and inundated areas.
Carto DEM v3 is a comparatively new stereo product based on orthoimages of 2.5 m resolution. It uses the datum based on geoid. Therefore, a careful conversion is necessary to directly compare with other DEMs that normally use datum based on the spheroid. Overall, the Carto DEM v3 showed a good performance after the AW3D30 in terms of error metrics. The vertical accuracy of Carto DEM v3 is supposed to be less than 8 m, and we find relatively better performance and is almost equal to AW3D-30. However, based on the hydrodynamic simulation, we find a curious location with some spikes of elevation. Such local noises could be corrected using information from other data sources or/and ground-based observations. Also, there were some noticeable fluctuations when compared with the remaining three DEMs. A careful assessment is needed for a local analysis while using space-borne DEMs corrected on a global or regional scale.
The AW3D30 uses the PRISM's optical data, and the stereo correlation and processing were completed in March 2016 (Abrams et al. Citation2020). It is one of the latest datasets (Bayburt et al. Citation2017) and is the re-sampling of 5 m DEM that makes the product more promising (Jacobsen Citation2016). The vertical accuracy of AW3D30 is supposed to be better than 5 m (Nikolakopoulos Citation2020), and we also find a similar range in the study area compared with the ground-based observations. Our evaluation based on error metrics and the hydrodynamic simulation recommended the AW3D30.
Md Ali et al. (Citation2015) evaluated precise water level using high-resolution LIDAR DEM and compared with space-borne DEMs. Our future work would also analyze some complex hydraulic behaviors (flood velocity, direction and magnitude, and peak event timing) depicted by high resolution observed DEM and compare them with space-borne DEMs. For this study, we chose the satellite-derived inundation maps during the extreme flooding events in other monsoon days selected based on instances reported by Chhetri et al. (Citation2020) (shown in in the supplement section and note that the cloud cover for the same event was very high, and the optical satellite images could not be used to estimate the inundation extent). These maps showed a similar spatial extent of inundation derived from the AW3D30 and SRTM-30, indicating the reliability of those DEMs for inundation analyses.
Devkota et al. (Citation2020) also revealed a similar inundation extent for the study area (refer to in the supplement section). Generally, the anticipated impact of a disaster is estimated from the exposure of critical facilities and their inherent capacities to cope with hazards. We believe our results may provide supplementary information to prepare hazard maps and possible risks across the study area. Our results suggest the application of the AW3D30 in inundation propagation. Better topographic data are needed for precise simulation of hydrodynamic behaviors of the river. Thus, regular cross-section and topographic surveys are recommended.
Around 70 villages across the lower region of the study area and close to the West Rapti River are highly vulnerable to flooding. The flood-prone areas are mostly cultivated land and villages. The villagers of three local administrative units, namely Narainapur, Duduwa, and Rapti Sonari, are likely affected every year with varying flood magnitudes. Based on the population census of the year 2011 (available at https://cbs.gov.np/population/, about 18,000 males and 16,000 females reside in Narainapur. Similarly, approximately 19,000 males and 18,000 females live in Duduwa. And, about 28,000 males and 31,000 females reside in Rapti Sonari. Almost 10% of these populations are exposed to flood hazards during the monsoon season.
The vulnerability and exposure data highlight the proper planning of the study area in relation to recurrent flooding. The evaluation of available DEMs could be a preliminary step for preparing different strategic planning, particularly evacuation plan and safe shelter zonation during flooding and long-term inundation scenarios. Ongoing construction of river protection works (embankment and spurs) has greatly reduced the chances of occurrences of flood hazards recently.
6. Conclusions
Better topographic data are necessary for a precise evaluation of hydrologic and hydrodynamic analyses. There are many space-borne DEMs available, and they may contain various observational errors. The errors in vertical accuracy of the elevation data should be considered while using these space-borne DEMs. The availability of multiple space-borne DEMs may likely puzzle the practitioners on the selection of appropriate products. Here in this study, we compared the vertical accuracy of four space-borne DEMs, namely AW3D30, SRTM-30, Carto DEM v3, and ASTER GDEM v3, with respect to ground-based observations.
AW3D30 demonstrated a lower mean error and RMSE value. In contrast, ASTER GDEM v3 showed the largest mean error and RMSE value for all three elevation bands (100 − 200 m, 200 − 300 m, and 300 − 400 m asl) across the lower West Rapti River region. For the catchment analysis, all four DEMs exhibited similar performance with respect to the information derived from the spot heights. But, since spot heights do not represent the exact location's elevation, we recommend comparing the DEM values with more accurate ground-based observations. We reconfirm the appraisal of the use of spatial information of DEM based on numerical simulation results of inundation propagation using four selected DEMs into a calibrated two-dimensional runoff inundation model. We found the AW3D30 showed a similar inundation extent as depicted by satellite-based inundations and other studies. As AW3D30 outperforms in the lower region of the study area, this study suggests its application in hydrologic and hydrodynamic analysis.
Supplemental Material
Download MS Word (1.4 MB)Acknowledgments
The authors are thankful to the Department of Hydrology and Meteorology, the Department of Water Resources and Irrigation, and the Department of Survey, Government of Nepal, to share hydrometeorological, river x-section, and survey data, respectively.
Data availability statement
The data that support the findings of this study are available on request from the authors, [Thapa B. R. or Talchabhadel R.]. River cross-section data are not publicly available.
Disclosure statement
No potential conflict of interest was reported by the author(s).
Additional information
Funding
References
- Abrams M, Crippen R, Fujisada H. 2020. ASTER Global Digital Elevation Model (GDEM) and ASTER Global Water Body Dataset (ASTWBD). Remote Sens [Internet]. 12(7):1156. https://www.mdpi.com/2072-4292/12/7/1156.
- ADB. 2016. Grant 0299-NEP: Water Resources Project Preparatory Facility, Final Report. https://www.adb.org/sites/default/files/project-documents/45206/45206-001-dpta-en_74.pdf.
- Alexander C, Deák B, Heilmeier H. 2016. Micro-topography driven vegetation patterns in open mosaic landscapes. Ecol Indic. 60:906–920. [Internet]. https://linkinghub.elsevier.com/retrieve/pii/S1470160X15004513.
- Amatulli G, McInerney D, Sethi T, Strobl P, Domisch S. 2020. Geomorpho90m, empirical evaluation and accuracy assessment of global high-resolution geomorphometric layers. Sci Data. 7(1):162. http://www.nature.com/articles/s41597-020-0479-6.
- Aryal A, Shrestha S, Babel MS. 2019. Quantifying the sources of uncertainty in an ensemble of hydrological climate-impact projections. Theor Appl Climatol. 135(1–2):193–209. https://doi.org/http://link.springer.com/10.1007/s00704-017-2359-3.
- Bayburt S, Kurtak AB, Büyüksalih G, Jacobsen K. 2017. Geometric accuracy analysis of worlddem in relation to AW3D30, SRTM AND ASTER GDEM2. Int Arch Photogramm Remote Sens Spatial Inf Sci. XLII-1/W1:211–217. [Internet]. XLII-1/W1. http://www.int-arch-photogramm-remote-sens-spatial-inf-sci.net/XLII-1-W1/211/2017/.
- Bhatta B, Shrestha S, Shrestha PK, Talchabhadel R. 2020. Modelling the impact of past and future climate scenarios on streamflow in a highly mountainous watershed: A case study in the West Seti River Basin, Nepal. Sci Total Environ. 740:140156. [Internet]..
- Chhatkuli RR. 2003. Building Spatial Database for NGII in Nepal. In ESRI User Conf Proc. https://proceedings.esri.com/library/userconf/proc03/p1101.pdf; p. 1–11.
- Chhetri TB, Dhital YP, Tandong Y, Devkota LP, Dawadi B. 2020. Observations of heavy rainfall and extreme flood events over Banke-Bardiya districts of Nepal in 2016–2017. Prog Disaster Sci. 6:100074. https://linkinghub.elsevier.com/retrieve/pii/S2590061720300119.
- Das S, Patel PP, Sengupta S. 2016. Evaluation of different digital elevation models for analyzing drainage morphometric parameters in a mountainous terrain: a case study of the Supin-Upper Tons Basin, Indian Himalayas. Springerplus. 5(1):1544. https://doi.org/http://springerplus.springeropen.com/articles/10.1186/s40064-016-3207-0.
- Devkota R, Bhattarai U, Devkota L, Maraseni TN. 2020. Assessing the past and adapting to future floods: a hydro-social analysis. Clim Change. 163(2):1065–1082. https://doi.org/http://link.springer.com/10.1007/s10584-020-02909-w.
- DHM. 2018. Standard operating procedure for flood early warning system in Nepal. http://hydrology.gov.np/cm/files/SoftcopyEWSSoP_1534225888786.pdf.
- Farr TG, Rosen PA, Caro E, Crippen R, Duren R, Hensley S, Kobrick M, Paller M, Rodriguez E, Roth L, et al. 2007. The shuttle radar topography mission. Rev Geophys [Internet]. 45(2):RG2004. https://doi.org/http://doi.wiley.com/10.1029/2005RG000183.
- Hashimoto M, Yoneyama N, Kawaike K, Deguchi T, Hossain MA, Nakagawa H. 2018. Flood and substance transportation analysis using satellite elevation data: A case study in Dhaka City. JDR. 13(5):967–977. https://www.fujipress.jp/jdr/dr/dsstr001300050967.
- Hsu Y-C, Prinsen G, Bouaziz L, Lin Y-J, Dahm R. 2016. An investigation of DEM resolution influence on flood inundation simulation. Proc Eng. 154:826–834. [Internet]. https://doi.org/http://dx.doi.org/10.1016/j.proeng.2016.07.435.
- Jacobsen K. 2016. Analysis and correction of systematic height model errors. Int Arch Photogramm Remote Sens Spatial Inf Sci. XLI-B1:333–339. http://www.int-arch-photogramm-remote-sens-spatial-inf-sci.net/XLI-B1/333/2016/.
- Karki R, Hasson S, Ul Gerlitz L, Talchabhadel R, Schenk E, Schickhoff U, Scholten T, Böhner J. 2018. WRF-based simulation of an extreme precipitation event over the Central Himalayas: Atmospheric mechanisms and their representation by microphysics parameterization schemes. Atmos Res. 214(February):21–35. https://linkinghub.elsevier.com/retrieve/pii/S0169809518301844.
- Kawaike K, Inoue K, Toda K. 2000. Inundation flow modeling in urban area based on the unstructured meshes. Hydrosoft 2000, Hydraul Eng Softw. VIII:457–466.
- Kayastha DM. 2002. Database generalization and production of derived maps at 1:100000 and 1:250000 scales using NTDB in NGII context. Nepal J Geoinformatics, 1 , 42-28.
- Krishnan S, Sajikumar N, Sumam KS. 2016. DEM generation using Cartosat-I stereo data and its comparison with publically available DEM. Proc Technol. 24:295–302. https://linkinghub.elsevier.com/retrieve/pii/S2212017316301232.
- Li J, Wong DWS. 2010. Effects of DEM sources on hydrologic applications. Comput Environ Urban Syst. 34(3):251–261. [Internet]. https://doi.org/http://dx.doi.org/10.1016/j.compenvurbsys.2009.11.002.
- Manuel P. 2004. Influence of DEM interpolation methods in drainage analysis. GIS Hydro 04, Texas, US.
- Md Ali A, Solomatine DP, Di Baldassarre G. 2015. Assessing the impact of different sources of topographic data on 1-D hydraulic modelling of floods. Hydrol Earth Syst Sci. 19(1):631–643. https://hess.copernicus.org/articles/19/631/2015/.
- Mondal A, Khare D, Kundu S, Mukherjee S, Mukhopadhyay A, Mondal S. 2017. Uncertainty of soil erosion modelling using open source high resolution and aggregated DEMs. Geosci Front. 8(3):425–436. https://linkinghub.elsevier.com/retrieve/pii/S1674987116300226.
- Musumari H, Nakagawa H, Kawaike K, Talchabhadel R. 2019. Numerical simulation of pluvial inundation considering gate operation. J Japanese Soc Nat Disaster Sci. 38(Special):97–108. https://doi.org/https://doi.org/10.24762/jndsj.38.S06_97.
- Nikolakopoulos KG. 2020. Accuracy assessment of ALOS AW3D30 DSM and comparison to ALOS PRISM DSM created with classical photogrammetric techniques. Eur J Remote Sens. 53(sup2):39–52. https://doi.org/https://www.tandfonline.com/doi/full/10.1080/22797254.2020.1774424.
- Orlandi AG, Carvalho JO, de Guimarães RF, Bias E de S, Corrêa DC, Gomes RAT. 2019. Vertical Accuracy Assessment Of The Processed SRTM data for the Brazilian Territory. Bol Ciências Geodésicas. 25(4), 1-14, e2019021. http://www.scielo.br/scielo.php?script=sci_arttext&pid=S1982-21702019000400200&tlng=en.
- Pandey VP, Dhaubanjar S, Bharati L, Thapa BR. 2020. Spatio-temporal distribution of water availability in Karnali-Mohana Basin, Western Nepal: Hydrological model development using multi-site calibration approach (Part-A). J Hydrol Reg Stud. 29:100690..
- Patel A, Katiyar SK, Prasad V. 2016. Performances evaluation of different open source DEM using Differential Global Positioning System (DGPS). Egypt J Remote Sens Sp Sci. 19(1):7–16. https://linkinghub.elsevier.com/retrieve/pii/S1110982315000745.
- Purinton B, Bookhagen B. 2017. Validation of digital elevation models (DEMs) and comparison of geomorphic metrics on the southern Central Andean Plateau. Earth Surf Dynam. 5(2):211–237. https://esurf.copernicus.org/articles/5/211/2017/.
- Rana VK, Suryanarayana TV. 2019. Visual and statistical comparison of ASTER, SRTM, and Cartosat digital elevation models for watershed. J Geovisualization Spat Anal. 3(2):12. https://doi.org/http://link.springer.com/10.1007/s41651-019-0036-z.
- Reliefweb. 2014. Floods and Landslides DREF operation MDRNP007; Emergency Plan of Action (EPoA) [Internet]. [accessed 2020 Jan 14]. https://reliefweb.int/report/nepal/nepal-floods-and-landslides-dref-operation-mdrnp007-emergency-plan-action-epoa.
- Rexer M, Hirt C. 2014. Comparison of free high resolution digital elevation data sets (ASTER GDEM2, SRTM v2.1/v4.1) and validation against accurate heights from the Australian National Gravity Database. Aust J Earth Sci. 61(2):213–226. https://doi.org/http://www.tandfonline.com/doi/abs/10.1080/08120099.2014.884983.
- Saksena S, Merwade V. 2015. Incorporating the effect of DEM resolution and accuracy for improved flood inundation mapping. J Hydrol. 530:180–194. https://doi.org/http://dx.doi.org/10.1016/j.jhydrol.2015.09.069.
- Santillan JR, Makinano-Santillan M. 2016. Vertical accuracy assessment of 30-m resolution ALOS, ASTER, and SRTM global DEMs over northeastern Mindanao, Philippines. Int Arch Photogramm Remote Sens Spatial Inf Sci. XLI-B4(July):149–156. [Internet]. http://www.int-arch-photogramm-remote-sens-spatial-inf-sci.net/XLI-B4/149/2016/isprs-archives-XLI-B4-149-2016.pdf.
- Takaku J, Tadono T, Tsutsui K. 2014. Generation of high resolution global DSM from ALOS PRISM. ISPRS - Int Arch Photogramm Remote Sens Spat Inf Sci. XL–4(4):243–248.
- Talchabhadel R, Nakagawa H, Kawaike K. 2019. Effects of DEM accuracy on sediment modelling results. In IAHR World Congr. Panama; p. 4729–4739, IAHR.DOI: https://doi.org/10.3850/38WC092019-1268
- Talchabhadel R, Nakagawa H, Kawaike K, Yamanoi K, Prajapati R. 2020. Numerical simulation of inundation process of a heavy precipitation event: A case study of August 2014 in West Rapti River basin, Nepal. In RiverFlow 2020. London: Taylor & Francis Group; p. 1–9.
- Talchabhadel R, Prajapati R, Aryal A, Maharjan M. 2020. Assessment of rainfall erosivity (R-factor) during 1986-2015 across Nepal: a step towards soil loss estimation. Environ Monit Assess. 192(5):293. https://doi.org/http://link.springer.com/10.1007/s10661-020-8239-9.
- Talchabhadel R, Nakagawa H, Kawaike K, Prajapati R. 2020. Evaluating the rainfall erosivity (R-factor) from daily rainfall data: an application for assessing climate change impact on soil loss in Westrapti River basin, Nepal. Model Earth Syst Environ. https://doi.org/http://link.springer.com/10.1007/s40808-020-00787-w.
- Tarekegn TH, Haile AT, Rientjes T, Reggiani P, Alkema D. 2010. Assessment of an ASTER-generated DEM for 2D hydrodynamic flood modeling. Int J Appl Earth Obs Geoinf. 12(6):457–465. https://linkinghub.elsevier.com/retrieve/pii/S0303243410000620.
- Thapa BR, Ishidaira H, Bui TH, Shakya NM. 2016. Evaluation of water resources in mountainous region of Kathmandu Valley using high resolution satellite precipitation product. J JSCE, Ser G. 72(5):I_27–I_33. https://www.jstage.jst.go.jp/article/jscejer/72/5/72_I_27/_article/-char/ja/.
- Thapa BR, Ishidaira H, Pandey VP, Shakya NM. 2017. A multi-model approach for analyzing water balance dynamics in Kathmandu Valley. Nepal. J Hydrol Reg Stud. 9:149–162. https://doi.org/http://dx.doi.org/10.1016/j.ejrh.2016.12.080.
- Thomas J, Joseph S, Thrivikramji KP, Arunkumar KS. 2014. Sensitivity of digital elevation models: The scenario from two tropical mountain river basins of the Western Ghats. India. Geosci Front. 5(6):893–909. https://doi.org/http://dx.doi.org/10.1016/j.gsf.2013.12.008.
- Wagle N, Acharya TD. 2020. Past and present practices of topographic base map database update in Nepal. IJGI. 9(6):397. https://www.mdpi.com/2220-9964/9/6/397.
- Yamazaki D, Baugh CA, Bates PD, Kanae S, Alsdorf DE, Oki T. 2012. Adjustment of a spaceborne DEM for use in floodplain hydrodynamic modeling. J Hydrol. 436–437:81–91. https://doi.org/http://dx.doi.org/10.1016/j.jhydrol.2012.02.045.
- Yamazaki D, Ikeshima D, Tawatari R, Yamaguchi T, O'Loughlin F, Neal JC, Sampson CC, Kanae S, Bates PD. 2017. A high-accuracy map of global terrain elevations. Geophys Res Lett. 44(11):5844–5853. https://doi.org/http://doi.wiley.com/10.1002/2017GL072874.