
 ?Mathematical formulae have been encoded as MathML and are displayed in this HTML version using MathJax in order to improve their display. Uncheck the box to turn MathJax off. This feature requires Javascript. Click on a formula to zoom.
Abstract
The representation of terrain propensity to generate landslides, meaning the mapping of landslide susceptibility, represents a first step in the assessment of the risk induced by these geomorphological hazards. Results of the numerous studies differ according to the available input data, the applied methodology, the level of detail or the scale of analysis. The main goal of the present study is to provide a new landslide susceptibility map for the national territory of Romania. The application of the European Landslide Susceptibility (ELSUS) mapping methodology, based on the analytical hierarchy process (AHP), using more accurate and higher spatial resolution input data, led to the achievement of a landslide susceptibility map within individual climate-physiographic zones across the country. The landslide susceptibility is computed by combining the information regarding landslide frequency with a Spatial Multi-Criteria Evaluation (SMCE) model based on three predictors (slope angle, lithology and land cover). The continuous landslide susceptibility model was validated by receiver operating characteristic (ROC) analysis, which indicated a better performance in the plateau, hilly and plain areas (AUC = 0.750) compared to the mountain area. Also, an independent sample validation was performed for testing the consistency of the landslide susceptibility classes. The classified susceptibility map shows patterns that are in agreement with terrain reality.
1. Introduction
Landslides are mass movement processes on slopes manifesting throughout the world, having a hazard character with important environmental and economic consequences. The management of their induced risk is envisaged by decision makers for different strategies at local, national, regional or continental scales. Within the numerous studies devoted to landslide risk assessment the representation of the terrain propensity to generate landslides, meaning the mapping of landslide susceptibility, constitute an important preliminary step (Guzzetti et al. Citation1999; Fell et al. Citation2008). The evaluation of landslide susceptibility or spatial occurrence probability of landslides under the control of the local terrain conditions is a good illustration of the principle according to which a certain future event will manifest in similar circumstances as those from the past or present (Carrara et al. Citation1991; Hutchinson Citation1995; Ercanoglu Citation2008; Furlani and Ninfo Citation2015).
The methodology of landslide susceptibility assessment proposed in the literature is diverse, including qualitative or quantitative, and direct or indirect approaches and methods, which can be grouped into five broad categories (Reichenbach et al. Citation2018): geomorphological mapping, analysis of landslide inventories, heuristic or index-based approaches, process-based methods, and statistically-based modelling methods. Certainly, the results differ more or less according to the quality of input data (e.g., landslide inventory and predictors), the applied methodology, the level or scale of analysis, the hardware performance, the specific needs of the stakeholders etc.
Generally, landslide susceptibility assessment at medium and large scales (<1:1,000,000) can be approached by quantitative methods requiring an extensive variables’ dataset and a as complete as possible inventory of landslides in the study area, while studies at small scale (for large areas) can apply qualitative methods based on expert judgements and considering a small number of landslide predictors. Within the latter category we may mention studies at national scale (Bălteanu et al. Citation2010; Sakkas et al. Citation2016), continental scale (Günther et al. Citation2013; Jaedicke et al. Citation2014; Broeckx et al. Citation2017) and global scale (Nadim et al. Citation2006; Hong et al. Citation2007), in which the susceptibility mapping is carried out without information regarding the landslide inventory and whose inconveniences are the high generalization degree and the coarse resolution. On the other hand, efforts are being made for supplementing the lack of such information by carrying out and completing the landslide inventories and integrating them into national scale, for example: Cuba (Castellanos Abella and van Westen Citation2008), Greece (Sabatakakis et al. Citation2013), France (Malet et al. Citation2013), Italy (Trigila et al. Citation2013), Georgia (Gaprindashvili and van Westen Citation2016), Turkey (Okalp and Akgün Citation2016), Romania (Bălteanu et al. Citation2017, Citation2020) and Austria (Lima et al. Citation2017) or continental scale evaluations (Van Den Eeckhaut et al. Citation2012; Günther et al. Citation2014; Wilde et al. Citation2018). In the last two mentioned studies, within the framework of the Pan-European and Nation-Wide Landslide Susceptibility Assessment project (2012-2015), a European landslide susceptibility map was produced for the purpose of meeting the need of using available datasets at Pan-European scale and to apply straightforward methodologies. The production of the susceptibility model (ELSUS model) was based on a semi-quantitative method, namely the analytical hierarchy process (AHP) (Saaty Citation1980), applied in other studies too (Ayalew et al. Citation2005; Komac Citation2006; Bai et al. Citation2008; Yalcin Citation2008; Hasekioğulları and Ercanoglu Citation2012; Patriche et al. Citation2016; Grozavu et al. Citation2017).
In Romania, the interest for the study of landslide susceptibility has grown in the past two decades, with significant results coming for both qualitative, expert knowledge-based approaches and statistical, bivariate and multivariate, analyses (Chiţu et al. Citation2009, 2014; Micu and Bălteanu, 2009; Constantin et al. Citation2011; Armaş Citation2011a, Citation2011b; Mărgărint et al. Citation2013; Grozavu et al. Citation2013, Citation2017; Zumpano et al. Citation2014; Patriche et al. Citation2016; Micu Citation2017a, Citation2017b; Necula and Niculiţă, Citation2017; Mărgărint and Niculiţă, Citation2017; Niculiţă et al., Citation2018),while the scales of analysis generally range from local to regional.
Only few studies approach the landslide topic for the entire Romanian territory. In 2003, by the Romanian Government Decision no. 477/2003, a semi-quantitative methodology was implemented as standard for landslide risk maps elaboration. This methodology has an important drawback, namely the assignment of the same weight to a number of eight contributing factors, regardless of their position and significance inside the various geomorphological units from Romania. Concerning landslide susceptibility mapping, we notice the first country-wide evaluation model proposed by Bălteanu et al. (Citation2010) based on expert knowledge. In the context of the development of the ELSUS model several maps were proposed for the evaluation of susceptibility in Romania for landslides, flows and falls (Micu et al. Citation2014; Micu Citation2017a). The RO-RISK project (2016-2018, https://gis.ro-risk.ro/site/) coordinated by the Romanian General Inspectorate for Emergency Situations (IGSU) attempted to evaluate the main risks affecting Romania, including landslides. The proposed landslide susceptibility map is quite similar to the one achieved by Bălteanu et al. (Citation2010) and it was used to investigate the possible effects of climate change on landslide hazard at a national scale (Jurchescu et al. Citation2017). Recently, Bălteanu et al. (Citation2020) published a new national-scale landslide susceptibility map obtained by applying a combined statistical-heurstic approach based on Spatial Multi-Criteria Evaluation (SMCE) procedure and a consistent landslide inventory achieved by data exchange between several institutions and personal mapping surveys, containing also detailed descriptions of the main landslide types.
Starting from the fact that Romania may be considered as one of the European countries most affected by landslides, and that a national landslide inventory is not yet satisfactorily homogeneous and publicly available, our study attempts to address the recommendation that the European landslide susceptibility model “should be further validated quantitatively with higher spatial resolution inventory information and susceptibility maps at regional and national levels” (Wilde et al. Citation2018). Our main goal is to provide a more accurate landslide susceptibility map for the national territory applying the ELSUS mapping methodology, based on the AHP, using more accurate and higher spatial resolution input data. We used the 25 × 25 m resolution EU-DEM (European Environment Agency Citation2016a) for deriving the slope factor (compared to the 200 × 200 m resolution in ELSUS v2), the Corine Land Cover (CLC) 2012 (European Environment Agency Citation2016b) map for deriving the land cover factor, which corresponds to a spatial resolution of 100 × 100 m (compared to the 300 × 300 m resolution of GlobCover dataset used in ELSUS v2) and a combination of soil map at 1:200,000 scale (Florea et al., 1963-Citation1993) and geology maps at 1:200,000 scale (Romanian Geological Institute, 1960-Citation1969) for deriving the lithology factor (compared to the 1:1,500,000 scale lithology map used in ELSUS v2).
Moreover, the study aims to see how this model performs at national scale, by analysis of the achieved cartographic materials and results. One original aspect of our study is the achievement of an own landslide inventory which may be available to interested scientists, therefore contributing to establishment and completion of a national database available to landslide experts. The study also aims to carry out a brief but useful insight on the state of the art research on landslide susceptibility mapping at national scale, formulating discussions of interest regarding own results, as well as the results of similar national scale studies carried out in other countries.
The outcome of our approach is meant to meet the need of users to have a general image of areas at risk of landslides and access to a rapid appraisal regarding the landslides spatial occurrence probability based on the national terrain conditions – landslides relation. Our study can contribute to a better understanding by the decision-making factors of the landslide susceptibility mapping process and its ability to estimate the associated risks, issues which are clearly useful for the formulation of a general framework of different policies or strategies (such as the projects of designing and developing future communication ways and utility networks which are currently being implemented in our country). Moreover, our results can assist the different stakeholders and land use practitioners in evaluating the negative consequences of landslides on infrastructure, agricultural land etc. and in a sustainable management of land resources. The beneficiaries may choose our map as a work instrument for several reasons: landslide inventory was achieved using a uniform methodology, landslides were accurately delineated as polygons from precise georeferenced maps; high spatial resolution input data was used for deriving slope, lithology and land use layers; LSI was computed for the different climate-physiographic zones, ensuring increased intuitiveness and facilitating policy and strategy formulation at regional and national scales.
2. Geological and geomorphological settings of Romania
Situated in Eastern Europe, in an interference zone of geomorphological, climatic and bio-pedogeographical factors, Romania is characterized by a great variety and geographical complexity. Its territory lies within two large morphostructural units – orogen and platform – divided into subunits of different dimensions, with their own characteristics (Posea et al. Citation1974) ().
Figure 1. Major landform units of Romania and hypsometry.
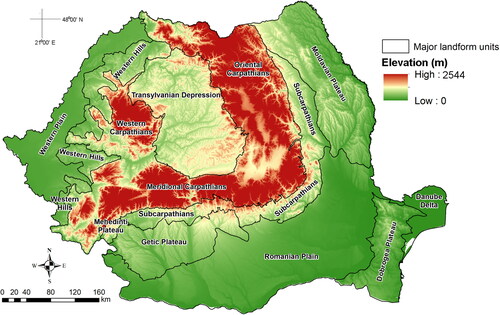
The orogen unit comprises: 1) The Romanian Carpathian Mountains (maximum elevation: 2544 m) – spread out in the shape of a circular arc in the center of the country, consisting of crystalline formations, volcanic rocks and flysch sedimentary formations. In the Oriental Carpathians, where geological formations are arranged in parallel strips, the volcanic chain occupies their western part and it is made up mainly of andesites and volcanic conglomerates. The Paleogene flysch area is present in the eastern part of the Oriental Carpathians and in the Curvature Carpathians and it is represented mainly by clay schists, limestones, conglomerates, sandstones, marlstones, intensely folded within nappes. 2) The Transylvanian Depression – is situated inside the Carpathian arc, it has a tectonic origin (being subjected to a sinking process since the end of the Mesozoic era) and its sedimentary fill includes volcanic tuffs, salt formations, marlstones, clays and sands. 3) The peri-Carpathic Hills (Subcarpathians) – border the Carpathians towards east and south and they are developed on folded Neogene mollase formations (sandstones, clays, marlstones, gravels, gyps and salt formations). The Getic Plateau is also included here, situated in the south of Subcarpathian sector with the same name, being consisting of Pliocene and Quaternary strata (mainly gravels and sands) with monocline structure. 4) The Western Hills and Plain – occupy the western part of the country, overlapping the edge of the Pannonian Basin (formed at the same time as the Transylvanian Depression) and it consists of sedimentary formations (clays, marls, gravels and sands) of Pliocene and Quaternary age.
Some parts of the orogen area (Carpathians and Subcarpathians) are neotectonic active, subject to lifting or downward movements with rates of several mm yr−1, being also the source of an important seismic activity (especially in the Vrancea seismic zone from the Curvature Carpathians).
The platform unit includes the plateau and plain landform units situated outside the Carpathians: 1) The Moldavian Plateau – occupies the eastern part of Romania, overlapping the south-eastern extremity of the East-European Platform. This unit is developed on sedimentary rock layers of Miocene and Pliocene age represented by alternances of clays, marls, sandstone and sand complexes, disposed in a monocline structure over an old Precambrian basement. 2) The Romanian Plain – is situated in the south of the country, overlaying the Moesic Platform, its basement sinking deeply towards north under the Carpathians. The upper sedimentary cover is represented by clays, marls, sands and loams (loess) of upper Miocene and Pliocene-Quaternary age. 3) The Dobrogea Plateau – occupies the south-eastern extremity of the country, being the oldest morphostructural unit. It has a Precambrian and Paleozoic basement, made up of crystalline schists and granites, overlapped by Mesozoic sedimentary formations. This landform unit has a mountain-like morphology in the north, where remnants of old Hercynian mountains are present, and the appearance of low altitude plateaus in the central and southern part, where Precambrian green schists emerge from place to place on the surface. 4) The Danube Delta – partially overlays the Hercynian Predobrogean Depression, being covered with deltaic Quaternary formations resting on older sedimentary layers.
Romanian climate is temperate continental with oceanic influences in the western and central part and more pronounced continental influences in the eastern and southern part, with an obvious altitudinal zonation of climate elements imposed by topography. The average annual precipitation amounts vary between 400 − 600 mm yr−1, in the lower plain and plateau areas, and 1000 − 1400 mm yr−1, in the mountain area. Their regime illustrates an uneven distribution in time and space, with large monthly, seasonal and annual variations, which directly influences slope stability.
The current relief evolution is done through a wide variety of geomorphological processes, including sheet and linear water erosion, mass displacements, coastal erosion, karst processes, anthropic modelling, whose magnitude, rhythm and intensity depend on multiple natural and anthropogenic factors.
Landslides, which are controlled by the geological structure, lithology, relief and land cover and triggered by heavy precipitations, earthquakes and human actions like resources exploitation, deforestations etc., have a large distribution, occur under various shapes and represent sometimes the dominant process for slope modelling.
The regions characterized by high frequency of these processes include: a) The Subcarpathians and the mountains of Paleogene flysch, intensely affected by shallow translational slides and flows, but also by medium and deep-seated, and complex displacements (rock/debris/earth slumps and rock slides) (Micu Citation2017b); b) The Moldavian Plateau, affected by translational, shallow landslides and earth flows as well as old deep-seated and complex landslides (Mărgărint and Niculiță, 2017); c) The Transylvanian Depression, distinguished by high frequencies of shallow translational slides as well as old rotational, deep-seated landslides (glimee in Romanian) and rock slumps;
Regions with medium frequency of landslide processes include the Getic Plateau and Western Hills, characterized by the development of complex processes such as infiltration, piping and erosion, which precede and favour translational and rotational earth and debris slides.
3. Materials and methods
The first step of our approach was the preparation of the landslide inventory covering, as much as possible, the main landform units belonging to each so-called “climate-physiographic zones” of Romania (Günther et al. Citation2014; Wilde et al. Citation2018). The next step was to assess the landslide susceptibility, based on ELSUS methodology (Günther et al. Citation2014; Wilde et al. Citation2018). Data on three landslide susceptibility factors (slope, lithology and land cover) were acquired and processed, considering that their influence is different under different climatic conditions. In this regard, based on combinations of Köppen climate classification and mountain area classification (Nordregio Citation2004), there were delineated a number of five climate-physiographic zones. The AHP was used to derive factor weights and factor class weights from a pairwise comparison matrix, based on normalized landslide frequency ratios and expert knowledge adjustments. Finally, the landslide susceptibility index (LSI) was computed by summing the products of factor weights and class weights, and the spatial model was validated through the receiver operating characteristic (ROC) curves and independent sample class validation.
3.1. The landslide inventory
This important issue was provided by individual mapping projects which we carried out as part of several previous studies (Grozavu et al. Citation2013; Mărgărint et al. Citation2013; Patriche et al. Citation2016; Grozavu et al. Citation2017) (). As mapping techniques we digitized landslides as polygons by visual interpretation of 1;25,000 Romanian topographic map with Gauss-Krüger transversal polycylindric projection, 1984 edition, 1:200,000 Romanian geology map, 1969 edition, and aerial imagery, such as 2006 orthophotos with a spatial resolution of 0.5 m and Google EarthTM imagery whose use as a source of information for landslide distribution mapping has been growing in the recent years (Posner and Georgakakos Citation2015; Conoscenti et al. Citation2016; Broeckx et al. Citation2017). This stage was followed by terrain verifications and validations carried out in 2013, 2016, 2017 si 2019. The inventory achieved by Grozavu et al. (Citation2013) was accomplished on a flysch mountain region of about 210 km2 placed in the Curvature Carpathians, while the inventory of Mărgărint et al. (Citation2013) focussed on four sectors, each covering an area of 225 km2, from different regions in Romania situated both in hilly (two sectors from the Moldavian Plateau and one sector from the Transylvanian Depression) and lower mountain areas (one sector from the Moldavian Subcarpathians). The inventory achieved by Patriche et al. (Citation2016), focussed on a river basin of 130 km2 from the Central Moldavian Plateau, while the one prepared by Grozavu et al. (Citation2017) considered the Bârlad Plateau (a 9100 km2 subunit situated in southern Moldavian Plateau) as study area. For the present study we enlarged the landslide database, especially in the mountain area, by interpretations of the geological maps, topographical maps, Google EarthTM imagery and field verifications carried out in the summer of 2019.
Table 1. Landslide inventory: study zones, number of polygons and area.
Only areas with obvious manifestation of sliding processes were mapped, belonging to slides and flows types defined according to the classification of Cruden and Varnes (Citation1996), which present a distinctive landsliding morphology and clearly defined boundaries (Ohlmacher and Davis Citation2003). Regarding the evolution stage, we have considered both active and inactive or dormant landslides, the latter being dominant in all analyzed regions especially in the Subcarpathian area. Regarding landslide movement, most of them are translational, generally shallow and medium seated (< 5 m), found in all landform units, and rotational, generally deep seated (> 5 m) specific to parts of Moldavian and Transylvanian plateaus and to the morphostructural contact areas between the Carpathians and the Subcarpathians. There were also identified flows, which are present especially in the Subcarpathians and in Carpathian flysch area. It is to be noted the difficulties in performing a correct assessment of landslide ages and evolutions.
The total sample includes 8790 landslides with a total area of about 69,400 ha (694 km2). The inventory does not cover the coast and plain areas, where landslides are virtually missing, but they only represent about 2% of the Romania territory.
3.2. Thematic layers for modelling
The climate-physiographic zones of Romania resulted from the intersection of two maps: mountain area map and Köppen climate classification map. Nordregio (Citation2004) provides a quantitative methodology for mountain area delineation in Europe based on several geomorphometric parameters, including altitude, slope, local elevation range and elevation standard deviation. We applied this methodology for Romania using the 25 × 25 m resolution EU-DEM. The world Köppen climate classification of Peel et al. (Citation2007) proved insufficient for a proper country-wide delineation of the climate-physiographic zones because it used a small number of meteorological stations for the Romanian territory. Consequently, we used a Köppen climate classification map produced by the National Meteorological Administration (National Meteorological Administration (NMA), 2008) for the Romanian territory. Based on combinations of these climate classification and mountain area classification, we have delineated five climate-physiographic zones: Z0 for coast, Z2, Z3 for plain, and Z4, Z6 for mountain zones.
The slope factor layer was derived from the 25 m resolution EU-DEM and group the slopes into 8 classes (): 1 = 0°; 2 = 1°-3°; 3 = 4°-6°; 4 = 7°-10°; 5 = 11°-15°; 6 = 16°- 20°; 7 = 21°- 30°; 8 = 31°- 82°. On the other hand, the slope layer was classified 3 times according to the climate-physiographic zones (one classification for Z0; one classification for Z2 and Z3; one classification for Z6). Then, the class codes (from 1 to 8) of these classified slope layers were integrated according to the climate-physiographic regions, using the Raster Calculator module from ArcGIS software and the conditional function (Con). Next, the resulting raster layer was multiplied with 10 and added to the raster layer comprising the codes for the climate-physiographic zones (0, 2, 3 and 6), resulting unique combinations of slope classes and climate-physiographic regions (from 10 – slope class 1 in Z0 zone to 86 – slope class 8 in Z6 zone). The slope class weights from Wilde et al. (Citation2018) were then attached to these unique combinations within the attribute table, followed by a conversion into raster according to these weights, resulting the slope class weight layer.
Table 2. Weights of landslide susceptibility factors (in bold) and factor classes (extracted from Wilde et al. Citation2018).
The lithology factor was derived combining information from the soil map at 1:200,000 scale (Florea et al., 1963-Citation1993) and geology map at 1:200,000 scale, resulting in 15 lithology classes (). The organic lithology class is present in the Danube Delta as well as other marshy depression areas, under the form of peats. Being flat terrains, they were assigned a weight of zero. The alluvium/colluvium materials could not be integrated into another lithology class (e.g., clays, silts) because the texture of the alluvial deposits may vary quite a lot, from gravels and sands in the mountainous areas, to silts and clays in the hilly and plain regions. Therefore, our solution was to assign to the alluvium/colluvium materials an average weight computed from the weights of gravel, sand, silt and clay. The other lithology classes were delineated based on soil and geology maps. As a general rule, the soil map was used to define the lithology classes in situations where the subsurface lithology could be easily inferred from soil types (e.g., Vertisols were assigned to clays class, Rendzina to limestones class, sandy soils to sands class, Andosols to volcanic rocks class, Chernozems to silts because they are developed on loess-like formations etc). The geology map was used especially in the mountain area to define classes such as schists, phyllites, quartzites, marbles; sandstones and conglomerates; sandstones and marls etc. After assigning the classes, we recorded the class weights and produced the lithology class weight parameter map.
The land cover factor in our model is based on the CLC (2012) map, which corresponds to a spatial resolution of 100 × 100 m (). Firstly, the land cover classes were recorded into the attribute table of the CLC vector layer, then the polygons were dissolved according to this attribute. The resulting vector layer was converted into a raster layer in which land cover classes were assigned numerical values from 1 to 8. We kept 7 out of 8 land cover classes, by using only the pastures/meadows class and not the meadow class separately. The 8th code was assigned to the water bodies class from CLC. Next, we proceeded in a similar manner as in the case of the slope factor, by multiplying the land cover raster layer with 10 and by adding it to the raster layer comprising the codes for the climate physiographic regions (0, 2, 3 and 6). It resulted unique combinations of land cover classes and climate-physiographic regions (from 10 – artificial class in Z0 zone to 76 – shrub class in Z6 zone). Next, we attached the weights of the land cover factor according to Wilde et al. (Citation2018) to these unique combinations. The land cover classes from the Z0 zone, as well as the 80, 82, 83 and 86 codes, corresponding to the water bodies, were given a weight of zero.
3.3. The computation of the LSI and the validation of the spatial model
In order to allow data extraction the landslide polygons were converted into regular spaced grid points. The AHP was used to derive factor weights () from a pairwise comparison matrix for coast, plain and mountain climate-physiographic zones. Then, the class weights () were computed for each of the three factors based on normalized landslide frequency ratios and expert knowledge adjustments (Wilde et al. Citation2018). The computation of the landslide susceptibility index (LSI) is done by multiplying factor weights and class weights, according to the formula:
where: wj is the weight of the j factor and xij is the weight of class i for factor j.
Then, the LSI values were grouped into five susceptibility classes, using different class thresholds for Z6 and Z0 zones (3%, 7%, 15%, 25% and 50% of landslide points for delineating the very low, low, moderate, high and very high susceptibility classes) and for Z2, Z3 and Z4 zones (10%, 15%, 25% and 50% of landslide points for delineating the very low, low, moderate and high susceptibility classes). Considering the very different topography of mountain (Z6) and coastal zones (Z0), on one hand, and plain, plateau and hilly zones (Z2, Z3, Z4), on the other hand, the former are expected to have higher landslide susceptibility. For this reason, the “very high” susceptibility class is present only in Z6 and Z0. In addition, the criterion for separating the highest susceptibility class in each of the two zone categories (“very high” in Z6, Z0 and “high” in Z2, Z3, Z4) was the presence of 50% of landslide points in this class, while the criterion for the separation of the lowest susceptibility classes (“low” and “very low” in Z6, Z0 and “very low” in Z2, Z3, Z4) was the presence of 10% of landslide points (Günther et al. Citation2014).
The total landslide samples used for the LSI classification include, as already mentioned, 8790 landslides (2249 landslides in Z6 and 6541 landslides in Z3), with a total area of 694 km2 (about 226 km2 in Z6 and 468 km2 in Z3), while for Z0 and Z2 an inventory was not available.
The continuous LSI model was validated through the ROC curves computed for landslide samples from the hilly, plateau and plain areas (Z3 zone) and the mountain area (Z6 zone). An independent sample validation procedure was applied to the classified LSI model. The validation was carried out separately for Z6 and Z3 zones. For this purpose, the landslide sample was randomly split into two equal samples, one being used for susceptibility class separation, the other for independent class validation.
4. Results and discussions
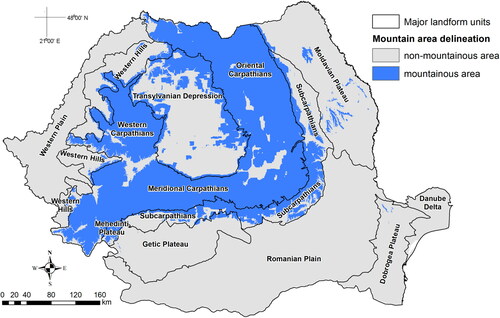
The main morphostructural subunits of Romania previously mentioned are presented in . The major landform units and the delineation of mountainous and non-mountainous areas of the country are presented in , obtained by applying Nordregio (Citation2004) methodology using the 25 m resolution EU-DEM and overlapping the major landform units of the country according to Posea et al. (Citation1974), and Posea and Badea (Citation1984). We notice that there is a good agreement between the geographically delineated mountain area (the Carpathians) and the mountain area delineated according to Nordregio (Citation2004) methodology. All of the Carpathians area falls into the delineated mountain area, except for several large intra-mountainous depressions. On the other hand, there are extensive areas outside the Carpathians classified as mountain area according to Nordregio (Citation2004) methodology. Most of these areas are found within the Subcarpathians, which are mountains form a geological and morphometric point of view. Some areas are found in hilly and plateau areas, as in the Moldavian Plateau, the North and East of the Transylvanian area, or in the Mehedinti Plateau. These areas are indeed characterized by a mountain-like morphometry, even though they are developed on non-folded geological structures.
Figure 2. Delineation of mountainous and non-montainous areas.
The Köppen climate classification map of Romania is quite different from the one extracted from the map of Peel et al. (Citation2007) (). They do have in common the large extent of the Dbf type of climate. The Dfa climate is more extended in the NMA map, while the Cfa type, which extends along the Black Sea coast in NMA map, is also present in the southwestern part of the country in the Peel et al. (Citation2007) map. The extent of the Dfc and ET climate types, which are characteristic for the mountain area, is clearly inappropriate in the Peel et al. (Citation2007) map, covering only part of the Carpathians. Moreover, in the Peel et al. (Citation2007) map there is a small extent of a type of climate (Cfb) which is not present in the NMA map.
Figure 3. Köppen climate classification according to Peel et al. (Citation2007) (a) and current study (b); climate-physiographic zones according to Wilde et al. (Citation2018) (c) and current study (d).
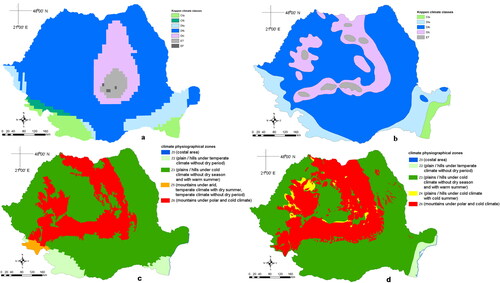
These differences, along with the ones derived from the use of a more accurate DEM for mountain area delineation, are reflected in the maps presenting the extent of the climate-physiographic zones (). We notice that the spatial extent of Z3 and Z6 zones are quite similar, while Z2 zone, which is confined to the coast area in our map, appears also in the southwestern part of the country in the map obtained by Wilde et al. (Citation2018). In our map, a new zone (Z4 zone) appears as a transition area from Z6 (mountains) to Z3 zones.
The slope angle computed from the 25 m resolution EU-DEM has a value range of 0 − 77.7°, a mean value of 7.11° and a standard deviation of 8.02°. The spatial distribution of slope classes is presented in . The classified slope layer () shows that the horizontal class (13.3%) and the 1-3° class (34.2%) cumulate almost half of the total (47.5%). The next 4 classes (from 3-6° to 15-20°) have similar shares, cumulating 44.3%; the high slope classes (20-30° and over 30°) cumulate 8.2%.
Figure 4. Spatial distributions of landslide factors: terrain slope classes (a) and slope class weights (b); surface lithology classes (c) and lithology class weights (d); land cover classes (e) and land cover class weights (f).
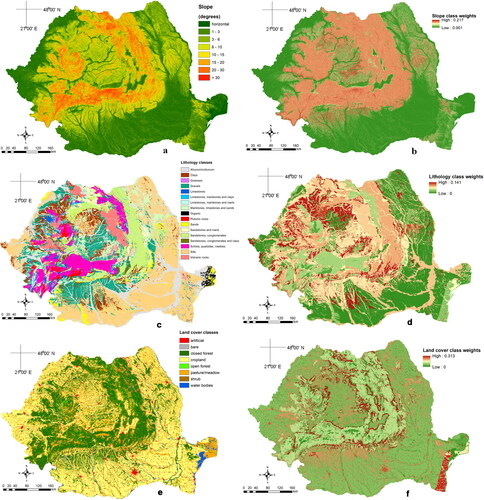
Table 3. Percentages of landslide factor classes from the Romanian territory.
The values of the slope class weight parameter range from 0.001 to 0.217, with a mean value of 0.07 and a standard deviation of 0.06 ().
The lithology map that we compiled from the soil and geological maps of Romania is shown in . It can be seen that the dominant class (27.4%) is represented by the silts class characteristics of most of the hilly, plateau and plain regions from southern and eastern Romania developed on loess-like formations (). The alluvium/colluvium class covers 18.2%, being present in all areas of the country, especially along the valleys. On the 3rd place is the gravels class (11.5%), followed by classes of harder rocks, such as Sandstones and conglomerates (9.5%), and schists, phyllites, quartzites, marbles (8.1%), present in the mountain area. By rational grouping of classes according to rock types and implicitly to their physical and mechanical properties, and due to the good accuracy in delimiting their extension, our lithology map is well suited for landslide susceptibility assessment at national level in Romania.
presents the spatial distribution of the lithology class weights. The values of this parameter range from 0 to 0.140, with a mean value of 0.05 and a standard deviation of 0.03.
The land cover classes used in our model are displayed in . The classified land cover layer () shows that the cropland class occupies almost half of the country's territory (46.7%), being present outside the Carpathians in the regions of low hills, plateaus and plains. The closed forest class occupies 30.2% of the country, being present mainly in the Carpathians and Subcarpathians and in higher areas of hills and plateaus. A significant proportion occupies the pasture/meadow class (14.5%) which is present in the Danube Delta, along the Danube and most of the rivers’ floodplains, on steeper slopes in the hilly areas and at middle and high altitudes in the mountains. The rest of the land cover classes are distributed in much smaller proportions. We notice that the shrub class has a very limited extent (0.02%).
The values of the land cover class weight parameter range from 0 to 0.310, with a mean value of 0.11and a standard deviation of 0.07 ().
shows the continuous spatial distribution of the LSI, which is characterized by a range of values between 0.00064 and 0.19204, with a mean value of 0.066 and a standard deviation of 0.045. The classification of this distribution is presented in . It was performed using the susceptibility class thresholds given in , which were determined on the basis of the training landslide samples for Z3 and Z6 zones (). We notice that the spatial patterns of the classified LSI map show that the very low susceptibility class occupies 50.2%, the low susceptibility class is 8,4%, the moderate susceptibility class holds a share of 14.7%, the high susceptibility class is 13.5%, and the very high susceptibility class is 13.1% of the country (). The total share of the high and very high susceptibility classes is 26.7%.
Figure 5. Map of landslide susceptibility index and the spatial distribution of landslide samples used for classification and validation.
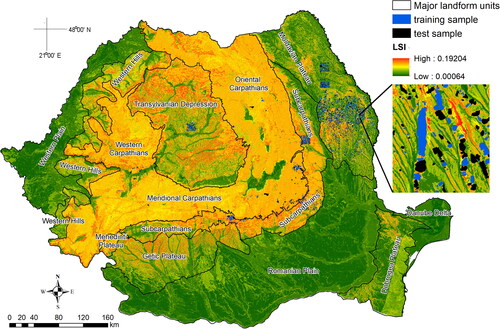
Figure 6. Map of landslide susceptibility classes in Romania according to current model (a) and Wilde et al. (Citation2018) (b).
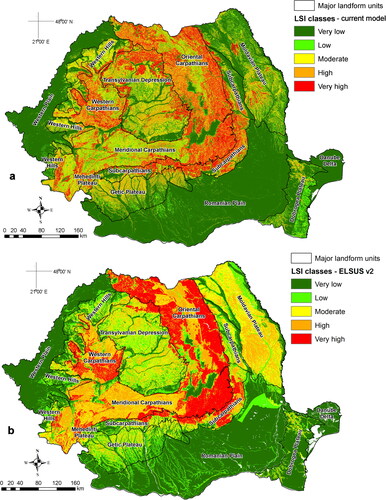
Figure 7. Percentages of landslide susceptibility classes according to current model and Wilde et al. (Citation2018).
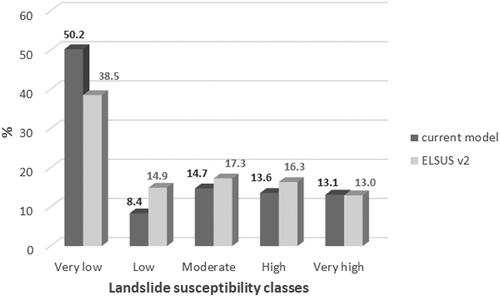
Table 4. Threshold values for landslide susceptibility classes.
At the level of the major landform units of the country, the classified LSI map () shows that most of the mountainous Carpathian unit is characterized by a mixture of moderate, low and high landslide susceptibility classes. Terrains showing high and very high landslide susceptibility are found in the marginal parts of the mountain area (in the flysch and volcanic areas) and in the Subcarpathians. Other mountain areas such as the Meridional Carpathians or the central part of the Oriental Carpathians present lower landslide susceptibility. Outside the mountain region, but inside the mountain-like region according to Nordregio (Citation2004) delineation, there are high and very high landslide susceptibility terrains in the northern and eastern part of the Transylvanian Depression and in the Moldavian Plateau, which present indeed a high density of active landslides. Within the plateau and hilly areas (Z3 zone), areas dominated by moderate landslide susceptibility are found in the Transylvanian and Moldavian Plateaus, and northern part of the Getic Plateau. Other areas belonging to Z3 zone, like the southern parts of the Moldavian and Getic Plateaus, the Western Hills and the Dobrogea Plateau are characterized by moderate and low landslide susceptibility.
The comparison of our landslide susceptibility map with the one referring to the Romanian territory achieved by Wilde et al. (Citation2018) indicates some differences both in the share of susceptibility classes but also in spatial distribution ( and ). Thus, our model assigns more land into the very low susceptibility (50.2% vs 38.5%) and less land into the low susceptibility class (8,4% vs 14.9%), the other susceptibility classes having approximately similar shares (). We notice that in ELSUS model the Meridional Carpathians are dominated by moderate and high susceptibility classes, which is mostly the effect of the land use factor, the higher mountain areas being classified as cropland and therefore given a higher weight (0.313), when in reality these are alpine pastures with a much lower weight (0.027). In the hilly and plateau areas, the most obvious differences are found in the Moldavian Plateau where most of land presents moderate and high susceptibility, according to ELSUS, and moderate and low, according to our model. This is mainly the effect of lithology. In ELSUS, most of the Moldavian Plateau is allocated to the clays class which has a higher weight (0.141), while in our model it mostly belongs to the silts class with a lower weight (0.011). Although there are clays and marlstones in this area they are not as extended as considered in the ELSUS model. Our map shows, however, areas with very high landslide susceptibility within the Moldavian Plateau which don’t appear on the ELSUS map. Their presence is related to the mountain-like morphology which could be revealed by the higher resolution DEM used for climate physiographical zoning in our model. Such areas are also present in the northern and eastern part of the Transylvanian area.
The validation of the model was performed using landslide samples from Z3 and Z6 climate physiographic zones. From the total number of landslides, 25.6% are situated in mountain areas. Two types of validation were applied: the ROC analysis and independent class validation. The ROC analysis was performed to validate the continuous LSI model. The ROC curves and area under the curve (AUC) parameter () reveal that, from this point of view, the model performs much better in the hilly and plain area (AUC = 0.750) than in the mountain area (AUC = 0.600). This situation may be due to the smaller landslide sample available in the Z6 zone and also to the fact that our analysis considers only slides and flows and not rock falls which are frequent in the mountain area. In the Z3 zone, which is the largest climate physiographic zone, representing 63.6% of the country, the ROC analysis indicates a good prediction power of the model. The independent sample validation procedure was used to validate the classified landslide susceptibility map for Z6 and Z3 zones. The results show that the use of LSI class thresholds identified by training sample generate similar class percentages for the test sample, which validates the LSI classes ().
Figure 8. ROC curves for Z3 (a) and Z6 (b) zones of Romania.
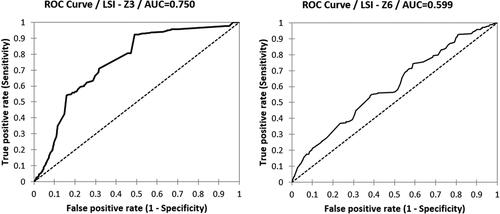
Table 5. LSI class validation.
According to our field knowledge regarding landslide manifestation in Romania, the classified LSI map () shows susceptibility patterns that are in agreement with terrain reality, with the geographical, particularly the geomorphologic, characteristics (Steger et al. Citation2016). The mixture of moderate, low and high landslide susceptibility classes generally characterizes the Carpathians, being mostly the effect of the lithology and slope factors. Terrains showing high and very high landslide susceptibility are found in the marginal parts of the mountain area (in the volcanic and flysch areas of the Oriental Carpathians) and in the Subcarpathians, due to the loose rock materials associated with steep slopes, but also to the massive irrational deforestations occurring on large areas of the Subcarpathians. Lower landslide susceptibility values are found in the Meridional Carpathians or in the central part of the Oriental Carpathians that are developed on hard rocks like granites, gneisses and schists. Earth landslides and flows have a higher occurrence probability in the extra-Carpathian regions, consequence of lithological and structural characteristics. Here, inside the mountain-like region according to Nordregio (Citation2004) delineation, we find high and very high landslide susceptibility terrains in the northern and eastern part of the Transylvanian Depression, favoured mainly by the presence of clays and gravels, and in the northern part of the Moldavian Plateau, developed on alternating layers of clays, marls, sands and sandstones or limestones. These regions present indeed a high density of active landslides. There is a large extent of cuesta slopes or margins of structural plateaus where high value slope angles are found and spatial variation of inclination. Also, these slopes cut off and expose successive layers of different rocks, whether permeable or impermeable, softer or more resistant, thus constituting important conditioning factors for the landsliding process. The southern half of the Moldavian Plateau is dominated by moderate landslide susceptibility due to the monocline stratified lithology with alternating layers of clays, sands and silts. Rock friability leads especially to the development of shallow landslides, which may affect most of the reception basins of torrential valleys. In the Getic Plateau (in fact, a relict piedmont) there is moderate landslide susceptibility, with higher values in the northern part, due to the dominance of gravels and sands which contain dense clay lenses, but also to the steeper slopes and higher relief fragmentation induced by the secondary hydrographic network. In the Western Hills, the situation is somehow similar, the landslides being controlled by lithology, relief fragmentation and deforestations.
The comparison of our results with similar national scale studies, Romanian or carried out for other countries, may provide some aspects of interest. Thus, comparing our results with those of Bălteanu et al. (Citation2020), we can observe that both studies are based on ELSUS methodology, but that there are also differences such as: different choice of spatial units for application (e.g., climate-physiographic zones of Romania - in our study, versus spatial analysis units based on morphostructural characteristics - in Bălteanu et al. Citation2020), different landslide databases (e.g., homogeneous inventory of landslides mapped as polygons from highly accurate georeferenced layers by application of a single mapping technique, covering partially the main climate-physiographic zones – in our study, versus a more heterogeneous landslide inventory, achieved by compilation of several sources, but with a much higher degree of relative completeness for all analyzed spatial units, due to fine scale mapping within several PhD thesis in some areas or to the use of high resolution LIDAR DEM in another area – in Bălteanu et al. Citation2020) and different choice of factor and class weights. As expected, the results have a high degree of similarity: the highest probabilities of future landslide occurrences are characteristic for hilly-mountain and plateau areas made up of loose sedimentary rock layers, with high tectonic mobility, high values of relief fragmentation and intense anthropic impact. The differences between the two studies regard especially the share of susceptibility classes but also the spatial distribution (e.g., the most important differences are found in the Flysch and volcanic areas of the Oriental Carpathians, where our model indicates high and very high landslide susceptibility, while Bălteanu et al. (Citation2020) model indicates moderate, high and very high susceptibility in the Flysch area and low, very low and moderate susceptibility in the volcanic area). In fact, both studies confirm that the approaches focussed on the same objective and applying similar methodologies are useful as they contribute to the strengthening of the complementarity character of research and by the validation/invalidation of the achieved results.
A comparison based on a quantitative evaluation of the classified landslide susceptibility maps obtained on a national scale is difficult, but a visual comparison may prove useful. Concerning the modelling methodology, we notice the use of different methods: landslide susceptibility index (Bălteanu et al. Citation2010; Okalp and Akgün Citation2016); discriminant analysis, logistic regression and bayesian tree random forest (Trigila et al. Citation2013); expert-based SMCE method (Gaprindashvili and van Westen Citation2016, Bălteanu et al. Citation2020); binary logistic regression (Lima et al. Citation2017).
Concerning the landslide contributing factors, we notice that they differ in number and significance as follows: Bălteanu et al. (Citation2010) – six factors (lithology, slope gradient, maximum rainfall in 24 hours, land use, seismicity and local relief); Bălteanu et al. (Citation2020) – three factors (lithology, slope angle and land use/cover); Trigila et al. (Citation2013) – eight factors (lithology, land use, slope gradient, aspect, curvatures, contributing area, topographic wetness index and roughness); Gaprindashvili and van Westen (Citation2016) – eight factors (slope, geology and faults, land cover, Peak Ground Acceleration, roads, maximum daily precipitation, geomorphology and hydrography); Okalp and Akgün (Citation2016) – six factors (slope, lithology, local relief, rainfall, land use and seismicity); Lima et al. (Citation2017) – six factors (aspect, slope, elevation, topographic position index, lithology and land cover). We notice that all presented examples have in common lithology, slope and land cover/land use factors.
Another issue refers to the fact that landslide susceptibility maps at national scale generally provide limited results. Thus, Trigila et al. (Citation2013) argue that quality statistics or ROC analysis are not enough to assess model reliability and propose a thorough evaluation of the geomorphological significance of predictor variables. Gaprindashvili and van Westen (Citation2016) take into account the limitations induced by data availability and accuracy which do not allow the use of physically based models or statistical methods. Okalp and Akgün (Citation2016) argue that these limitations are in relation with the small scale of analysis considering the size and complexity of study area as well as the limited number of contributing factors which are taken into account. Lima et al. (Citation2017) mentions several limitations, such as limited landslide data, bias propagation, overoptimistic performance estimates. Bălteanu et al. (Citation2020) conclude that certain limitations may arise from the incompleteness and heterogeneity of the landslide database, the limited classification of the landslide data and the reduced number of controlling factors considered.
Regarding our study, we may assume that the results achieved do not constitute a perfect representation of the landslide susceptibility for a country with high geographic complexity such as Romania. The limitations of our approach are mainly related to data quality regarding the landslide inventory (the lack of a complete inventory), as well as the high simplicity of the model, which cannot account for the high spatial variability of local conditions favouring the landsliding processes. The model assumes that landslide occurrence is determined by identical combinations of the three contributing factors, whereas in reality it is known that landslides can be greatly influenced by local conditions in combination with several other factors.
The slope factor is indeed considered in many studies as among the top three most important factors for landslide study at regional scale. In our case, slope may prove less effective in mountainous areas, where the morphometrical and lithological features are less favourable to the accumulation of thick slope deposits susceptible to sliding or flowing, but this factor is important in the extra-Carpathian regions, where it is enhanced by lithology (alternating sequences of permeable and impermeable rocks) and geological structure. Moreover, in plain and floodplain areas the slope is insignificant, making landslides’ occurrence very unlikely in the future. For this reason, these areas should be disregarded from the model, which could increase the explanatory power of modelling results (Lima et al. Citation2017).
The lithological factor is also considered as dominant through its influence on landslides’ spatial distribution. However, because in our study we are facing an incompleteness of landslide inventory (and thus with inventory-based bias), some errors will propagate among the final modelling results each time a certain predictor is being processed. In this way, certain higher or smaller susceptibility values observed in some lithological unit do not necessarily reflect a plausible relationship and may be the product of an over-representation or under-representation of observations regarding landslides (Steger et al. Citation2016; Lima et al. Citation2017).
Land cover is the third most important factor in our model contributing to landslide manifestation. In many areas, it is distinguished by high weight values, such as the areas where massive deforestations occurred during the past two centuries, covered at present by pastures and where landslides have a large extension. However, its use may be inappropriate in situations where the current land cover is no longer the same as when the landslides occurred (Mărgărint et al. Citation2013; Petschko et al. Citation2014; Lima et al. Citation2017).
Despite the limitations, the results of our study constitute a useful approximation of the spatial occurrence probability of landslides at national scale. These results are highly dependent on the input parameters, on the combined effect of resolution, accuracy and source of the landslide factors. A potential methodological improvement could be the differentiated application of the model according to landslide types (as proposed by Malet et al. Citation2013; Micu et al. Citation2014; Bălteanu et al. Citation2020), using landslide inventories as complete as possible for each spatial unit, and the combining of results at the country scale. We believe that the model application according to the climate-physiographic zones, as proposed by ELSUS methodology, is more suitable than according to the major landform units. This approach is more intuitive and provides a more homogenous aggregation of the morpho-climatic characteristics of terrains susceptible to landsliding and of their conditioning factors, and should minimize the border effect which, otherwise, still remains visible.
5. Conclusions
There are few studies focussed on landslide susceptibility mapping at national scale which, despite their main inconveniences induced by the high generalization degree and coarse resolution, may prove useful both theoretically and practically.
The application of the ELSUS model at national (Romanian) scale, using more accurate and higher spatial resolution input data, leads to satisfactory results. The improvement of input data in the case of our model comes mainly from the higher accuracy in climate-physiographic terrain differentiation. Also, the lithology predictor, extracted from geological and soil maps, groups the main categories of rocks by genetic criteria and by their sensitivity to mass displacement processes, thus increasing its prediction capability.
The minimum set of selected predictors (slope angle, lithology and land cover) can be enough for landslide susceptibility evaluation with a satisfactory accuracy even at this scale. Compared with other national (Romanian) scale studies, namely the one of Bălteanu et al. (Citation2020), but also with the situation displayed by the Pan-European landslide susceptibility map referring to the Romanian territory (Wilde et al. Citation2018), the results are similar regarding the areas with high probabilities of future landslide manifestations, but reveal also differences, concerning especially the spatial distribution of landslide susceptibility as well as different shares of landslide susceptibility classes, which are the effect of the different landslide databases and choices of spatial units for application and the considered class and factor weights.
The landslide susceptibility maps at national scale are important in revealing the areas where attention must be paid for carrying out detailed landslide inventories, hazard and risk assessments, and may be useful for formulating the general framework of different policies or strategies at regional and national level. The results displayed by the map we achieved, despite the insufficient or even the lack of landslide data for certain regions, allow ranking the priorities, focussing on key areas and, therefore enhancing the risk assessment and land use and management.
The lack of or insufficiency of landslide data must be taken into account for future improvements. Some climate-physiographic zones in Romania require correct and, if possible, complete information regarding the landslide inventory and, not without significance, the landslide typology. This could increase the explanatory power of the modelling results. A potential improvement of the methodology could be the different model application according to the landslide types, using landslide inventory as complete as possible for climate-physiographic zones and the combining of results at the country scale.
Disclosure statement
No potential conflict of interest was reported by the author(s).
Data availability statement
The data that support the findings of this study are available from the corresponding author (Patriche C.V.), upon reasonable request.
Correction Statement
This article has been republished with minor changes. These changes do not impact the academic content of the article.
References
- Armaş I. 2011a. Weights of evidence method for landslide susceptibility mapping. Prahova Subcarpathians. Nat Hazards. 60(3):937–950.
- Armaş I. 2011b. An analytic multicriteria hierarchical approach to assess landslide vulnerability. Case study: Cornu village, Subcarpathian Prahova Valley/Romania. Zeit Fur Geo. 55(2):209–229.
- Ayalew L, Yamagishi H, Marui H, Kanno T. 2005. Landslidesin Sado Island of Japan: Part II. GIS-based susceptibility mapping with comparisons of results from two methods and verifications. Eng Geol. 81(4):432–445.
- Bai SB, Zhou PG, Wang J, Hou SS, Lu GN, Zhang FY. 2008. GIS-based susceptibility mapping with comparisons of results from analytical hierarchy process versus logistic regression in the Three Gorges Area, China. In: Chen Z, Zhang J, Li Z, Wu F, Ho K, editors. Landslides and Engineered Slopes. From the Past to the Future. Vol. 2. CRC Press/Balkema, Leiden; p. 1067–1070.
- Bălteanu D, Chendeş V, Sima M, Enciu P. 2010. A country-wide spatial assessment of landslide susceptibility in Romania. Geomorphology. 124(3-4):102–112.
- Bălteanu D, Micu M, Jurchescu M, Malet JP, Sima M, Kucsicsa G, Dumitrică C, Petrea D, Mărgărint MC, Bilaşco S, et al. 2020. National-scale landslide susceptibility map of Romania in a European Methodological Framework. Geomorphology. 371:107432..
- Bălteanu D, Micu M, Malet JP, Jurchescu M, Sima M, Kucsicsa G, Dumitrica C, Petrea D, Mărgărint MC, Bilașco S, et al. 2017. Progress in national-scale landslide susceptibility mapping in Romania using a combined statistical-heuristical approach. Geophys Res Abstracts. 19:EGU2017–18269.
- Broeckx J, Vanmaercke M, Duchateau R, Poesen J. 2017. A landslide susceptibility map of Africa. Geophysical Res. Abstracts. 9:EGU2017–27.
- Carrara A, Cardinali M, Detti R, Guzzetti F, Pasqui V, Reichenbach P. 1991. GIS techniques and statistical models in evaluating landslide hazard. Earth Surf Process Landforms. 16 (5):427–445. https://doi.org/http://dx.doi.org/10.1002/esp.3290160505.
- Castellanos Abella EA, van Westen CJ. 2008. Qualitative landslide susceptibility assessment by multicriteria analysis: A case study from San Antonio del Sur, Guantánamo, Cuba. Geomorphology. 94(3-4):453–466.
- Chiţu Z, Istrate A, Adler MJ, Şandric I, Olariu B, Mihai B. 2014. Comparative study of the methods for assessing landslide susceptibility in Ialomiţa Subcarpathians, Romania. In: Lollino G Editor. Engineering geology for society and territory, IAEG XII congress volumes. Springer.
- Chiţu Z, Șandric I, Mihai B, Săvulescu I. 2009. Evaluate Landslide Susceptibility using Statistical Multivariate Methods: A case-study in the Prahova Subcarpathians, Romania. In: Malet JP, Remaitre A, Borgaard T. editors. Landslide Processes: From Geological Mapping to Dynamic Modelling, CERG Editions, Strasbourg; p. 265–270.
- Conoscenti C, Rotigliano E, Cama M, Caraballo-Arias NA, Lombardo L, Agnesi V. 2016. Exploring the effect of absence selection on landslide susceptibility models: a case study in Sicily, Italy. Geomorphology. 261:222–235.
- Constantin M, Bednarik M, Jurchescu MC, Vlaicu M. 2011. Landslide susceptibility assessment using bivariate statistical analysis and the index of entropy in the Sibiciu Basin (Romania). Environ Earth Sci. 63(2):397–406.
- Cruden DM, Varnes DJ. 1996. Landslide types and processes. In: Turner AK, Schuster RL, editors. Landslides, Investigation and Mitigation, Special Report 247. Washington D.C.: Transportation Research Board; p. 36–75.
- Ercanoglu M. 2008. An Overview on the Landslide Susceptibility Assessment Techniques, In: De S. Editor. Environment and Geoscience. Proceedings of the 1st WSEAS International Conference on Environmental and Geological Science and Engineering (EG’08), Malta; p. 131–134.
- European Environment Agency. 2016a. European Digital Elevation Model (EU-DEM), version 1.1. Available online at: http://land.copernicus.eu/pan-european/satellite-derived-products/eu-dem/eu-dem-v1.1/view.
- European Environment Agency. 2016b. Corine Land Cover (CLC) 2012. Available online at: http://land.copernicus.eu/pan-european/corine-land-cover/clc-2012/view.
- Fell R, Corominas J, Bonnard C, Cascini L, Leroi E, Savage WZ. 2008. Guidelines for landslide susceptibility, hazard and risk zoning for land use planning. Eng Geol. 102(3-4):85–98.
- Florea N, Bălăceanu V, Munteanu I, Asvadurov H, Conea A, O, Cernescu N, Popovăț M. 1963-1993. Harta Solurilor României, scara 1:200,000 (Soil Map of Romania, scale 1:200,000). Geological Institute/IGFCOT, Bucharest, 50 sheets.
- Furlani S, Ninfo A. 2015. Is the present the key to the future? Earth Sci. Rev. 142 (C):38–46. https://doi.org/http://dx.doi.org/10.1016/j.earscirev.2014.12.005.
- Gaprindashvili G, van Westen CJ. 2016. Generation of a national landslide hazard and risk map for the country of Georgia. Nat Hazards. 80(1):69–101.
- Grozavu A, Pleșcan S, Patriche CV, Mărgărint MC, Roșca B, et al. 2013. Landslide susceptibility assessment: GIS application to a complex mountainous environment. In: Kozak J, editor, The Carpathians: Integrating Nature and Society Towards Sustainability, Environmental Science and Engineering. Berlin: Springer-Verlag; p. 31–44.
- Grozavu A, Patriche CV, Mihai FC. 2017. Application of AHP method for mapping slope geomorphic phenomena. In Proceedings of the 17th International Multidisciplinary Scientific GeoConference (SGEM), 17(23), 377–384.
- Günther A, Reichenbach P, Malet J-P, Van Den Eeckhaut M, Hervás J, Dashwood C, Guzzetti F. 2013. Tier-based approaches for landslide susceptibility assessment in Europe. Landslides. 10(5):529–546.
- Günther A, Van Den Eeckhaut M, Malet JP, Reichenbach P, Hervás J. 2014. Climate-physiographically differentiated Pan-European landslide susceptibility assessment using spatial multi-criteria evaluation and transnational landslide information. Geomorphology. 224:69–85.
- Guzzetti F, Carrara A, Cardinali M, Reichenbach P. 1999. Landslide hazard evaluation: A review on current techniques and their application in a multi-scale study. Central Italy, Geomorphology. 31(1-4):181–216.
- Hasekioğulları GD, Ercanoglu M. 2012. A new approach to use AHP in landslide susceptibility mapping: a case study at Yenice (Karabuk, NW Turkey). Nat Hazards. 63(2):1157–1179.
- Hong Y, Adler R, Huffman G. 2007. Use of satellite remote sensing data in the mapping of global landslide susceptibility. Nat Hazards. 43(2):245–256.
- Hutchinson JN. 1995. Landslide Hazard Assessment. Keynote Paper, In: Bell DH, Editor. Landslides, Proceeding of 6th International Symposium on Landslides, Christchurch, Vol. 1, Balkema, Rotterdam; p. 1805–1841.
- Jaedicke C, Van Den Eeckhaut M, Nadim F, Hervás J, Kalsnes B, Vangelsten BV, Smebye H. 2014. Identification of landslide hazard and risk ‘hotspots’ in Europe. Bull Eng Geol Environ. 73:325–339.
- Jurchescu M, Micu D, Sima M, Bălteanu D, Dragotă C, Micu M, Bojariu R, Dumitrescu A, Senzaconi F. 2017. An approach to investigate the effects of climate change on landslide hazard at national scale (Romania). In: Niculiță M, Mărgărint MC, editors. Proceedings of the Romanian Geomorphology Symposium, 33rd edition, Iași: Alexandru Ioan Cuza” University Press; p. 121–124.
- Komac M. 2006. A landslide susceptibility model using the Analytical Hierarchy Process method and multivariate statistics in perialpine Slovenia. Geomorphology. 74(1-4):17–28.
- Lima P, Steger S, Glade T, Tilch N, Schwarz L, Kociu A. 2017. Landslide Susceptibility Mapping at National Scale: A First Attempt for Austria. In: Mikoš M, editors. Advancing Culture of Living with Landslides. Springer International Publishing, Cham, https://doi.org/10.1007/978-3-319-53498-5.
- Malet JP, Puissant A, Mathieu A, Van Den Eeckhaut M, Fressard M, et al. 2013. Integrating spatial multi-criteria evaluation and expert knowledge for country-scale landslide susceptibility analysis, application to France. In: Margottini C, editors. Landslides science and practice, Vol. 1, Berlin: Springer; p. 303–311.
- Mărgărint MC, Grozavu A, Patriche CV. 2013. Assessing the spatial variability of coefficients of landslide predictors in different regions of Romania using logistic regression. Nat Hazards Earth Syst Sci. 13(12):3339–3355.
- Mărgărint MC, Niculiţă M. 2017. Landslide Type and Pattern in Moldavian Plateau, NE Romania. In: Rădoane M, Vespremeanu-Stroe A, editors. Landform Dynamics and Evolution in Romania. Switzerland: Springer International Publishing, p. 271–304.
- Micu M. 2017a. The systematic of landslide processes in the conditions of Romania’s relief. In: Rădoane M, Vespremeanu-Stroe A, editors. Landform Dynamics and Evolution in Romania. Switzerland: Springer International Publishing; p. 249–269.
- Micu M. 2017b. Landslide Types and Spatial Pattern in the Subcarpathian Area. In: Rădoane M, Vespremeanu-Stroe A, editors. Landform Dynamics and Evolution in Romania. Switzerland: Springer International Publishing; p. 305–325.
- Micu M, Malet JP, Bălteanu D, Mărgărint C, Niculiţă M, Jurchescu M, Chiţu Z, Şandric I, Simota C, Mathieu A. 2014. Typologically-differentiated landslide susceptibility assessment for Romania. Geophysical Research Abstracts 16, EGU2014-13315, General Assembly
- Nadim F, Kjekstad O, Peduzzi P, Herold C, Jaedicke C. 2006. Global landslide and avalanche hotspots. Landslides. 3(2):159–173.
- National Meteorological Administration (NMA). 2008. Climate of Romania, Romanian Academy Publishing House, Bucharest (in Romanian).
- Necula N, Niculiță M. 2017. Landslide reactivation susceptibility modeling in Iași Municipality. Revista de Geomorfologie. 19:101–117. https://doi.org/http://doi.org/10.21094/rg.2017.021.
- Niculiţă M, Stoilov-Linu V, Necula N. 2018. Recent landslides from Iași Metropolitan Area. RG. 20(1):90–101..
- Nordregio. 2004. Mountain areas in Europe, Analysis of mountain areas in EU member states, acceding and other European countries (Report 2004.1). Nordic Centre for Spatial Development, Stockholm, Sweden.
- Ohlmacher GC, Davis JC. 2003. Using multiple logistic regression and GIS technology to predict landslide hazard in northeast Kansas, USA. Eng Geol. 69(3-4):331–343.
- Okalp K, Akgün H. 2016. National level landslide susceptibility assessment of Turkey utilizing public domain dataset. EnvironEarth Sci. 75:847.
- Patriche CV, Pirnau R, Grozavu A, Rosca B. 2016. A comparative analysis of binary logistic regression and analytical hierarchy process for landslide susceptibility assessment in the Dobrovaț River Basin, Romania. Pedosphere. 26(3):335–350.
- Peel MC, Finlayson BL, McMahon TA. 2007. Updated world map of the Köppen-Geiger climate classification. Hydrol Earth Syst Sci. 11(5):1633–1644.
- Petschko H, Brenning A, Bell R, Goetz J, Glade T. 2014. Assessing the quality of landslide susceptibility maps - case study lower Austria. Nat Hazards Earth Syst Sci. 14(1):95–118.
- Posea G, Popescu N, Ielenicz M. 1974. Relieful Romaniei (The relief of Romania), Ed Stiintifica, Bucuresti.
- Posea G, Badea L. 1984. Romania. Relief units. Geomorphological zoning. Scientific and Encyclopedic Publishing, Available online at: http://www.geo-spatial.org/download/harta-unitati-relief-romania.
- Posner AJ, Georgakakos KP. 2015. Normalized Landslide Index Method for susceptibility map development in El Salvador. Nat Hazards. 79 (3):1825–1845. https://doi.org/http://dx.doi.org/10.1007/s11069-015-1930-4.
- Reichenbach P, Rossi M, Malamud BD, Mihir M, Guzzetti F. 2018. A review of statistically-based landslide susceptibility models. Earth Sci Rev. 180:60–91..
- Romanian Geological Institute. 1960-1969. Geology map of Romania at 1:200,000 scale, 50 sheets.
- Saaty TL. 1980. The analytical hierarchy process. New York: McGraw Hill.
- Sabatakakis N, Koukis G, Vassiliades E, Lainas S. 2013. Landslide susceptibility zonation in Greece. Nat Hazards. 65(1):523–543.
- Sakkas G, Misailidis N, Sakellariou N, Kouskouna G, Kaviris G. 2016. Modeling landslide susceptibility in Greece: A weighted linear combination approach using analytic hierarchical process, validated with spatial and statistical analysis. Nat Hazards. 84(3):1873–1904.
- Steger S, Brenning A, Bell R, Petschko H, Glade T. 2016. Exploring discrepancies between quantitative validation results and the geomorphic plausibility of statistical landslide susceptibility maps. Geomorphology. 262:8–23..
- Trigila A, Frattini P, Casagli N, Catani F, Crosta G, Esposito C, Iadanza C, Lagomarsino D, Mugnozza GS, Segoni S, et al. 2013., Landslide susceptibility mapping at national scale: the Italian case study. In: Margottini C, Canuti P, Sassa K, editors. Landslide science and practice. Berlin: Springer; p. 287–295.
- Van Den Eeckhaut M, Hervás J, Jaedicke C, Malet JP, Montanarella L, Nadim F. 2012. Statistical modelling of Europe-wide landslide susceptibility using limited landslide inventory data. Landslides. 9(3):357–369.
- Wilde M, Günther A, Reichenbach P, Malet JP, Hervás J. 2018. Pan-European landslide susceptibility mapping: ELSUS Version 2. J Maps. 14(2):97–104.
- Yalcin A. 2008. GIS-based landslide susceptibility mapping using analytical hierarchy process and bivariate statistics in Ardesen (Turkey): Comparisons of results and confirmations. Catena. 72(1):1–12.
- Zumpano V, Hussin H, Reichenbach P, Bălteanu D, Micu M, Sterlacchini S. 2014. A landslide susceptibility analysis for Buzau County. Romania. Revue Roumaine de Geographie/Romanian J. Geography. 58(1):9–16.