
 ?Mathematical formulae have been encoded as MathML and are displayed in this HTML version using MathJax in order to improve their display. Uncheck the box to turn MathJax off. This feature requires Javascript. Click on a formula to zoom.
Abstract
Tropical cyclones (TCs) are prominent natural hazards in the Guangdong Province, China; hence, comprehensive risk assessment is vital to reduce potential losses due to TC hazards. A multi-indicator system was developed by incorporating 19 criteria under 3 risk components and a combination of the analytic hierarchy process and index of entropy was adopted to generate a TC risk map. Spatial statistics were applied to determine the spatial association and significant TC risk hotspots. The TC risk map showed that ∼40% of the study area is classified as a high or extremely high TC risk. Areas with the highest risk are mainly concentrated in the eastern region (ER), western region (WR), and Zhuhai and Shenzhen in the Pearl River Delta (PRD), whereas other areas in the PRD and mountainous region (MR) in the inland are classified as zones with the lowest risk. The results of the spatial autocorrelation analysis showed a significant positive spatial clustering in the spatial pattern of the TC risk, suggesting a varying spatial distribution and clustering pattern of the TC risk level that can be used as preliminary planning framework for tropical cyclone risk management. The results of this study provide theoretical reference for the design of disaster mitigation measures.
1. Introduction
Tropical cyclones (TCs) are strong cyclonic disturbances within synoptic systems that occur in tropical or subtropical oceans in association with strong winds, torrential rain, and storm surges, making them one of the most lethal and destructive natural disasters worldwide (Hoque et al. Citation2016; Hoque et al. Citation2018; Mansour Citation2019). The coastal region of China is one of the major cyclone-prone areas with a highly concentrated population and economy (Yin et al. Citation2013; Xu et al. Citation2015; Zhang et al. Citation2017; Zhong et al. Citation2018). Based on historical records from the Japan Meteorological Agency (JMA) from to 1951–2018, ∼1782 TCs were generated in the western North Pacific (WNP) Basin, 30% of which have made landfall in the southeast coastal region of China over the past 70 years, resulting in huge economic losses, casualties, house collapses, and crop damage (Chou et al. Citation2020; Wang et al. Citation2016; Cai et al. Citation2020). The results of numerous studies showed that the frequency of very intense TCs will likely increase in the future due to climate change (Chan and Liu Citation2004; Webster et al. Citation2005; Emanuel et al. Citation2008; Bacmeister et al. Citation2018; Sun et al. Citation2017). Hence, effective risk assessment of TCs is required to mitigate the effects of TCs on the local population, economy, and environment in coastal areas.
The disaster risk is complex and varies in different regions because it is driven by natural and anthropogenic disturbances. Hence, accurate information is crucial for the selection of reliable indicators for TC risk assessment (Azaz Citation2010; Hoque et al. Citation2017b). From the perspective of disaster system theory, the risk is generally associated with the interaction between the potential of hazard-induced factors and the vulnerability of the environment, people, and infrastructure exposed to the risk (Rashid Citation2013; Dewan Citation2013; Hoque et al. Citation2017b; Zhang et al. Citation2017). In reality, the regional disaster reduction capacity is an essential indicator for risk assessment, which may offset the hazard and vulnerability of TCs or overlapping relationships between them (Zhang et al. Citation2017; Hoque et al. Citation2017b; Hoque et al. Citation2018; Mansour Citation2019; Sajjad and Chan Citation2019; Nguyen et al. Citation2019; Sajjad et al. Citation2020). Previous research (Gao et al. Citation2014; Xu et al. Citation2015; Zhang et al. Citation2017; Alam et al. Citation2020; Cai et al. Citation2020) on TC risk assessment primarily focused on the characteristics of TCs occurring in an area and the disaster-bearing body. However, the mitigation capacity has been integrated in few TC risk assessment studies (Hoque et al. Citation2017a; Sajjad and Chan Citation2019).
Currently, methods based on index systems are the most widely used in TC risk assessment (Alam et al. Citation2020; Hoque et al. Citation2017b; Hoque et al. Citation2018; Mansour. 2019; Sajjad and Chan Citation2019; Sajjad et al. Citation2020) . Multi-criteria evaluation as a basis for the decision-making process is associated with the identification, quantification, and weighting of criteria, which is vital for tropical cyclone risk management (Mansour Citation2019). In numerous studies, either subjective (e.g., analytic hierarchy process, AHP) and objective methods (e.g., index of entropy, IoE; principal component analysis, PCA) or a combination of both have been used to allocate the relevant weights to each risk modeling index (Sun et al. Citation2014; Mazumdar and Paul Citation2018; Kabenge et al. Citation2017; Cai et al. Citation2020; Wang et al. Citation2020). Among these methods, AHP and IoE are two commonly used subjective and objective methods (Wang et al. Citation2020; Du et al. Citation2020). The AHP is an effective tool that can be used in the spatial multi-criteria decision-making process and is highly recommended for TC risk assessment (Yin et al. Citation2013; Zhang et al. Citation2017; Alam et al. Citation2020). However, it is substantially affected by the subjective imprecision of decision makers (Chen et al. Citation2015, Roy and Blaschke Citation2015; Hoque et al. Citation2019; Mansour Citation2019). In contrast, the IoE method can be used to determine the index weight based on the objective variation of each indicator but lacks subjective opinions based on prior knowledge (Liu and Chen Citation2019).
The spatial statistics method using Moran’s I and G statistics is an effective tool to analyze the spatial association and significance level of geospatial phenomena (Mazumdar and Paul Citation2018; Majumder et al. Citation2019; Hu et al. Citation2019; Jha and Gundimeda Citation2019). The occurrence of TCs is uncertain with risks depending on the interactions among physical, socio-economic, and environmental factors. In other words, the TC risk can be regarded as a regional variable with significant spatio-temporal differences. Hence, spatial statistics based on TC risk assessment can be used to reveal spatial agglomeration characteristics to understand the spatial dimensions of the TC risk. To the best of our knowledge, spatial statistics have been applied in few studies to assess the spatial cluster pattern of the TC risk. In two previous reports (Sajjad et al. Citation2020; Mazumdar and Paul Citation2018), a spatial statistics approach was applied to evaluate the spatial heterogeneities of the typhoon risk in mainland China and to identify hotspots in Odisha, India, that are vulnerable to TCs.
Guangdong is an important region along the southeastern coast of China, which is frequently affected by tropical cyclones. Recent research results showed that TCs landfall in the Guangdong Province first and exit the area the latest and the economic loss in this region caused by severe TCs from 1994 to 2016 exceeded 200 billion yuan (Liu et al. Citation2018; Wang et al. Citation2020; Xu and Deng Citation2020). In addition, the frequency of TCs made landfall in Guangdong is the highest and the Pearl River Delta (PRD) has been identified as the hotspot with the highest risk of TCs in coastal mainland China (Liu and Chen Citation2019; Sajjad et al. Citation2020). Among recent catastrophic TCs that made landfall in the Guangdong Province, such as Hagupit (2008), Usagi (2013), Rammasun (2014), Mujigae (2015), Hato (2017) and Mangkhut (2018) are responsible for considerable direct economic losses and human causalities (Yu et al. Citation2013; Su et al. Citation2016; Liu et al. Citation2018; Yang et al. Citation2019; Fu et al. Citation2020).
To develop a systematic risk assessment procedure and identify high-risk regions affected by TCs in Guangdong, POI data were used in this study to map the mitigation capacity and an integrated AHP-IoE method was applied to conduct TC risk assessment. Based on the use of remote sensing, meteorological, socio-economic, and various observation data, a multi-indicator system incorporating the mitigation capacity was established, which can be used to evaluate the TC risk level in the Guangdong Province. Furthermore, Moran’s I index and Gi statistics were employed to identify the spatial pattern of the TC risk in Guangdong. In this study, the spatial distribution of the TC risk level, spatial pattern of the TC risk, and mitigation measures are analyzed.
2. Study area and datasets
2.1. Study area
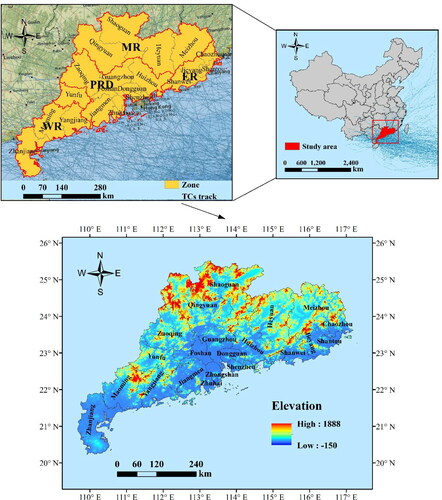
The Guangdong Province is located in the southernmost part of mainland China between 20.22°–25.52°N and 109.65°–117.32°E. The total terrain includes an area of 179800 km2 and is mainly covered by arable land, forests, and coastal wetlands (Liu and Chen Citation2019). Guangdong is the most economically developed and populous region in southern China, with a total gross domestic product (GDP) of RMB 9.7 trillion and a permanent resident population of 113.46 million by the end of 2018 (Wang et al. Citation2021). Guangdong is characterized by tropical and subtropical monsoon climate. The occurrence of TCs is extremely common from May–August. In addition, Guangdong is located at the northern verge of the South China Sea with a long coastline, which makes it the main area prone to TCs. To better assess the TC risk in different areas, the study area was divided into four zones based on their location and economic development (): Pearl River Delta (PRD), Eastern Region (ER), Western Region (WR), and Mountainous Region (MR).
Figure 1. Location of the study area.
2.2. Data acquisition
Multi-source datasets (TC, remote sensing, meteorological, vector, and socio-economic data) from various domestic and international data platforms and institutions were used in this study. The TC data include past TC information such as the location, minimum central pressure, duration, moving distance, and intensity of each TC every 6 h. Remote sensing data include digital elevation model (DEM), normalized difference vegetation index (NDVI), land use and land cover. Meteorological data include the wind speed and total precipitation. Vector data include road networks, railway networks, water networks, coastlines and point of interest (POI) data such as the medical, public, and educational infrastructure and charitable organizations in the cities of Guangdong. Socio-economic data include the population density, GDP, and historical disaster loss. Disaster loss data include casualties, direct economic losses, wrecked vessels, and the aquaculture loss area from 2014 to 2018. Detailed information on all data sources is provided in .
Table 1. Data sources and information.
3. Material and methods
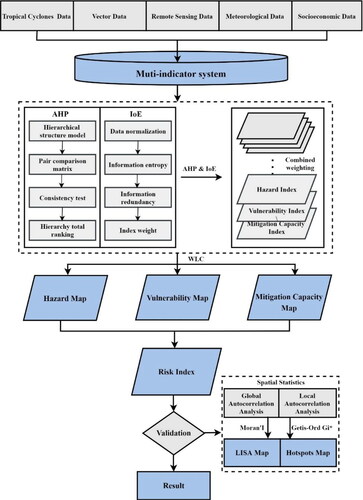
The risk assessment process used in this study consisted of four phases. First, a multi-indicator system was established based on the hazard, vulnerability, and mitigation capacity of the risk components. Second, we applied the combined AHP-IoE weighting method to assess the TC risk. Third, we validate the resulting TC risk map by comparing the historical disaster loss statistics. Finally, Moran’s I and G statistics were used to analyze the spatial cluster pattern of the TC risk and identify high-risk hotspots in the Guangdong Province. The flowchart of the TC risk assessment of this study is shown in .
Figure 2. Flowchart of the overall geospatial risk model of TCs in the Guangdong Province.
3.1. Index system establishment
Because there is no consensus on the selection criterion for the conditioning factor used for TC risk assessment, 19 relative evaluation indicators under three risk component categories (hazard, vulnerability, and mitigation capacity) were examined based on a literature review (Hoque et al. Citation2019; Nguyen et al. Citation2019; Sajjad et al. Citation2020; Zhang et al. Citation 2021). These risk criteria layers were obtained via data processing using projection, interpolation, clipping, distance analysis, and overlay analysis in ArcGIS. All factor layers were uniformly transformed into the Krassovsky ellipsoid and Albers projection at a 1 km grid scale, while indicators under each risk category were classified using the natural break statistical method, as listed in .
Table 2. Ranking scheme based on the contribution of each risk category to TCs.
3.1.1. Hazard
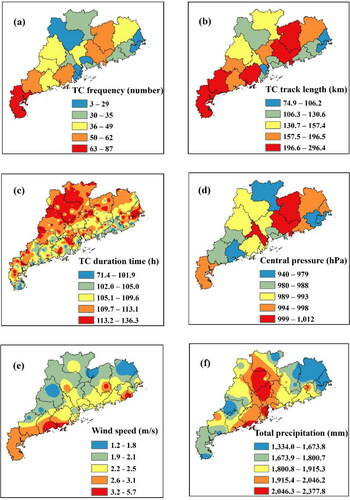
A hazard is an event and phenomenon (like TC) that may affect the life, property, socio-economic activities, or environment (UNISDR Citation2009; Banholzer et al. Citation2014). The probability of TC occurrence is determined by the characteristics of TCs and meteorological factors. Hence, six indices of TC-induced factors were identified to capture the TC hazard pattern (): frequency, TC track length, duration, central pressure, wind speed, and total precipitation. The frequency, track length, and duration of TCs are important indicators for the detection of potential hazards of TCs within the spatio-temporal range. The higher frequency of TC, the higher the degree of hazard to the region. The longer length and duration time, the greater the adverse impact of TCs on local areas. We determined the layer of frequency, TC track length, and duration by calculating the number of TC, the total length of TC track, and the duration of the continuous life history of each TC that crossed the Guangdong province between 1951 and 2018. Central pressure, wind speed, and rainfall correspond to the intensity of TCs. The layer of TC minimum central pressure can be established via interpolation based on the value of the minimum central pressure of TC every six hour. Due to limited availability of wind speed and precipitation data for each TCs, the yearly average wind speed data and total 24-hour rainfall data between 2010 and 2018 from the China Meteorological Administration were used to determine the spatial layers of wind speed and total precipitation.
Figure 3. Spatial distribution of the hazard components for the TC risk: (a) TC frequency, (b) TC track length, (c) TC duration time, (d) Central pressure, (e) Wind speed, and (f) Total precipitation.
3.1.2. Vulnerability
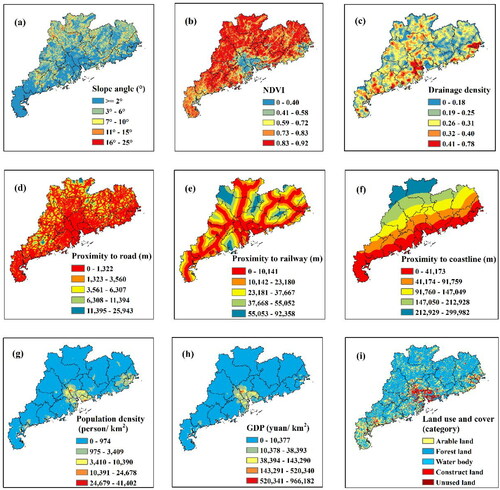
Vulnerability is the susceptibility of an element to environmental change or the extent to which a community and environment may be affected by a particular hazard (Rashid Citation2013; UNISDR Citation2009). In total, nine socio-economic and environmental factors, including the slope angle, NDVI, drainage density, proximity to highways, proximity to railways, proximity to the coastline, population density, GDP, land use and land cover were used to visualize the vulnerability across the Guangdong Province (). The slope angle, NDVI, and river density are important measures of physical vulnerability: A lower slope angle, lower vegetation coverage, and high river density suggest a high vulnerability to TC hazards. Population density, GDP, and land use and cover correspond to socio-economic vulnerability. The layer of slope is calculated from the Digital Elevation Model (DEM) using slope analysis. The layers of population density, GDP, and NDVI were extracted from spatial grid datasets of the Chinese population, GDP, and vegetation index based on a 1 km spatial resolution. Land use and cover were extracted from multi-period land use and land cover remote sensing datasets in China (CNLUCC). Furthermore, proximity to roads, railways, and coastline are important indicators of the susceptibility of exposed elements: The closer to the roads, railways, and coastline, the higher the impact. To produce the layers of proximity to coastline, road, railways, and drainage density, proximity analysis was performed using ArcGIS software.
Figure 4. Spatial distribution of the vulnerability components for the TC risk: (a) Slope angle, (b) NDVI, (c) Drainage density, (d) Proximity to roads, (e) Proximity to railways, (f) Proximity to the coastline, (g) Population density, (h) GDP, and (i) Land use and cover.
3.1.3. Mitigation capacity
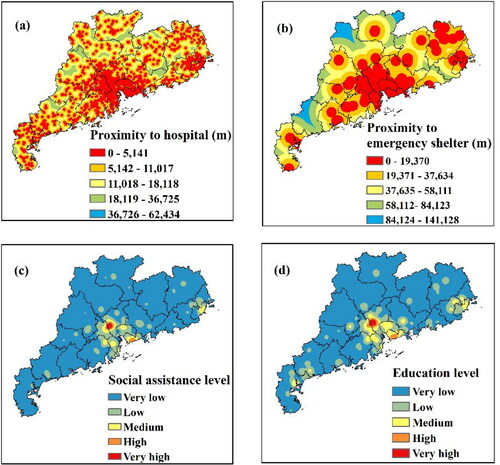
The mitigation capacity represents the ability to cope with extreme hazard events and implement planned mitigation measures to minimize disaster losses (Nguyen et al. Citation2019; Liu et al. Citation2020). As a new spatial data source, POI data are of advantage because of the large sample sizes, detailed information, wide coverage, high recognition accuracy, and easy access, which improve the accuracy of the detection of urban microscale hotspots (Hu et al. Citation2016; Yao et al. Citation2017). In this study, four indicators, that is, the proximity to hospitals, proximity to emergency shelters, social assistance level, and education level, were selected to depict the mitigation capacity of TCs (). Healthcare facilities, such as public hospitals, clinics, and health centers, provide medical services in disaster areas. Emergency shelters are also effective mitigation measures, which provide important emergency and life-saving shelters during TCs. The level of social assistance corresponds to the distribution of charities, which provide relief and subsidies for TC disaster sufferers. The education level is quantified by the distribution density of higher education institutions and represents the local awareness of coping with natural disasters, which is a useful indicator of the disaster reduction. The layers of proximity to hospital, emergency shelter, and social assistance and education levels are created by kernel density analysis using POI data of healthcare facilities, emergency shelters, charities, and high education institutions.
Figure 5. Spatial distribution of the mitigation capacity components for the TC risk: (a) Proximity to hospitals, (b) Proximity to emergency shelters, (c) Social assistance level, and (d) Education level.
3.2. Combination weighting method
In light of the problems of single weighting methods and to obtain more reasonable weighting results, combination weighting methods are applied to determine the weight of each TC hazard factor. Because of its simplicity and frequent use in Geographic Information System (GIS), weighted linear combination (WLC) was used in this study by aggregating all weighted layers.
Based on the principle of the minimum relative information entropy the combination weight equation is as follows (Sun et al. Citation2014):
(1)
(1)
where
is the combined weight of the jth criterion and
and
represent the AHP weighting and IoE weighting of the jth index, respectively. The WLC is conducted by multiplying the indicators by the relative combined weights of the TC risk (Ogato et al. Citation2020):
(2)
(2)
where
is the combined weight for the ith indicator and
represents the value of the ith indicator. The weight of each influencing factor was calculated based on the combination weight method, as shown in .
Table 3. Combination weight of each indicator within the risk dimension.
3.3. Risk assessment model
Based on existing literature (Hoque et al. Citation2018; Hoque et al. Citation2019; Mansour Citation2019; Alam et al. Citation2020) and natural disaster risk theory, a well-accepted risk assessment model for TCs was adopted in this study. The composite risk assessment model considers the hazard-induced components; vulnerability of the hazard-bearing body, including natural and socio-economic components; and capacity of mitigation or resilience. The following equation was used to generate the TC risk map:
(3)
(3)
The risk index was then standardized using a common scale of 0–1 and the following equation:
(4)
(4)
where S is the standardized value, x is the value of a single cell in the spatial raster layer, and min and max represent the minimum and maximum values, respectively. Based on the standardized risk index, the risk was classified into five levels: very low, low, moderate, high, and very high. For more accurate and explicit visual assess the spatial characteristics of the TC risk, the study area was divided into 20 × 20 km evaluation units with a total of 547 grids and the value of the grid center point was used as the TC risk index of each risk unit (Das et al. Citation2020). Using the spatial statistics technique of ArcGIS 10.4 software, the characteristics of the spatial distribution of the TC risk level at the grid scale were further analyzed.
3.4. K-Means cluster method
The K-means clustering method was applied to determine the damage level. Although several methods are currently available for cluster analysis, the K-means cluster method is widely used clustering algorithm due to its simple implementation and efficiency (Tang et al. Citation2020). K-means cluster is an unsupervised clustering method that can cluster the input samples with similar characteristics into one class. The main steps is as follows (Xu et al. Citation2018):
Randomly select the k cluster centers
For each sample point, calculate the distance between each sample point and cluster center.
Classify the point nearest to the same central point as the representative cluster.
Update the center point for each cluster class.
Repeat the iteration until the best clustering is obtained. The goal of K-means algorithm is to minimize the sum of the squared error (SSE). The objective function
is determined as follows (Jain Citation2010):
Where is the jth sample point,
is the centroid of the ith cluster, k is the number of cluster centers, and n is the number of sample point. The SSE value is smaller and the clustering is optimal when the sample is divided into K clusters.
3.5. Spatial statistics method
Spatial autocorrelation analysis, including global and local spatial autocorrelation analysis, is a spatial statistical method that is mainly used to test whether a certain attribute value in a geospatial region significantly correlates with the attribute value of the same feature in adjacent spatial areas (Yang et al. Citation2019; Jing et al. Citation2020). In this study, Moran’s I index and Getis-Ord Gi* statistics were used to investigate the spatial autocorrelation of TC risk levels and identify high-risk hotspots in the study area.
The global Moran’s I index was used to measure the spatial autocorrelation of an element in the entire area. The global Moran’s I index is calculated as follows (Anselin Citation2010; Zou et al. Citation2018):
(6)
(6)
where
N is the number of units;
and
are the attribute values of the units i and j, respectively;
is the average value of the attribute;
denotes the spatial weight matrix, and the value of I ranges from −1 to 1.
The local Moran’s I index was used in this study to describe spatial clusters and spatial outliers of TC risk levels within units, which can be displayed in the form of the local indicator of spatial association (LISA) graphics (Hu et al. Citation2019; Liu et al. Citation2020). The local Moran’s I index is calculated as follows:
(7)
(7)
(8)
(8)
where
is the LISA index and S2 is the sample variance. An
value greater than zero indicates a positive spatial autocorrelation in the local spatial unit, which is represented by a “high–high” and “low–low” spatial aggregation pattern. In contrast, an
value below zero indicates a negative spatial autocorrelation of the local spatial unit, presenting a “high–low” and “low–high” spatial aggregation pattern.
Hotspot analysis was carried out using Getis-Ord Gi* statistics to identify the statistically significant hotspots and cold spots in TC-affected and unaffected regions. The z-score of Getis-Ord Gi *statistics is helpful for the determination of locations with spatial clusters of high or low values, with a confidence level of 99% (α < 0.01), 95% (α < 0.05), and 99% (α < 0.1) (Das et al. Citation2020; Hussain and Islam Citation2020). The Getis-Ord Gi*statistics can be calculated as follows (Ord and Getis Citation2010):
(9)
(9)
(10)
(10)
where n is the number of features;
and
are the attribute values of features i and j (
), respectively;
is the spatial weight of features i and j; S is the standard deviation, and
is the calculated z-score. The higher the statistically significant positive z-score is, the closer is the high-value cluster and vice versa.
4. Result
4.1. Hazard analysis
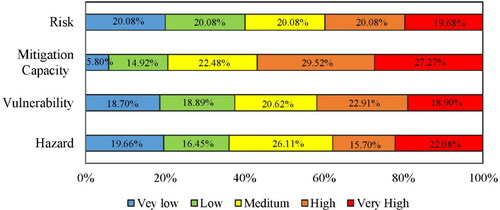
The hazard map () shows that the areas with the highest hazard risk are Zhanjiang, Huizhou, and Heyuan, whereas the hazard risk in Qingyuan, Zhongshan, Zhuhai, Dongguang, Shanwei, Shantou, and Chaozhou is relatively low. The area with an extremely high hazard level accounts for 22.08% of the total area, mainly distributed in the southwest of the WR and northeast of the ER. Areas with very low and low hazard levels are distributed across the whole province, except for the WR, covering 19.66% and 16.45% of the total area, respectively. Maoming, Jiangmen, and Guangzhou were classified as high-risk areas and Yunfu, Yangjiang, Zaoqing, and Meizhou were classified as moderate-risk areas, covering 15.70% and 26.11% of the study area, respectively (). The results show that areas with high hazard levels strongly correlate with the high frequency of TC landfalls or TCs passing through these areas and are prone to TC with high intensity. Most of the areas in the northeastern and southwestern parts of the Guangdong Province or close to the coast are characterized by a relatively moderate hazard level. Based on the topographic characteristics of Guangdong (), the entire area is higher in the north and lower in the south. Furthermore, the mountains present a northeast–southwest alignment parallel to the coastline and these areas are thus more likely affected by heavy rainfall and strong winds.
Figure 6. Spatial distribution of the risk components and integrated risk of TCs in the Guangdong: (a) Hazard, (b) Vulnerability, (c) Mitigation capacity, and (d) Risk.
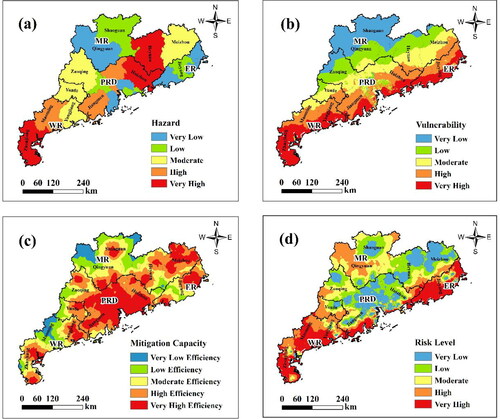
Figure 7. Area percentage of different levels (Very low, Low, Medium, High, and Very high) of different risk categories for TCs in Guangdong.
4.2. Vulnerability analysis
The spatial distribution of the vulnerability of TCs in Guangdong decreases from coastal to inland regions, with high values in coastal areas and low values in the inland region (). Approximately 18.90% of the study area belongs to very highly vulnerable zones, which mainly are located along the coast. Areas with very low and low vulnerability levels cover 18.7% and 18.89% of the study area, respectively (). Areas with very high or high vulnerability levels include Zhangjiang, Maoming, Yangjiang, Jiangmen, Zhuhai, Zhongshan, Shenzhen, Southeast Huizhou, Shanwei, Jieyang, Shantou, and Chaozhou, whereas areas with very low or low vulnerability levels include Shaoguan, Qingyuan, Zaoqing, and parts of Heyuan, Meizhou, and Yunfu, accounting for 18.70% and 18.89% of the study area, respectively. The results also show that most areas in Yunfu, Heyuan, Meizhou, Foshan, and Dongguan and the central part of Guangzhou have medium vulnerability levels, accounting for 20.62% of the study area. These results indicate that most areas near the coast is more vulnerable to TC occurrences.
4.3. Mitigation capability analysis
The map of the mitigation capability () shows that the spatial distribution of the mitigation capacity is centered in the PRD urban agglomeration and gradually weakens toward the surrounding cities. Therefore, the mitigation capacity in the PRD is higher, especially in Guangzhou, Shenzhen, Foshan, Dongguang, and Zhongshan, which were classified as zones with very high mitigation capacities. The periphery of these cities was classified as zone with a high mitigation capacity, accounting for 29.52% of the study area. Very low or low mitigation capacities are mainly distributed in Qingyuan, Maoming, and the periphery of Zhangjiang, Zaoqing, Shaoguan,Shanwei, and Jieyang, covering 5.80% and 14.92%, respectively (). The results indicate that most areas in the Guangdong Province have a moderate mitigation capacity and the ability to prevent and reduce disasters. Areas with a higher mitigation capacity are mainly those areas with a more developed economy, advanced medical facilities, and professional rescue agencies.
4.4. TC risk assessment
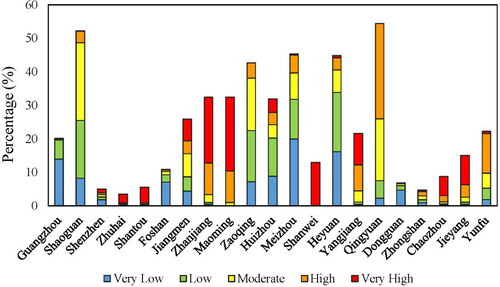
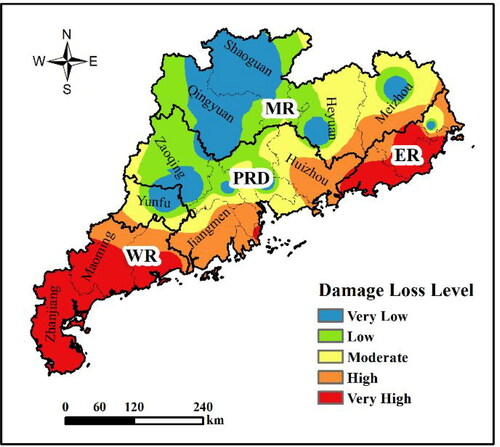
The composite risk map of TCs was produced by combining the hazard, vulnerability, and mitigation capacity maps. As shown in and Figure , areas near the coast, including Shantou, Shanwei, Jieyang, and Chaozhou in the ER as well as Zhanjiang, Maoming, and Yangjiang in the WR, exhibit high- or very high-risk levels, especially Maoming and Zhanjiang occupy the largest area proportion of the very high risk level, followed by Shanwei, Yangjiang, Jieyang, Jiangmen and Chaozhou. However, except for Zhuhai and Shenzhen, which exhibit very high-risk levels, most areas in the PRD exhibit the lowest risk level. In addition, the periphery of Yunfu and Yangjiang in the MR, Jiangmen, Zaoqing, and Huizhou in the PRD, Shanguan, Heyuan, and Meizhou in the MR exhibit a medium risk level and the centers of areas in Shaoguan, Meizhou, and Heyuan in the MR, Huizhou, Zaoqing, Zhongshan, and Jiangmen in the PRD, and Yunfu in the WR exhibit a low risk level. As shown in , the distribution of different risk levels in the Guangdong Province is homogeneous; approximately 19.68% of the study area exhibits an extremely high-risk level and areas with a high, medium, or low risk levels account for 20.08% of the study area.
Figure 8. Area percentage of the risk level in different cities of the Guangdong Province.
4.5. Validation of the TCs risk map
Currently, no absolute methods for verifying the generated TC risk map are available, hecne, absolute TC risk assessment is not possible. Therefore, the TC risk map was compared with historical disaster loss statistics derived from the Guangdong Marine Disaster Bulletin. Due to limited data availability and information integrity, historical disaster loss data from 2014 to 2018 were collected. In this study, the direct economic loss, TC-affected population, aquaculture loss area, and wrecked vessels were used as indicators of TC damage loss, while the K-means clustering method was applied to determine the level of TCs damage loss based on the cluster number.
The TC damage loss level map () shows that the damage caused by TC hazards is more serious in the areas near the coast. These areas include Zhanjiang, Maoming, Shantou, Shanwei, and Jieyang in the ER and WR, which suffered relatively heavy losses due to TCs, whereas the damages in Guangzhou, Dongguan, and Foshan in the PRD as well as Shaoguan and Qingyuan in the MR were very small, which basically agrees with the results obtained from the TC risk map.
Figure 9. Spatial distribution of TCs damage loss during 2014-2018.
4.6. Spatial autocorrelation analysis of the integrated TCs risk
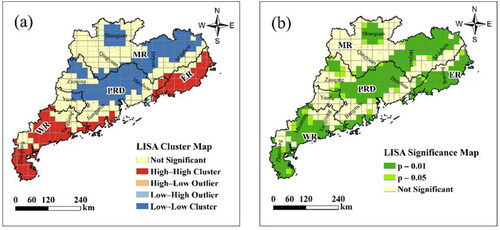
The results of the global spatial autocorrelation report show that the global Moran’s I index of the TC risk is 0.71, the z-score is 47.5, and the p-value is below 0.01, which means that there is a 99.9% likelihood that the significant spatial clustering phenomenon observed in this study is not random. Based on the results of the local Moran’s statistics (), the spatial association of the TC risk presents high–high and low–low aggregation and effects of high–low aggregation and low–low aggregation are not notable, which indicates that there the risk units are spatially homogeneous. The results show that high–high aggregation areas are mainly located in both the ER and WR. These areas have high TC risk values surrounded by similar high-risk values. Low–low aggregation areas are mostly located in the PRD and MR, indicating that the risk values in these areas and adjacent units are low. The LISA significance map shows that the significance level of most of the high–high and low–low aggregation regions is 0.01. A significance level of not significant is mainly located in these spatial outlier areas.
Figure 10. Local Moran statistics of the TC risk in Guangdong: (a) LISA cluster map, (b) LISA significance map.
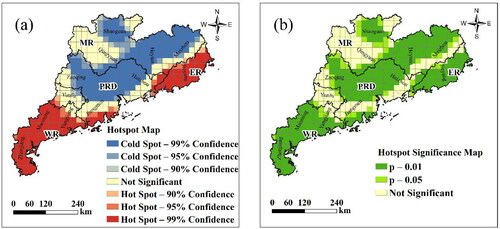
Similar to the LISA cluster results, the results of the hotspots analysis () show that the WR and ER exhibit a statistically significant spatial cluster of high TC risk hotspots (red color) with 99%, 95%, and 90% confidence levels, whereas regions not affected by TCs present statistically significant spatial clusters of low TC risk cold spots (blue color). In addition, in agreement with the spatial distribution of the TC risk, areas with high-risk spatial clustering are mainly located in Zhanjiang, Maoming in the WR, Shantou, Shanwei, Jieyang, and Chaozhou in the ER and areas with low-risk spatial clustering are scattered in Guangzhou, Foshan, and Dongguan in the PRD, Shaoguan, Meizhou, and Heyuan in the MR, corresponding to high-risk (hotspots) and low-risk (cold spots) regions. Therefore, the results obtained from the Getis-Ord Gi* statistics confirm that the high–high and low–low aggregation areas of the TC risk derived from the local spatial autocorrelation analysis are statistically significant hotspots and cold spots, respectively.
Figure 11. Getis-Ord Gi* statistics of the TCs risk level in Guangdong: (a) Hotspot Map (b) Significance map.
5. Discussion
Risk assessment is an important basis for disaster prevention as well as post-disaster mitigation and risk reduction. Guangdong is one of the main TC-prone zones in China, but only limited studies have focused on the identification of the TC risk by integrating multi-criterion methods and spatial statistics. In this study, we evaluated the TC risk level and spatial pattern of the TC risk in Guangdong by investigating the systematic interaction between prominent physical and anthropological factors and the integrated mitigation capacity. Additionally, in this study, an approach combining AHP–IoE and spatial statistics were used for the first time to conduct TC risk assessment. The results were compared with historical disaster loss records. The results of the validation indicate that the integrated AHP-IoE method and spatial statistics are feasible for the evaluation of the TC risk, which can be used as references for future work on risk prevention and disaster reduction. For example, the risk map generated in this study shows that the TC risk level in Guangdong decreases from both ends of the coastal areas to the inland areas, which is consistent with the findings of previous studies (Li and Li Citation2013; Cai et al. Citation2020). Based on our results, the areas with the highest risk are mainly concentrated in the ER, WR, Zhuhai, and Shenzhen in the PRD near the coastline, whereas other areas of the PRD and MR in the inland were classified as zones with the lowest risk. These results agree with an earlier study in which assessed the risk level of TC disasters in the Guangdong Province. The authors showed that areas with the highest TC risk are located along the western, central and eastern coast in Guangdong (Zhang et al. Citation2011).
Another important finding is that the risk areas affected by TCs regionally vary, which depends on various factors such as the regional geographical location, terrain characteristics, and socio-economic development. We observed that several areas with a lower risk had a higher TC risk, especially in the PRD. For instance, Shenzhen and Zhuhai exhibited a high efficiency with respect to disaster mitigation and low TC hazard levels; however, these areas remained at high risk due to high population density and proximity to the coastline, which aggravates the vulnerability to TCs. Guangzhou, Foshan, Dongguang, and Zhongshan, were classified as very low risk areas, and are highly efficient in coping with TCs, despite having highly concentrated population. As the most frequent landfall area of TCs, Zhanjiang in the WR has become another very high-risk area due to the very high hazard level of exposure to severe TCs and very high vulnerability with the poor infrastructure to resist TCs. Shantou, Shanwei, Jieyang, and Chouzhou in the ER were classified as high-risk areas. This is mainly due to their geographical locations near the coastline, lack of mitigation measures, which increases their vulnerability to TCs, and lack of efficient coping measures. The centers of Yunfu, Shaoguan, Heyuan, and Meizhou in the MR were classified as areas with the least risk, corresponding to the low hazard level and vulnerability due to the high elevation and being far from the coastline; thus, these areas are less affected by TCs. This suggests that disaster prevention and mitigation measures should be implemented according to local conditions.
Based on our results, areas with a high TC risk in the PRD (Zhuhai and Shenzhen) should continue to reduce the vulnerability of the disaster-bearing body to minimize the effects of TCs on local areas. For example, a more flexible evacuation plan should be constructed in areas with very high risk. In addition, such a plan should be followed in case of a TC occurrence to avoid secondary disasters caused by crowds. Alternatively, public schools, Children’s palaces, museums, parks, and other public places can be used as open spaces for emergency disaster prevention when it becomes necessary to transfer highly densed populations, which can be integrated with early warning, emergency channel activation, and evacuation command systems (Mansour Citation2019). In areas near the coastline in the ER (Shantou, Shanwei, Jieyang, Chaozhou) and WR (Zhanjiang, Maoming), effective tropical cyclone precaution plans and mitigation measures, such as the strengthening of dams, delaying of economic activity, closing traffic roads, and construction of emergency shelters, should be implemented to reduce the TC risk (Haque and Blair Citation1992; Quader et al. Citation2017). More importantly, the TC mitigation capacity and awareness of disaster threats must be increased by regularly organizing lectures on TCs and conducting evacuation and refuge drills.
Our study has some limitations such as the irrationality of the factor index selection, lack of detailed historical meteorological data and disaster loss data, and different spatial resolution of available data from various data sources. These limitations can be addressed by improving the data acquisition technology. In addition, due to the difficulty with respect to the data acquisition, other indicators of the mitigation capacity criteria, such as the number of medical facilities, medical staff, and financial support, have not been considered. However, the findings of this study have implications for the risk reduction of TCs in the Guangdong Province. In summary, the results of this study provide theoretical basis for the design of disaster reduction plans and TC prevention and mitigation measures and thus are beneficial for TC risk management. The integrated AHP-IoE method and spatial statistics based on GIS techniques are useful for TC risk assessment and can be applied to other disaster research. Furthermore, the hazard level, vulnerability, and mitigation capacity maps constructed for the Guangdong Province can also be used as baseline information for local authorities to understand the risk status of different regions and formulate special risk reduction strategies based on information on disaster-inducing factors, disaster-breeding environments, disaster-bearing bodies, and the disaster reduction capacity in this region. A more reliable TC risk map is warranted and the impact and recovery of TCs should be assessed using additional data and advanced processing techniques.
6. Conclusion
In this study, an integrated TC risk map was constructed by combining the AHP and IoE methods to identify the degree of the TC risk in the Guangdong Province and analyze the spatial pattern of the TC risk at the 1km grid scale using the spatial statistics of the ArcGIS platform. Nineteen indicators representing hazard level, vulnerability, and mitigation capacity were aggregated using the WLC method to evaluate the hazards of TCs-induced factors, vulnerability of the disaster-bearing body, and mitigation capacity of TC disasters, respectively. Our results indicate that the TC risk level decreased from both ends of coastal areas to the inland areas, while ∼40% of the areas had an high or very high TC risk. Areas with the highest risk are mainly concentrated in the ER, WR, and Zhuhai and Shenzhen in the PRD near the coastline, whereas areas in the PRD and MR in the inland were classified as zones with the lowest risk. The spatial pattern of the TC risk presents a significant positive spatial clustering. Areas near the coast are subject to the highest TC risk, especially the coastal areas of Zhanjiang, Maoming, Shantou, Shanwei, Jieyang, and Chaozhou, which are significant hotspots with high TC risk levels. In contrast, Guangzhou, Dongguan, Foshan, Shaoguan, Heyuan, and Meizhou were classified as zones with the lowest risk (i.e., cold spots). The present TC risk assessment study suggests that models based on a GIS-integrated multi-index evaluation method and spatial statistics are applicable and reliable and our results can be used as reference for designing disaster mitigation and adaptation policies.
Acknowledgements
We thank all the reviewers for reviewing the draft of this paper and helping improve the quality of the manuscript.
Disclosure statement
No potential conflict of interest was reported by the authors.
Data availability statement
The data presented in this study are openly available in: [http://www.jma.go.jp/jma/jma-eng/jma-center/rsmc-hp-pub-eg/besttrack.html],[http://www.webmap.cn/commres.do?method=result100W], [https://doi.org/10.18170/DVN/WSXCNM], [http://data.cma.cn], [http://earthexplorer.usgs.gov/], and [http://www.resdc.cn].These original various datasets are publicly available in zenodo repository via https://zenodo.org/record/4937322#.YMbBd8j1xbl.
Additional information
Funding
References
- Alam A, Sammonds P, Ahmed B. 2020. Cyclone Risk Assessment of the Cox's Bazar district and Rohingya refugee camps in southeast Bangladesh. Sci Total Environ. 704:135360.
- Anselin L. 2010. Local indicators of spatial association-LISA. Geogr Anal. 27(2):93–115.
- Azaz LKA. 2010. Capabilities of using remote sensing and GIS for tropical cyclones forecasting, monitoring, and damage assessment. In: Charabi Y, editor. Indian ocean tropical cyclones and climate change. Dordrecht: Springer. https://doi.org/https://doi.org/10.1007/978-90-481-3109-922.
- Bacmeister JT, Reed KA, Hannay C, Lawrence P, Bates S, Truesdale JE, Rosenbloom N, Levy M. 2018. Projected changes in tropical cyclone activity under future warming scenarios using a high-resolution climate model. Clim Change. 146(3–4):547–560.
- Banholzer S, Kossin J, Donner S. 2014. The impact of climate change on natural disasters. In: Singh A, Zommers Z, editors. Reducing disaster: Early warning systems for climate change. Dordrecht: Springer. https://doi.org/https://doi.org/10.1007/978-94-017-8598-3_2.
- Cai L, Li Y, Chen M, Zou Z. 2020. Tropical cyclone risk assessment for China at the provincial level based on clustering analysis. Geomat Nat Hazards Risk. 11(1):869–886.
- Chan JCL, Liu KS. 2004. Global warming and Western North Pacific typhoon activity from an observational perspective. J Clim. 17(23):4590–4602.
- Chen Y, Liu R, Barrett D, Gao L, Zhou M, Renzullo L, Emelyanova IA. 2015. A spatial assessment framework for evaluating flood risk under extreme climates. Sci Total Environ. 538:512–523.
- Chou J, Dong W, Tu G, Xu Y. 2020. Spatiotemporal distribution of landing tropical cyclones and disaster impact analysis in coastal China During 1990–2016. Phys Chem Earth Parts A/B/C. 115:102830. https://doi.org/https://doi.org/10.1016/j.pce.2019.102830.
- Das M, Das A, Momin S, Pandey R. 2020. Mapping the effect of climate change on community livelihood vulnerability in the Riparian Region of Gangatic Plain, India. Ecol Indic. 119:106815.
- Dewan AM. 2013. Hazards, risk, and vulnerability. In Floods in a megacity. Dordrecht: Springer Geography, Springer. https://doi.org/https://doi.org/10.1007/978-94-007-5875-9_2.
- Du J, Fan ZJ, Pu J. 2020. Comparative study on flash flood hazard assessment for Nam Ou River Basin, Lao PDR. Nat Hazards. 102(3):1393–1417.
- Emanuel K, Sundararajan R, Williams J. 2008. Hurricanes and global warming: results from downscaling IPCC AR4 simulations. Bull Amer Meteor Soc. 89(3):347–368.
- Fu D, Zhang X, Li X, Liu D, Yu G, Xu H. 2020. Changes in the hydrodynamic characteristics of the upper layer of the South China sea during the period of super typhoon Rammasun (2014). Tellus A. 72(1):1–15.
- Gao Y, Wang H, Liu GM, Sun XY, Fei XY, Wang PT, Lv TT, Xue ZS, He YW. 2014. Risk assessment of tropical storm surges for coastal regions of China. J Geophys Res Atmos. 119(9):5364–5374.
- Haque CE, Blair D. 1992. Vulnerability to tropical cyclones: Evidence from the April 1991 cyclone in coastal Bangladesh. Disasters. 16(3):217–229.
- Hoque M-A-A, Phinn S, Roelfsema C. 2017a. A systematic review of tropical cyclone disaster management research using remote sensing and spatial analysis. Ocean & Coastal Manage. 146:109–120.
- Hoque M-A-A, Phinn S, Roelfsema C, Childs I. 2016. Assessing tropical cyclone impacts using object-based moderate spatial resolution image analysis: A case study in Bangladesh. Int J Remote Sens. 37(22):5320–5343.
- Hoque M-A-A, Phinn S, Roelfsema C, Childs I. 2017b. Tropical cyclone disaster management using remote sensing and spatial analysis: A review. Int J Disaster Risk Reduc. 22:345–354.
- Hoque M-A-A, Phinn S, Roelfsema C, Childs I. 2018. Assessing tropical cyclone risks using geospatial techniques. Appl Geogr. 98:22–33.
- Hoque M-A-A, Pradhan B, Ahmed N, Roy S. 2019. Tropical cyclone risk assessment using geospatial techniques for the eastern coastal region of Bangladesh. Sci Total Environ. 692:10–22.
- Hu M, Li Z, Yuan M, Fan C, Xia B. 2019. Spatial differentiation of ecological security and differentiated management of ecological conservation in the Pearl River Delta, China. Ecol Indic. 104:439–448.
- Hu T, Yang J, Li X, Gong P. 2016. Mapping urban land use by using landsat images and open social data. Remote Sens. 8(2):151.
- Hussain N, Islam MN. 2020. Hot Spot (Gi*) model for forest vulnerability assessment: A remote sensing-based geo-statistical investigation of the Sundarbans Mangrove forest, Bangladesh. Model Earth Syst Environ. 6(4):2141–2151.
- Jain AK. 2010. Data clustering:50 years beyond K-means. Pattern Recog Lett. 31(8):651–666.
- Jha RK, Gundimeda H. 2019. An integrated assessment of vulnerability to floods using composite index – A district level analysis for Bihar, India. Int J Disaster Risk Reduc. 35:101074.
- Jing Y, Zhang F, He Y, Kung HT, Johnson VC, Arikena M. 2020. Assessment of spatial and temporal variation of ecological environment quality in Ebinur Lake Wetland National Nature Reserve, Xinjiang, China. Ecol Indic. 110:105874.
- Kabenge M, Elaru J, Wang H, Li F. 2017. Characterizing flood hazard risk in data-scarce areas, using a remote sensing and GIS-based flood hazard index. Nat Hazards. 89(3):1369–1387.
- Li K, Li GS. 2013. Risk assessment on storm surges in the coastal area of Guangdong Province. Nat Hazards. 68(2):1129–1139.
- Liu X, Chen H. 2019. Integrated assessment of ecological risk for multi-hazards in Guangdong Province in Southeastern China. Geomat Nat Hazards Risk. 10(1):2069–2093.
- Liu J, Chen J, Qin Q, You H, Han X, Zhou G. 2020. Patch pattern and ecological risk assessment of alpine grassland in the source region of the Yellow River. Remote Sens. 12(20):3460.
- Liu T, Liu S, Yang X, Chen J, Zhang C. 2018. Statistical analysis of the typhoon influencing Guangdong Province during 1951–2015. Mar Forecasts. 35(4):68–74.
- Liu Y, Lu C, Yang X, Wang Z, Liu B. 2020. Fine-scale coastal storm surge disaster vulnerability and risk assessment model: A case study of Laizhou Bay China. Remote Sens. 12(8):1301.
- Liu S, Tao D, Zhao K, Minamide M, Zhang F. 2018. Dynamics and predictability of the rapid intensification of super typhoon Usagi (2013). J Geophys Res Atmos. 123(14):7462–7481.
- Majumder R, Bhunia GS, Patra P, Mandal AC, Ghosh D, Shit PK. 2019. Assessment of flood hotspot at a village level using GIS-based spatial statistical techniques. Arab J Geosci. 12(13):1–12.
- Mansour S. 2019. Geospatial modelling of tropical cyclone risks to the Southern Oman coasts. Int J Disaster Risk Reduc. 40:101151.
- Mazumdar J, Paul SK. 2018. A spatially explicit method for identification of vulnerable hotspots of Odisha, India from potential cyclones. Int J Disaster Risk Reduc. 27:391–405.
- Nguyen KA, Liou YA, Terry JP. 2019. Vulnerability of Vietnam to typhoons: A spatial assessment based on hazards, exposure and adaptive capacity. Sci Total Environ. 682:31–46.
- Ogato GS, Bantider A, Abebe K, Geneletti D. 2020. Geographic information system (GIS)-based multicriteria analysis of flooding hazard and risk in Ambo town and its watershed, West Shoa Zone, Oromia Regional State, Ethiopia. J Hydrol Reg Stud. 27:100659.
- Ord JK, Getis A. 2010. Local spatial autocorrelation statistics: distributional issues and an application. Geogr Anal. 27(4):286–306.
- Quader MA, Khan AU, Kervyn M. 2017. Assessing risks from cyclones for human lives and livelihoods in the coastal region of Bangladesh. IJERPH. 14(8):831.
- Rashid A-K-M-M. 2013. Understanding vulnerability and risks. In: Shaw R, Mallick F, Islam A, editors. Disaster risk reduction approaches in Bangladesh. Disaster risk reduction (methods, approaches and practices). Tokyo: Springer; p. 23–43. https://doi.org/https://doi.org/10.1007/978-4-431-54252-0_2.
- Roy DC, Blaschke T. 2015. Spatial vulnerability assessment of floods in the coastal regions of Bangladesh. Geomat Nat Hazards Risk. 6(1):21–44.
- Sajjad M, Chan JCL. 2019. Risk assessment for the sustainability of coastal communities: A preliminary study. Sci Total Environ. 671:339–350.
- Sajjad M, Chan JCL, Kanwal S. 2020. Integrating spatial statistics tools for coastal risk management: A case-study of typhoon risk in mainland China. Ocean & Coastal Manage. 184:105018.
- State Information Center. 2017. Map POI (Point of Interest) Data. Peking Univ Open Res Data Platform. V2.
- Su H, Qian C, Gu H, Wang Q. 2016. The impact of tropical cyclones on China in 2015. Trop Cyclone Res Rev. 5(1–2):1–11.
- Sun Z, Zhang J, Zhang Q, Hu Y, Yan D, Wang C. 2014. Integrated risk zoning of drought and waterlogging disasters based on fuzzy comprehensive evaluation in Anhui Province, China. Nat Hazards. 71(3):1639–1657.
- Sun Y, Zhong Z, Li T, Yi L, Camargo SJ, Hu Y, Liu K, Chen H, Liao Q, Shi J. 2017. Impact of ocean warming on tropical cyclone track over the Western North Pacific: A numerical investigation based on two case studies. J Geophys Res Atmos. 122(16):8617–8630.
- Tang Y, Che A, Cao Y, Zhang F. 2020. Risk assessment of seismic landslides based on analysis of historical earthquake disaster characteristics. Bull Eng Geol Environ. 79(5):2271.
- UNISDR. 2009. UNISDR terminology on disaster risk reduction. Geneva. Switzerland: U N International Strategy for Disaster Reduction.
- Wang G, Liu Y, Hu Z, Lyu Y, Zhang G, Liu J, Liu Y, Gu Y, Huang X, Zheng H, et al. 2020. Flood risk assessment based on fuzzy synthetic evaluation method in the Beijing-Tianjin-Hebei Metropolitan Area, China. Sustainability. 12(4):1451.
- Wang S, Mu L, Yao Z, Gao J, Zhao E, Wang L. 2021. Assessing and zoning of typhoon storm surge risk with a Geographic Information System (GIS) technique: A case study of the coastal area of Huizhou. Nat Hazards Earth Syst Sci. 21(1):439–462.
- Wang Y, Wen S, Li X, Thomas F, Su B, Wang R, Jiang T. 2016. Spatiotemporal distributions of influential tropical cyclones and associated economic losses in China in 1984–2015. Nat Hazards. 84(3):2009–2030.
- Webster PJ, Holland GJ, Curry JA, Chang HR. 2005. Changes in tropical cyclone number, duration, and intensity in a warming environment. Science. 309(5742):1844–1846.
- Xu W, Deng W. 2020. Characteristics of tropic cyclones landing in Guangdong Province and their impacts. Mar Forecasts. 37(2):11–18.
- Xu H, Ma C, Lian J, Xu K, Chaima E. 2018. Urban flooding risk assessment based on an integrated k-means cluster algorithm and improved entropy weight method in the region of Haikou, China[J]. J Hydrol. 563:975–986.
- Xu X, Sun D, Guo T. 2015. A systemic analysis of typhoon risk across China. Nat Hazards. 77(1):461–477.
- Yang J, Li L, Zhao K, Wang P, Wang D, Sou IM, Yang Z, Hu J, Tang X, Mok KM, Liu PLF. 2019. A comparative study of typhoon Hato (2017) and typhoon Mangkhut (2018)—their impacts on coastal inundation in Macau. J Geophys Res Oceans. 124(12):9590–9619.
- Yang X, Lin L, Zhang Y, Ye T, Chen Q, Jin C, Ye G. 2019. Spatially explicit assessment of social vulnerability in Coastal China. Sustainability. 11(18):5075.
- Yao Y, Li X, Liu X, Liu P, Liang Z, Zhang J, Mai K. 2017. Sensing spatial distribution of urban land use by integrating points-of-interest and Google Word2Vec Model. Int J Geogr Inf Sci. 31(4):825–848.
- Yin J, Yin Z, Xu S. 2013. Composite risk assessment of typhoon-induced disaster for China’s coastal area. Nat Hazards. 69(3):1423–1434.
- Yu F, Switzer AD, Lau AYA, Yeung HYE, Chik SW, Chiu HC, Huang Z, Pile JA. 2013. Comparison of the post-storm recovery of two sandy beaches on Hong Kong Island, Southern China. Quat Int. 304:163–175.
- Zhang Y, Fan G, He Y, Cao L. 2017. Risk assessment of typhoon disaster for the Yangtze River Delta of China. Geomat Nat Hazards Risk. 8(2):1580–1591.
- Zhang J, Huang C, Liu X, Gong Q. 2011. Risk assessment of land-falling tropical cyclones in Guangdong Province, China. Hum Ecol Risk Assess Int J. 17(3):732–744.
- Zhang X, Nie J, Cheng C, Xu C, Zhou L, Shen S, Pei Y. 2021. Natural and socioeconomic factors and their interactive effects on house collapse caused by Typhoon Mangkhut. Int J Disaster Risk Sci.12(1):121–130.
- Zhong S, Wang C, Yu Z, Yang Y, Huang Q. 2018. Spatiotemporal exploration and hazard mapping of tropical cyclones along the coastline of China. Adv. Meteorol. 2018:1–15.
- Zou F, Zhan Q, Zhang W. 2018. Quantifying the impact of human activities on geological hazards in mountainous areas: Evidence from Shennongjia. Nat Hazards. 90(1):137–155.