
 ?Mathematical formulae have been encoded as MathML and are displayed in this HTML version using MathJax in order to improve their display. Uncheck the box to turn MathJax off. This feature requires Javascript. Click on a formula to zoom.
Abstract
This study aims at characterizing agricultural drought in Ethiopia and understanding the effects of drought on crop yield. Monthly, seasonal and annual Normalized Difference Vegetation Index (NDVI) and Vegetation Condition Index (VCI) values were calculated using MODIS (MOD13Q1) from the year 2003 to 2017. The relationships between NDVI, VCI, and crop yield were examined to predict the possibility of drought impacts on crop productivity. We found that VCI and NDVI data provides consistent and spatially explicit information for operational drought monitoring in Ethiopia. Results also indicated that the most extreme agricultural drought in recent years occurred in 2003, 2004, 2008, 2009, and 2015. These findings also show that mild to severe droughts have a great chance of occurrence in Ethiopia. However, only severe drought has significant impacts on crops. The food crops yield data used in this study include cereals, legumes, and tubers. It was observed that cereals such as (Zea mays), teff (Eragrostis tef), haricot beans (Phaseolus vulgaris) are more sensitive to agricultural drought when compared to the tubers such as sweet potato (Ipomoea batatas) and taro (Colocasia esculenta). Thus, drought preparedness programs need to pay more attention to the cultivation of these crops under severe drought conditions.
NDVI and VCI patterns easily discriminate cereals and legumes when compared to tuber crops.
45% and 43% yield variability of respectively teff and maize is explained by the NDVI patterns.
The studied crops (Teff, Maize, Sweet potato and Taro) are less discriminable to seasonal VCI variation.
Drought preparedness strategies should encourage farmers to cultivate tubers instead of cereals.
The PMARE value for Taro and sweet potato exceeded the model acceptable range.
Highlights
1. Introduction
Prolonged dry periods that result from precipitation deficiency and water inadequacy, below expected or normal amounts, cause significant environmental and economic challenges, particularly, in agricultural production. This in turn affects the balance of food supply and demand (Boken Citation2009). In the last 40 years, drought, a complex natural phenomenon has been recorded as a widespread hazard, with its occurrence in nearly all regions of the world, and its effect on more people globally than any other natural hazard. Various degrees of intensity, duration, spatial extent, and impacts are witnessed during droughts (FAO Citation2020). Short-term agricultural droughts at critical crop growth stages have also been reported to have severe impacts on the agricultural sector as a whole (Wu and Wilhite Citation2004).
In Ethiopia, agriculture remains, by far, the most important economic sector and contributes 27.5 billion dollars or 34.1% to the GDP, employs about 79% of the population, accounts for 79% of foreign earnings, and is the major source of raw material and capital for investments and markets (MOA Citation2019). According to Abera et al. (Citation2018), 80% of Ethiopia’s population depends on rain-fed agriculture. Thus, the welfare and economic productivity of most of the communities in Ethiopia are linked to rainfall. Rain-fed agriculture’s dependence has made Ethiopia’s economy extremely vulnerable to the impacts of climate variability and climate change that are usually manifested through the increase in temperature, rainfall variability and recurrent droughts (Negash et al. Citation2020, Citation2019).
Recently, droughts have occurred more frequently in Ethiopia, due to the combination of several phenomena including but not limited to the El Nino-Southern Oscillation (ENSO) (Shanko and Camberlin Citation1998; Seleshi and Zanke Citation2004; Gleixner et al. Citation2017) and the mask trend fluctuations in sea surface temperatures (SSTs) (Gissila et al. Citation2004; Segele and Lamb Citation2005; Viste et al. Citation2012; Jury and Funk Citation2013). For a drought-prone country such as Ethiopia, vulnerability is majorly due to heavy economic dependence and attachments to rain-fed smallholder agriculture (Conway and Schipper Citation2011; Alemayehu and Bewket Citation2016). Deeper insights into long-term annual and seasonal changes in vegetation health conditions as a result of annual and seasonal rainfall variability is useful for sustainable adaptation interventions and drought risk management (Mulugeta et al. Citation2019).
Monitoring drought extent at different spatial scales is vital in drought hazard assessment. Proper understanding of drought activities helps in developing important measures for improving food security (Rojas et al. Citation2011). There are two major approaches for assessing the impacts of droughts which include (1) climate-based indicators derived from weather stations, and (2) remote sensing-based approach. Lack of spatial details is one of the major drawbacks in the assessment of drought effects using climate-based drought indicators. This is because this approach depends on sparsely distributed weather stations’, which limits the reliability of the indices (Magno et al. Citation2014). In contrast, the remote sensing approach has proven to be an effective tool that provides spatially reliable information with enough details.
Satellite-based remotely-sensed data provides a synoptic view of the earth surface and can be used for drought assessments (Gu et al. Citation2007). Several of such remote-sensing-basd drought indices have been developed and utilized for assessing droughts in different areas (Mishra Citation2015). For example, Muthumanickam et al. (Citation2011) applied the Vegetation Condition Index (VCI) to estimate the vegetation health and monitor drought in the western tracts of Tamil Nadu in India, while Ungani and Kogan (Citation1998) ascertained that even crop yields can be predicted 5 to 13 weeks before harvests using remote sensing technique. The Normalized Difference Vegetation Index (NDVI) is one of the most commonly used indices in drought assessment and monitoring (Ji and Peters Citation2003). To improve the accuracy of this index, especially in drought monitoring, a combine vegetation index is recommended to monitor drought occurrence (Patel Citation2009, Patel et al. Citation2012). A combination of NDVI and VCI provides a strong correlation with rainfall and provides valuable information for agricultural drought identification as part of early warning systems (Quiring and Ganesh Citation2010; Jain et al. Citation2010; Sruthi and Aslam Citation2015).
This makes NDVI serve as a reliable proxy in the evaluation of the effects of rainfall variability on vegetation conditions. Also, the NDVI has been safely used as proxy for crop loss in insurance index design in northern Ethiopia by Eze et al. (Citation2020), as well as in other places (Turvey and McLaurin Citation2012; Bobojonov et al. Citation2014).
A study by Nicholson and Farrar (Citation1994) studied the influence of soil type on the relationships between NDVI, rainfall, and soil moisture in semi-arid Botswana and found that NDVI only increased with rainfall in the linear relationship, when rainfall is below ‘saturation threshold’.
A recent study by Zambrano et al. (Citation2016) argued that VCI is a good indicator of drought, with the promise of accurately identifying affected stakeholders in a drought-prone areas and improving drought emergency response, especially in the absence of local observations.
A more detailed analysis of the relationship between the VCI and corn yield in Southern Africa was done by Unganai and Kogan (Citation1998). The study revealed that 46 to 83% of the variance in corn yields were explained by VCI. The authors concluded that VCI is suitable and can be used to detect, monitor and map agricultural drought but most importantly to assess corn yield in Zimbabwe (Unganai and Kogan Citation1998).
A study carried out in Kazakhstan by Gitelson et al. (Citation1998) examining the relationship between the VCI and crop growth at six sites that spanned a range of different climate zones indicated that on average, VCI explained 76% of the crop variations in density (number of plants per square meter) and the performance of the VCI remained consistent across the six sites.
Nevertheless, many authors have suggested that vegetation drought is more accurately assessed if VCI is combined with the Temperature Condition Index (TCI) to form the Vegetation Health Index (VHI). Although a study done by Du et al. (Citation2013) indicated that TCI as an indirect parameter has limitation to accurately monitor the changes in soil moisture.
Moreover, environmental factors such as insects, disease and lack of nutrients in the soil or anything that stresses vegetation and plant growth, can potentially lower the VCI values as it was ascertained by Vicente-Serrano (Citation2007). Bokushevaa et al. (2016), identified factors such as salinity, crop diseases and insects as able to reduce vegetation green reflectance at a local scale with a minimum or no effect on the larger scale. However, agricultural drought mostly occurred on a larger scale and VCI provide greater spatial details about drought conditions as indicated: Quiring and Ganesh (Citation2010).
Another study by Piao (Citation2003), in China observed that the performance of vegetation condition indices using a long serie datasets such as the one of this study (2003–2017) can be influenced by the changes that occurred in the land use and land cover during the time period.
Recently, addition to VHI, there is call to use a new drought index called VegDRI, which seems to be more holistic. It is composed of satellite-based estimates of vegetation condition, station-based drought indices and information about land use, land cover and soils to produce an hybrid drought index (Brown et al. Citation2008).
Although many studies have been conducted in Ethiopia on drought monitoring, very little has focussed on relating moisture-stress conditions with crop yields. Therefore, the purpose of this study is to describe the spatio-temporal patterns of vegetative drought and its effect on major food crops in Ethiopia using the 2003 to 2017 time series Moderate Resolution Imaging Spectroradiometer (MODIS) remote sensing data. The findings of this study are expected to provide unavailable insights on the study area, while serving as a base for future studies on the subject, especially regarding other food crops.
2. Material and methods
2.1. Study area description
This study focussed on the whole of Ethiopia (). Ethiopia is located in the northeastern part of Africa between latitude 3° 23′ and 14° 51′ North and between longitude 32° 59′ to 47° 58′ East (). The country covers about 1,221,900 km2, with an agricultural system that is influenced by climate, soil type and land tenure system.
Figure 1. Map of the study area, SNNP = Southern Nations and Nationalities Peoples’ Region.
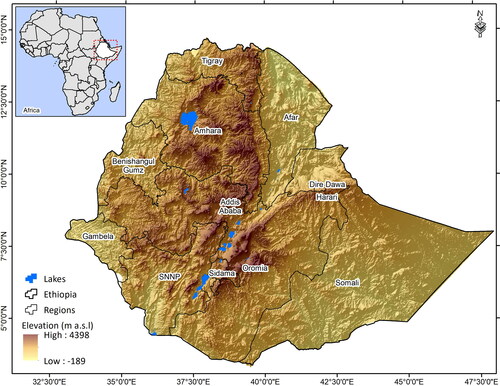
The Ethiopian topography is dominated by extensive high lands, deep river canyons and surging plateaus, with the Great Rift Valley bisecting the country into the central/western and southern highlands surrounded by lowlands. Ethiopia’s elevation ranges from −130 m in the Afar depression to 4550 m at the peak of Mount Ras Dashen (Kaluski et al. Citation2002). The country possesses diverse types of vegetation (Abebe et al. Citation2013; Gebre et al. Citation2019), agro-ecological zones (Du Citation2017), and geological formations. The vegetation is dominated by natural gum- and resin-producing tree species such as Boswellia, Commiphora, and Acacia (Gebrehiwot et al. Citation2003).
2.2. Data sources and analysis methods
2.2.1. MODIS data and pre-processing
Moderate Resolution Imaging Spectroradiometer (MODIS) NDVI data were used from the year 2003 to 2017 to capture the drought activities in recent years. MODIS data were preferred because the study area is large and the data has been found to offer improved spatial resolution (250 m to 1 km compared to 1 km), geolocation accuracy improvement (Wolfe Citation2002), from 1 to 2 km (Box Citation2005), the atmospheric correction scheme and clouds screening (Heidinger et al. Citation2002) and sensor calibration (Justice and Townshend Citation2002). This data was acquired from the National Aeronautics and Space Administration’s (NASA) Earth Observing System (EOS). In this study, the AA-NDVI based on MODIS 16-day composite data (MODIS13Q1V6) for the period 2003–2017 was used. MODIS13Q1V6 dataset was downloaded from the MODIS website of the NASA Land Processes Distributed Active Archive Center (LP DAAC) (https://lpdaac.usgs.gov/). Using the MODIS re-projection tool, the MODIS13Q1 dataset downloaded for the study area were firstly resized, and then re-projected to Albers equal-area projection with the WGS84 datum.
Since green vegetation has strong absorption of the electromagnetic spectrum in the red region and high reflectance in the infrared region, Nomalised Difference Vegetation Index (NDVI) was thus formulated using the combination of red and infrared bands using the following EquationEquation (1)(1)
(1) :
(1)
(1)
According to Leprieur et al. (Citation2000), NDVI is far more sensitive to various vegetation cover, specifically those of the arid regions such as Ethiopia and thus it has proved to perform well in monitoring vegetation coverage (Roberts et al. Citation2011). Noise from the signal were removed using Savitsky Golay’s smoothing and differentiation filter. However, because NDVI values do not reflect drought or non-drought conditions, the occurrence and severity of a drought are determined using NDVI deviation (DEVNDVI), which is the deviation of NDVI from its long-term mean (EquationEquation (2)(2)
(2) ).
(2)
(2)
where NDVIi is the NDVI value for a month i and NDVImean, m is the long term NDVI means for the same month m. A negative DEVNDVI indicates below-normal vegetation condition/health and hints at prevailing droughts. Greater negative departures from the normal vegetation condition/health thus imply a greater magnitude of a prevailing drought. the DEVNDVI as a drought indicator is widely applied in drought studies (Johnson et al. Citation1993; Gedif Citation2014). However, because deviation from the mean does not take into account the standard deviation, DEVNDVI values can be misinterpreted when vegetation conditions’ variability in a given location is very high in a particular year.
On the other hand, the VCI was first developed and suggested by Kogan (Citation1995) and Kogan (Citation1997). It shows the closeness of the NDVI of the current month to the minimum NDVI derived from long-term records. VCI also provide information on the spatial characteristics, duration and intensity of droughts. Other scholars ascertain that VCI is in good agreement with precipitation patterns (Chopra Citation2006) as it perfectly indicates the status of the vegetation cover for a given ecosystem over many years.
VCI is estimated following EquationEquation (3)(3)
(3) .
(3)
(3)
The choice of NDVI and VCI as indicators for monitoring drought has been evaluated worldwide. A strong association of NDVI with rainfall has been confirmed by (Al-Bakri and Suleiman Citation2004; Lamchin 2004; Martiny et al. Citation2006; Richard and Poccard Citation2010).
2.2.2. Crop dataset
Given the sensitivity of crop production to agricultural drought, the average crop yield data were obtained from the Central Statistics Agency of Ethiopia (CSA) (CSA Citation2004, Citation2016), covering the period 2003 to 2015. The CSA reports provide extant data for the examination of the relationship between crop yield and existing drought conditions, with the validation of remotely-sensed drought events. For this study, major crops grown in the study area are considered namely: maize (Zea mays), teff (Eragrostis tef), haricot beans (Phaseolus vulgaris), sweet potato (Ipomoea batatas) and taro (Colocasia esculenta). These crops were chosen due to their significance as staple foods in Ethiopia and data availability for the period under consideration.
2.2.2.1. Limitations of this study
The authors choice of NDVI and VCI as indicators for monitoring drought was based on the fact that these two indices have been widely used across the world to assess agricultural drought. Nevertheless, expanded scope for robust results should have included more indices such as the Temperature Condition Index (TCI) combined with VCI to obtain a vegetation health index (VHI) as an indicator of drought. This could have easily aided to accurately assessed the impacts of vegetation health condition on crops yield which is lacking in this study. This study focussed on simplicity of use of inputs and analysis method to produce quick drought indicative results.
Moreover, this study did not tackled the effects of environmental factors such as insects, soil salinity, diseases and lack of nutrients in the soil or anything that stresses vegetation and plant growth. The authors assumed that all of the variations in the VCI and NDVI are due to soil moisture and variations in vegetation green reflectance because detailed data on insect and disease outbreaks are not available.
2.2.3. Data analyses
To understand the relationship between spectral indices and crop yield, we conducted correlation analyses for different variables (). The main idea here was to see which of the selected food crops best reflects abrupt variation in NDVI and VCI in Ethiopia.
Table 1. Drought classification schemes using drought indices (Kogan Citation1995; Bhuiyan and Kogan Citation2010).
Table 2. Agricultural drought risk classification using NDVI anomaly (Legesse and Suryabhagavan Citation2014).
Table 3. Agricultural drought indices and their associated classes.
The coefficients of determination between yearly mean NDVI and crop yield data were calculated for the study period (2003–2015). Agricultural drought was then analyzed using NDVI standard deviation and the VCI. The value of VCI around 50% indicates fair or normal vegetation condition, while a value of VCI ≤ 35% is depicted as an extreme drought event (Kogan et al. Citation2003). Positive NDVI values indicating vegetation health range from 0.1 to 0.7, while low values (below 0.5) indicate poor vegetation conditions and the possible prevalence of drought conditions. However, NDVI values greater than 0.5 indicate healthy vegetation conditions (Prathumchai et al. Citation2001).
2.2.4. Relationship between seasonal and annual NDVI anomaly with crop yields
Statistical techniques such as Pearson Product Moment Correlation (PPMC) and Simple regression models were applied to explore the effect of the temporal variation of each parameter (NDVI, VCI and crops). The PPMC indictates the strength and direction of a linear relationship between two variables (for example model outputs and observed values). The relationship between two sets of variables X (independent) and Y (dependent) is assessed using PPMC, following the formula below:
Where r = Pearson Correlation Coefficient between X and Y; ∑ X = Sum of the data in X distribution; ∑ Y = Sum of the data in Y distribution; ∑ XY = Sum of the product of X and Y; ∑ X2 = Sum of the squared X; ∑ Y2 = Sum of the squared Y; (∑ XY)2 = Squared product of sum∑ X and ∑ Y; n = Number of pairs of the measurement. The r-value at the most can range from −1 to +1: Value from ± 0.0 to ± 0.20 is a negligible relationship; ± 0.21 to 0.40 is a weak relationship; ± 0.41 to ± 0.60 is a moderate relationship; ± 0.61 to ± 0.80 is a strong relationship; ± 0.81 to 0.99 is a very high relationship, while an r value of ± 1 is a perfect relationship (Thomas Citation1984).
The simple linear regression model was utilized to statistically characterize the variations (annual and seasonal) of NDVI, VCI and that of the selected crops. Regression analysis displays the conditional probability distribution of y given x (West Citation2012). The simple linear regression was represented as the square of the Pearson correlation coefficient (R2), known as the coefficient of determination. R2 describes how much of the variance between the two variables is described by the linear fit.
2.2.5. Evaluation techniques for determination of model efficiency
The findings of Willmott (1981) indicated that the correlation coefficient, r (Pearson’s product-moment correlation coefficient) can be a misleading measure of accuracy. Willmot observed the correlation coefficient to be very dissimilar when comparing the model-predicted variables and the observed ones. Willmott (Citation1982) proposed an ‘index of agreement (d)’ after assessing the drawbacks of ‘r’ and ‘R2’. He noted that the index ‘d’ is intended to be a descriptive measure, and recommendable for cross-comparisons between models. However, Ali and Abustan (Citation2014) observed the index of agreement (d) to be a non-reliable indicator to predict model efficiency due to the dissimilarities observed in its outputs. For model-estimated variables and observed data, the d can approach 1, but display a lower value for nearly similar data sets.
To tackle these deficiencies found in (d), Willmott and Matsuura (Citation2006), suggested Mean absolute error (MAE). But after assessing the MAE along with others indices, (Ali and Abustan Citation2014), discovered that MAE does not tell much about the level or degree of error. The PMARE was then proposed by Ali and Abustan (Citation2014), to overcome the deficiencies of the r, d, MAE, RMSE. The PMARE is based on a similar principle of MAE but only focus on observed data. The author concluded by insisting on the use of PMARE for model evaluation as it is more consistent, robust, descriptive (clear interpretative), and display a logical behaviour.
Three statistical techniques were adopted to evaluate the model performance in this study. The coefficient of determination (R2), root mean square error (RMSE), mean absolute error (MAE), relative error (RE) of Loague and Green (Citation1991) and Bellochi et al. (Citation2002). Percent mean absolute relative error (PMARE) proposed by Ali and Abustan (Citation2014) and the index of agreement (d) by Willmott (Citation1981), which ranges from 0 to 1. The RMSE quantifies the dispersion between the predicted model outputs and the observed values. Preferably, the value of MAE and RMSE should be zero. This study follows the designation of d by Eze et al. (Citation2020); Clarke (2017) and Li et al. (Citation2017) viz: ‘excellent’ – (d > 0.9); ‘good’ – (0.8 ≤ d < 0.9), ‘moderate’ – (0.7 ≤ d < 0.8), and ‘poor’ – (d < 0.7). The RE may vary from 0 to positive infinity. The smaller the RE, the better the model performance. PMARE value ranges from 0% to ∞ (positive infinity). The interpretation and characterization of the PMARE proposed by Ali and Abustan (Citation2014) (see ) below.
Table 4. The performance rating for model evaluation based on PMARE (Ali and Abustan Citation2014).
3. Results
3.1. Analysis of agricultural drought severity using remotely-sensed drought indices
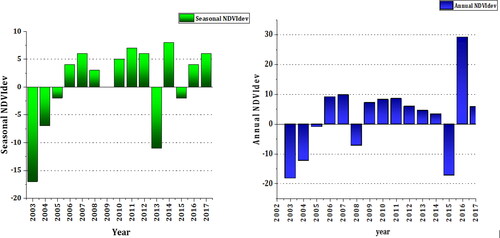
Spatio-temporal variation of agricultural drought patterns and severity were analyzed using average annual NDVI, average seasonal NDVI (see ), average annual VCI and seasonal VCI () and NDVI anomaly for belg, kiremt and dry season (see in the appendice). The average annual NDVI and seasonal NDVI, NDVI anomaly as well as the seasonal VCI were all calculated the entire year starting from 2003 to 2017. The same was applied for the growing season, first for belg season from March to May), then for kiremt season (June to September). shows the drought severity classes for the annual NDVI anomaly ranging from (No drought to moderate drought), while VCI-detected drought ranges from no drought to extreme drought for the 2003–2017 time series. However, a slight increase in annual and seasonal NDVI values were observed between 2003 to 2017 (see ).
Figure 2. Variation of mean annual and seasonal NDVI from 2003 to 2017.
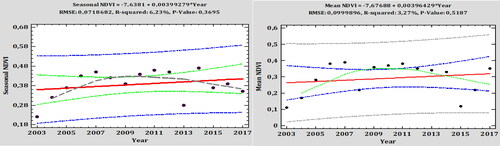
Figure 3. Variation of seasonal and annual variation of VCI from 2003 to 2017.
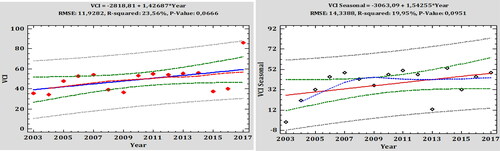
Table 5. Annual agricultural drought characteristics in Ethiopia from 2003 to 2017.
below shows the temporal variation of annual and seasonal VCI. The analysis of these parameters shows a positive increment of the vegetation health condition from 2003 to 2017. However, this positive increment was highly influenced by the subsequent drought event that hit Ethiopia since 2003 (see in the appendix). For instance, the 2015/16 drought event highly impacted the vegetation as shown in .
The analysis of the seasonal NDVI and seasonal VCI showed the same result with a few differences (see ).
Table 6. Seasonal vegetative drought characteristic in Ethiopia from 2003 to 2017.
3.2. Relationship between seasonal NDVI and crop yields
NDVI was significantly related to teff and maize in all ecological zones at 95% confidence level (p < 5%) with a coefficient of determination (R2) of 0.45 and 0.43 for teff and maize respectively (see ). This means that 45% and 43% yield variability of respectively teff and maize can be explained by the variation in NDVI values. This relationship is also confirmed by the strong correlation between these variables with high coefficencies of correlation (r = 0.64) and (r = 0.66) for maize and teff respectively, and moderate correlation with haricot beans (r = 0.53). On the contrary, a weak non-significant relationship was observed between NDVI and the yield of sweet potato (R2= 0.127), haricot beans (R2= 0.27), and taro (R2= 0.121).
The interannual variation of NDVI using heatmap analysis, showed that the lowest value of NDVI for Belg season (short rainy season) was observed in 2004 followed by 2003 with a value ranging between (0.25 to 0.3) and the highest NDVI value been 0.40 (see in the appendix). The lowest value of NDVI for Kiremt (the longest rainy season) was observed in 2003 (0.26) and the highest value of NDVI recorded in 2006 (0.44) (see in the appendix). As for the dry season, the value of NDVI ranges between (0.27 and 0.34), while the average annual NDVI value ranges from (0.28 to 0.38).
The heatmap analysis of NDVI deviation of belg season showed a severe drought observed in 2004 during belg season, and in 2004 for Kiremt season by NDVI deviation for kiremt season. The anomaly for dry season display a severe drought during dry season consecutively from 2003, 2004 and 2005 (see and in the appendix. The lowest values of NDVI value were observed during the dry season, which was also depicted on the value of NDVI deviation of the dry season of the year 2003 and 2004. NDVIdeviation shows negative values of NDVI from 2005 to 2017 (see ).
Figure 4. Heatmap analysis of Seasonal (a), NDVI deviation, (b) and influence of NDVI on crop yields, (c) from 2003 to 2017.
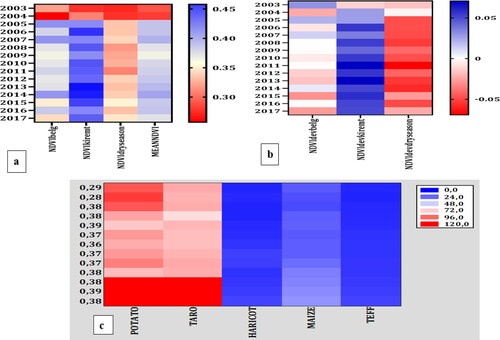
Figure 5. Dynamics of annual and seasonal NDVI deviation from 2003 to 2017.
3.2.1. Relationship between average annual VCI and crop yield
The VCI was significantly strongly related to teff (r = 0.65) and maize (r = 0.64), and moderately related to haricot beans yields (r = 0.51) in all ecological zones. Also, the VCI explains about 51%, 53% and 27% of teff, maize and haricot beans yield variation respectively (see and ). On the contrary, no significant relationship was found between VCI and the yield of sweet potato, taro and haricot beans.
Table 7. Summary of the linear regression statistics between NDVI and crop yield.
Table 8. Pearson’s correlation between annual NDVI, VCI and crop yield for the period 2003–2015.
3.2.2. Relationship between NDVI anomaly, VCI and crop yield
The relationships between NDVI anomaly and crop yield shows a positive but weak correlation between NDVI anomaly and crop yields (). Seasonal VCI and crop yields present a weak and negative correlation with maize, sweet potato and taro.
Table 10. Statistical evaluation of the linear regression model estimated values of drought parameters (a) and crops yields (b).
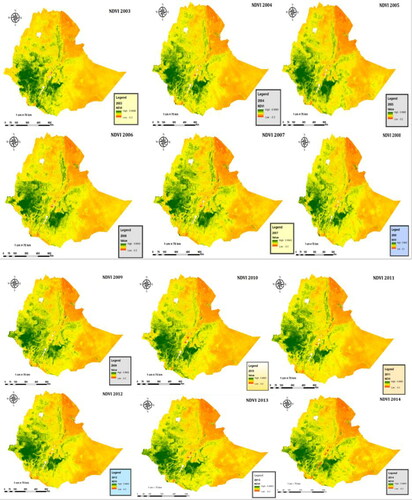
The annual cycle of vegetation in Ethiopia is directly influenced by the rainfall regime. Since crop production is a function of rainfall, crop failure or reduction in crop yield is often associated with rainfall deficiency or moisture deficit or agricultural drought. The analysis of both average annual NDVI anomaly and average seasonal NDVI anomaly clearly showed that during the monsoon year 2003, 2004, 2005, 2008, 2013, 2015, Ethiopia experienced continuous drought spell which ultimately led to moisture-stress on and food crops ( and below). figures () displayed a positive increment in the NDVI for Belg, Kiremt and Mean annual NDVI from 2003 to 2017. The heatmap analysis of crop yield for the given NDVI mean values from 2003 to 2017, indicated that the lower the NDVI value the greater the lost in crop yield (see in the appendix) below display the spatial and temporal dynamics of annual NDVI in Ethiopia from 2003 to 2017.
Figure 6. Inter-annual variability of seasonal NDVI with major crops yield from 2003 to 2015.
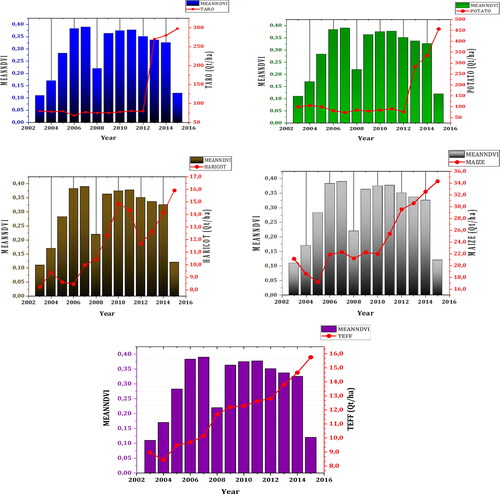
Figure 7. Dynamics of NDVI in Ethiopia from 2003 to 2017.
Increase in teff, maize and haricot beans yields are well represented by increase in NDVI and VCI values during the studied period (2003–2015). A stationary trend was observed for taro from 2003 to 2012, and 2003 to 2011 for sweet potato before a positive increment was observed for both crops. However, although the drought of 2015 did not have any effect on taro yield, it affected the yield of sweet potato.
From findings of this study, inter-annual variability of monthly NDVI are more related to cereals (teff, maize), and leguminous plant (Haricot beans) and very little relationship with tubers (taro, sweet potato).
3.2.3. Model performance evaluation
The summary of statistical evaluations of the linear regression model predicted and observed values of the drought parameters are presented in . A high value of R2 was observed for teff, maize and haricot beans. The variation in yield of teff, maize and haricot beans is explained at 96%, 88% and 79% respectively by the interannual variability of vegetative drought. However, a very low value of the index of Agreement (d) was observed for all the elements, except for haricot beans.
4. Discussion
4.1. NDVI and VCI trends
This study observed a significant increase in the annual and seasonal NDVI values, this shown. The results are consistent with several studies that have come to the same conclusion of NDVI increasing in many places including arid regions (Nemani et al. Citation2003; Young and Harris Citation2005; Fensholt et al. Citation2012), Eurasia (Piao Citation2003, Piao et al. Citation2006; Li et al. Citation2012), South and North America (Slayback et al. Citation2003; Baldi et al. Citation2008), Australia and in the Sahel region (Herrmann et al. Citation2005; Olsson et al. Citation2005). A study done by Kogan (Citation1997) in South America, Africa, Asia, North America and Europe, particularly during the critical periods of crops growth, found a strong correlation between VCI and crop yields. The author found in some regions of Argentina, a correlation between corn yield and VCI as high as 0.92
Dabrowska-Zielinska et al. (Citation2002) tested the suitability of the VCI and Temperature Condition Index (TCI) for modelling crop yield models in Poland and found TCI slightly performant compare to VCI in modelling crop yield in Poland due to a difference in the mean error of 4% between the studied models.
Previous studies have explained the largest increase in NDVI, mostly occurring in the early growing season, by the increase in temperature (Myneni et al. Citation1997; Zhou et al. Citation2001; Hickler et al. Citation2005). On the contrary, other studies indicate that temperature variation has a weak or no effect on NDVI (Nicholson et al. Citation1990; Wang et al. Citation2003; Mendez-Barroso et al. Citation2009; Zhao et al. Citation2011). However, some studies also suggest that only precipitation and evapotranspiration are positively correlated with NDVI and concluded that precipitation is the key cause of vegetation growth (Mendez-Barroso et al. Citation2009; Zhao et al. Citation2011).
Drought severity ranges from ‘no drought ‘to ‘moderate drought’ for the annual NDVI anomaly, while VCI-detected drought ranges from ‘no drought’ to ‘extreme drought’ for the 2003–2017 time series. The analyses of the seasonal NDVI and seasonal VCI showed the same result with a small variation. Zambrano et al. (Citation2016) reported that VCI is a good indicator of drought, with the promise of accurately identifying affected stakeholders in a drought and improving drought emergency response, especially in the absence of local observations. However, this study strongly disagrees with the findings of Bajgiran et al. (Citation2008), who found VCI as unreliable for agricultural drought prediction and detection in Northwest Iran. The inadequate temporal evaluation limited to five years may be to blame for their results, thus, the number of years is quite low for making a firm and relevant decision on the applicability of the VCI as a drought-assessement indicator.
4.2. Relationship of spectral indices and yield of major rainfed crops
Following a strong association of NDVI with rainfall as also confirmed by Richard and Poccard (Citation2010); Lamchin (Citation2004); Martiny et al. (Citation2006), the NDVI can serve as a reliable proxy evaluation of inter-annual variability of the climatic system, with rainfall considered as a crucial climatic factor in vegetative growth. NDVI is considered among the most reliable vegetation index of greenness, with a strong correlation of biomass, which is also an indicative of growth.
The positive correlations between anomalies of NDVI and values of rainfall portray the positive response of photosynthetic activity to rainfall. A positively-inclined linear relationship between NDVI and rainfall is reported in earlier studies (Lamchin Citation2004; Li et al. Citation2004; Richard and Poccard Citation2010). In another twist, a decrease in vegetation cover led to a decrease in the rainfall pattern (Batool et al. Citation2015). Thus, agricultural drought is inversely related to the amount of precipitation received by an area, which in turn, influences the vegetation health condition and translates to the productivity of crops directly (Martiny et al. Citation2006). Moreover, NDVI measures the state and health of crops and has a high correlation with crop yield, which means it can be used as a tool for measuring crop productivity and predicting future yield.
In some cases, these relatonships and their related impacts tend to last longer than expected. For example, the 2003/2004 agricultural drought that hit Ethiopia persisted in districts such as Yalo and Gulina, northern Ethiopia for about 6 years (2004–2009) and was recorded as one of the highest drought periods during the last 15 years (Gidey Citation2018). The same study indicated that the longest and severe drought episodes have the most negative impacts on the livelihood of the community.
To evaluate agricultural drought, different indices were used (long-term annual average NDVI, seasonal NDVI, NDVI anomaly and VCI). Also, Pearson’s correlation and linear regression were applied to analyze the patterns of crop yields with the change agricultural drought indices for the period 2003 and 2015. The average annual NDVI was significantly related to teff and maize in all ecological zones at a 95% confidence level (p < 5%) with R2 of 0.45 and 0.43 for teff and maize, respectively. This means that 45% and 43% yield variability of respectively teff and maize can be explained by the variation in NDVI values. This relationship is also ascertained by the good correlation between these variables with (r = 0.64) and (r = 0.66) for maize and teff, respectively.
On the contrary, a weak non-significant relationship was found between NDVI and the yield of sweet potato (R2= 0.127), and taro (R2= 0.121). Furthermore, haricot beans yield showed moderate but not significant correlation with NDVI, weak and not significant relationship with sweet potato and taro. The relationships between NDVI anomaly and crop yield showed a positive but weak correlation. A weak and negative correlation was found between VCI and crop yields, specifically with maize, sweet potato and taro. Thus, seasonal VCI has also a small influence on the yield of sweet potato, taro and maize. Sweet potato and taro have been previously reported to be drought-resistant crops (Woolfe Citation1992; Onwoume and Charles Citation1994).
The effect of agricultural drought on crop yields is also influenced by the period of growing season at which the drought occurred, the type of plant or crop, its growth habit and vegetative phase. Monneveux et al. (Citation2013), indicated that root/tuber crops such as taro and sweet potato generally experience greater yield loss when drought events ‘occurred during their tuber initiation (mid-season drought) and their tuber enlargement or bulking (late-season drought) than during their vegetative growth (early season drought)’. In a study by Hatfiel and Prueger (Citation2010) using corn, soybean, wheat, and canola, results show that when crops increase their leaf area index (LAI), their NDVI becomes saturated and consequently, become less sensitive to change in vegetative development. Hence, increment in NDVI becomes inconsequential at saturation point.
From the evaluation of models, the low value of the index of agreement (d) might have been influenced by the low value of NDVI mean, NDVI anomaly and seasonal NDVI, which values were close to zero. Since d and r are not always consistent and logical for all cases (due to ambiguity, conflicting performance rating), these indices should be avoided from model performance measures (Ali and Abustan Citation2014). PMARE indicated a very good magnitude for the short season (belg) NDVI (9.53%) and the dry season NDVI (10%), indicating a better model simulation. A good magnitude was observed for the NDVI mean (12.61%), fair magnitude for haricot beans (18.2%) and teff (18.8%). On the contrary, VCI for taro, sweet potato model rating was unsatisfactory (>25%) (). Additionnally, the PMARE values for taro and sweet potato were all beyond the practical/acceptable range (0 < PMARE < 100).
The finding from this study confirms that NDVI and VCI can be used to understand drought patterns in Ethiopia as previously reported (Legesse and Suryabhagavan Citation2014). NDVI and VCI not only aids the description of land cover using spatial and temporal vegetation changes, but also support the quantification of the impact of weather on vegetation and crop productivity (Legesse and Suryabhagavan Citation2014; Gidey Citation2018). The strength of the indexes to explain the existence of agricultural drought through agricultural yield is relatively good. It is hoped that our efforts at the determination of the relationships between vegetation indices and crop yields for the whole of Ethiopia will avail useful insights for agricultural drought risk management policies. This shows that vegetation in general, and crops productivity, in particular, are responsive to change in NDVI values, which is also highly influenced by annual and seasonal precipitation.
5. Conclusions
This study analyzed the relationship of NDVI and VCI with selected crops’ yields for the period 2003–2015. The studied crops comprise cereals (maize, teff), leguminous (haricot beans) and tubers (sweet potato and taro). From the study, yield of crops such as maize, teff, and haricot beans are positively correlated to the annual average NDVI, seasonal NDVI, NDVI anomaly, and annual VCI. However, a very weak negative correlation was observed between maize, taro and sweet potato and the seasonal VCI. This can be explained by the strong correlation between VCI and precipitation and its ability to easily detect unfavorable environmental conditions. NDVI is not only influenced by precipitation but other prevalent factors capable of influencing the vegetation include soil characteristics, the stress in previous years and land cover characteristics of the area. While phenologic considerations do suggest that seasonal VCI should be more representative of crop performance than the annual average NDVI, NDVI anomaly, and annual VCI, the results presented in this study show slight differences between the seasonal and annual NDVI. Interestingly, the performance of the seasonal integrated NDVI and VCI and that of the crop yield or crop performance only showed a strong and positive correlation for teff and maize. Such variations in vegetation indices are helpful for the recognition of the effects of climatic factors on local vegetation and particular types of crops. From findings of this study, changes in the NDVI values are more reflected in cereals and leguminous plants than tubers. Future government programmes and drought preparedness initiatives should pay more attention to the cultivation of maize, haricot beans and teff as they are more sensitive to drought. In face of drought, the farming communities should be encouraged to cultivate tubers and other drought resilients crops such as sweet potato (Ipomoea batatas) and taro (Colocasia esculenta), cassava (Manihot esculenta) or yam (Discorea).
Further research on a national scale is required for assessment of annual, seasonal and monthly variations using more holistic vegetation health indice such as VHI and VegDRI and their potential impacts on crop yields is necessary to extend the findings of this study. Inclusion of data on the socio–economic impacts of drought to clarify factors of improved livelihood on drought-prone communities should be pursued in future studies.
Acknowledgements
This study was conceptualized as part of the European Union-funded Intra-ACP Academic Mobility Scheme “Trans-disciplinary Training for Resource Efficiency and Climate Change Adaptation in Africa” (TreccAFRICA) initiative. We are grateful to the Central Statistical Agency for providing us with national average agricultural yield data. Finally, we want to express our gratitude to the Ethiopian Institute of Climate and Society of Mekelle University for all their assistance.
Disclosure statement
The authors declare no conflict of interests.
Table 9. Correlation matrix between crop yield and NDVI anomaly from 2003 to 2015.
Data availability statement
The data that support the findings of this study are available from the corresponding author, [Kourouma, J.M], upon reasonable request.
References
- Abebe T, Sterck FJ, Wiersum KF, Bongers F. 2013. Diversity, comosition and density of trees and shrubs in agroforestry homegardens in Southern Ethiopia. Agrofor Syst. 87:1283–1293.
- Abera K, Crespo O, Seid J, Mequanent F. 2018. Simulating the impact of climate change on maize production in Ethiopia, East Africa. Environ Syst Res. 7(1):1-12.
- Al-Bakri JT, Suleiman AS. 2004. NDVI response to rainfall in different ecological zones in Jordan. Int J Remote Sens. 25(19):3897–3912.
- Alemayehu A, Bewket W. 2016. Vulnerability of smallholder farmers' to climate change and variability in the central highlands of Ethiopia. EJSSH. 12(2):1–24.
- Ali MH, Abustan I. 2014. A new novel index for evaluating model performance. J Natural Res Dev Band. 4:1–9.
- Bajgiran PR, Darvishsefat AA, Khalili A, Makhdoum MF. 2008. Using AVHRR based vegetation indices for drought monitoring in the Northwest of Iran. J Arid Environ. 72(6):1086–1096.
- Baldi G, Nosetto MD, Aragón R, Aversa F, Paruelo JM, Jobbágy EG. 2008. Long-term satellite NDVI Data Sets: evaluating their ability to detect ecosystem functional changes in South America. Sensors (Basel). 8(9):5397–5425.
- Batool A, Ziaf K, Amjad M. 2015. Effect of halo-priming on germination and vigor index of cabbage (Brassica oleracea var. capitata). Journal of environmental and Agricultural Sciences. 2(7):8.
- Bellochi G, Acuit M, Fila G, Donatelli M. 2002. An indicator of solar radiation model performance based on a fuzzy expert system. Agron. J. Band 94:1222–1233.
- Bhuiyan C, Kogan FN. 2010. Monsoon variation and vegetative drought patterns in the Luni Basin under Rain-Shadow Zone. Int J Remote Sensing. 31(12):3223–3242.
- Bobojonov I, Aw-Hassan A, Sommer R. 2014. Index-based insurance for insurance for insurance for climate risk management and rural development in Syria. Climate and Development. 6(2):166–178.
- Boken VK. 2009. Improving a drought early warning model for an arid region using a soil-moisture index. Appl Geogr. 29(3):402–408.
- Bokusheva R. et al. 2016. Satellite-based vegetation health indices as a criteria for insuring against drought-related yield losses. Agricultural and Forest Meteorology, Band 220:200–206.
- Box JE. 2005. Greenland ice sheet surface massbalance variability: 1991-2003. Ann Glaciol. 42:90–95.
- Brown JF, Wardlow BD, Tadesse T, Hayes MJ, Reed BC. 2008. The Vegetation Response Index (VegDRI): a new integrated approach for monitoring drought stress in vegetation. GISci Remote Sensing. 45(1):16–46.
- Chopra P. 2006. Drought risk assessment using remote sensing and GIS: A case study of Gujarat [MSc thesis]. Enschede: University of ITC.
- Conway D, Schipper E. 2011. Adaptation to climate change in Africa: challenges and opportunities identified from Ethiopia. Global Environ Change. 21(1):227–237.
- CSA. 2004. Central Statistical Agency, Agricultural Sample Survey 2003/2004, Vol. 1: area and production of major crops. Addis Ababa: Central Statistical Agency, Federal Democratic Reublic of Ethiopia.
- CSA. 2016. Central Statistical Agency, Agricultural Sample Survey 2015/2016, Vol. 1: area and production of major crops. Addis Ababa: Central Statistical Agency, Federal Democratic Republic of Ethiopia.
- Dabrowska-Zielinska K, Kogan F, Ciolkosz A, Gruszczynska M, Kowalik W. 2002. Modeling of crop growth conditions and crop yield in Poland using AVHRR-based indices. Int J Remote Sensing. 23(6):1109–1123.
- Du L. 2017. Ecological drought characteristics and analysis of driving factotrs of different ecological zones in Ningxia from 2000 to 2010. J Nat Disasters. 26.
- Du L, Tian Q, Yu T, Meng Q, Jancso T, Udvardy P, Huang Y. 2013. A comprehensive drought monitoring method integrating MODIS and TRMM data. Int J Appl Earth Obs Geoinf. 23:245–253.
- Eze E, et al. 2020. Exploring the possibilities of remote yield estimation using crop water requirements for area yield index insurance in a data-scarce dryland. Journal of Arid Environments. Band 183:104–261.
- FAO. 2020. Drought & agriculture, s.l. Roma, Italy: FAO.
- Fensholt R, Langanke T, Rasmussen K, Reenberg A, Prince SD, Tucker C, Scholes RJ, Le QB, Bondeau A, Eastman R, et al. 2012. Greenness in semi-arid areas across the globe 1981-2007. An earth observing satellite based analysis of trends and drivers. Remote Sens Environ. 121:144–158.
- Gebre AB, Birhane E, Gebresamuel G, Hadgu KM, Norgrove L. 2019. Woody secies diversity and carbon stock under different land use tyes at Gergera watershed in Eastern Tigray. Agroforest Syst. 93(3):1191–1203.
- Gebrehiwot K, Muys B, Haile M, Mitloehner R. 2003. Introducing Boswellia papyrifera (Del.) Hochst and its non-timber forest product, Frankincense. Int For Rev. 5(4):348–353.
- Gedif B. 2014. Drought risk assessment using remote sensing and GIS: The case of southern zone, Tigray Region, Ethiopia. J Natural Sci Res. 4(23):2224–2318.
- Gidey E. 2018. Analysis of the long-term agricultural drought onset, cessation, duration, frequency, severity and spatial extent using Vegetation Health Index (VHI) in Raya and its environs, Northern Ethiopia. Environ Syst Res. 7(13):2–18.
- Gissila T, Black E, Grimes D, Slingo J. 2004. Seasonal forecasting of the Ethiopian summer rains. Int J Climatol. 24(11):1345–1358.
- Gitelson AA, Kogan F, Zakarin E, Spivak L, Lebed L. 1998. Using AVHRR data for quantitative estimation of vegetation conditions: calibration and validation. Adv Space Res. 22(5):673–676.
- Gleixner S, Keenlyside N, Viste E, Korecha D. 2017. The El Nino effect on Ethiopian summer rainfall. Clim Dyn. 49(5–6):1865–1883.
- Gu Y, Brown JF, Verdin JP, Wardlow B. 2007. A five-year analysis of MODIS NDVI and NDWI for grassland drought assessment over the central Great Plains of the United States. Geophys Res Lett. 34.
- Hatfield JL, Prueger JH. 2010. Value of using different vegetative indices to quantify agricultural crop characteristics at different growth stages under varying management practices. Remote Sensing. 2(2):562–578.
- Heidinger AK, Anne VR, Dean C. 2002. Using MODIS to estimate cloud contamination of the AVHRR data record. J Atmos Oceanic Technol. 19(5):586–601.
- Herrmann SM, Anyamba A, Tucker CJ. 2005. Recent trends in vegetation dynamics in the African Sahel and their relationship to climate. Glob Environ Change. 15(4):394–404.
- Hickler T, Eklundh L, Seaquist JW, Smith B, Ardö J, Olsson L, Sykes MT, Sjöström M. 2005. Precipitation controls Sahel greening trend. Geophys Res Lett. 32(21):32.
- Jain SK, Keshri R, Goswami A, Sarkar A. 2010. Application of meteorological and vegetation indices for evaluation of drought impact: a case study for Rajasthan, India. Nat Hazards. 54(3):643–656.
- Ji L, Peters AJ. 2003. Assessing vegetation response to drought in the northern Great Plains using vegetation and drought indices. Remote Sens Environ. 87(1):85–98.
- Johnson GE, Achutuni VR, Thiruvengadachari S, Kogan FN. 1993. The role of NOAA satellite data in drought early warming and monitoring: selected case studies. Chapter 3. In: Wilhite DA, editor. Drought assessment, management, and planning: theory and cases studies. New York, NY: Kluwer Academic Publishers; p. 31–48.
- Jury MR, Funk C. 2013. Climatic trends over Ethiopia: regional signals and drivers. Int J Climatol. 33(8):1924–1935.
- Justice C, Townshend J. 2002. Secial issue on the moderate resolution imaging spectroradiometer (MODIS): a new generation of land surface monitoring. Remote Sens Environ. 83(1–2):1–2.
- Kaluski DN, Ophir E, Amede T. 2002. Food security and nutrition - the Ethiopian case for action. Public Health Nutr. 5(3) 373-381.
- Kogan F, Gitelson A, Zakarin E, Spivak L, Lebed L. 2003. AVHRR-based spectral vegetation for quantitative assessment of vegetation state and productivity: calibration and validation. Photogramm Eng Remote Sensing. 69(8):899–906.
- Kogan FN. 1995. Application of vegetation index and brightness temperature for drought detection. Adv Space Res. 15(11):91–100.
- Kogan FN. 1997. Global drought watch from space. Bull Am Meteor Soc. 78(4):621–636.
- Lamchin M. 2004. Monitoring of vegetation dynamics in the Mongolia using MODIS NDVI and their relationship to rainfall by natural zone. J. Indian. Soc. Remote. Sens. 43(2):325–337.
- Legesse G, Suryabhagavan K. 2014. Remote sensing and GIS-based agricultural drought assessment in East Shewa Zone, Ethiopia. J Trop Ecol. 55:349–363.
- Leprieur C, Kerr YH, Mastorchio S, Meunier JC. 2000. Monitoring vegetation cover across semiarid regions: comparison of remote observations from various scales. Int J Remote Sens. 21(2):281–300.
- Li J. et al. 2004. Evaluation of land performance in Senegal using multi-temporal NDVI and rainfall series. Journal of Arid Environment. 59(3):463–480.
- Li Y, Yu R, Shahabi C, Liu Y. 2017. Diffusion convolutional recurrent neral network: Data-driven traffic forecasting. arXiv preprint arXiv.
- Li A, Wu J, Huang J. 2012. Distinguishing between human-induced and climate-driven vegetation changes: a critical application of RESTREND in inner Mongolia. Landscape Ecol. 27(7):969–982.
- Loague K, Green RE. 1991. Statistical and graphical methods for evaluating solute transport models: overview and application. J Contam Hydrol. 7(1–2):51–73.
- Magno R, Angeli L, Chiesi M, Pasqui M. 2014. Prototype of a drought monitoring and forecasting system for the Tuscany region. Adv Sci Res. 11(1):7–10.
- Martiny N, Camberlin P, Richard Y, Philippon N. 2006. Compared regimes of NDVI and rainfall in semi-arid regions of Africa. Int J Remote Sens. 27(23):5201–5223.
- Mendez-Barroso LA, Vivoni ER, Watts CJ, Rodriguez JC. 2009. Seasonal and interannual relation between precipitation, surface soil moisture and vegetation dynamics in the North American monssoon regional. J Hydrol. 377(1–2):59–70.
- Mishra AK, Ines AVM, Das NN, Prakash Khedun C, Singh VP, Sivakumar B, Hansen JW. 2015. Anatomy of a local-scale drought: application of assimilated remote sensing products, crops model, and statistical methods to an agricultural drought study. J Hydrol. 526:15–29.
- MOA. 2019. Transforming Ethiopia agriculture: PowerPoint presentation, briefing for agricultural scholar consultative forum. Addis Ababa: MOA.
- Monneveux P, Ramirez DA, Pino MT. 2013. Drought tolerance in potato (S. tuberosum L.): can we learn from drought tolerance research in cereals? Plant Sci. 205–206:76–86.
- Mulugeta S, Fedler C, Ayana M. 2019. Analysis of long-term trends of annual and seasonal rainfall in the Awash River Baser Ethiopia. Water. 11(7):1498.
- Muthumanickam D, Kannan P, Kumaraperumal R, Natarajan S, Sivasamy R, Poongodi C. 2011. Drought assessment and monitoring through remote sensing and GIS in western tracts of Tamil Nadu, India. Int J Remote Sensing. 32(18):5157–5176.
- Myneni RB, Keeling CD, Tucker CJ, Asrar G, Nemani RR. 1997. Increased plant growth in the northern high latitudes from 1981 to 1991. Nature. 386(6626):698–702.
- Negash E, Gebresamuel G, Embaye T‐a, Nguvulu A, Meaza H, Gebrehiwot M, Demissie B, Gebreyohannes T, Nyssen J, Zenebe A. 2020. Impact of headwater hydrological deficit on the downstream flood-based farming system in Northern Ethiopia. Irrig Drain. 69(3):342–351.
- Negash E, Gebresamuel G, Embaye TA, Zenebe A. 2019. The effect of climate and land-cover changes on runoff response in Guguf spate systems northern Ethiopia. Irrig Drain. 68(3):399–408.
- Nemani RR, Keeling CD, Hashimoto H, Jolly WM, Piper SC, Tucker CJ, Myneni RB, Running SW. 2003. Climate-driven increases in global terrestrial net primary production from 1982 to 1999. Science. 300(5625):1560–1563.
- Nicholson SE, Davenport ML, Malo AR. 1990. A comparison of the vegetation response to rainfall in the Sahel and East-Africa, using normalized difference vegetation index from NOAA AVHRR. J Clim Change. 17(2–3):209–241.
- Nicholson SE, Farrar TJ. 1994. The influence of soil type on the relationship between NDVI, rainfall, and soil moisture in semi-arid Bostwanana: NDVI response to rainfall. Remote Sens Environ. 50(2):107–120.
- Olsson L, Eklundh L, Ardo J. 2005. A recent greening of the Sahel: trends, pattern and potential causes. J Arid Environ. 63(3):556–566.
- Onwoume I, Charles W. 1994. Tropical root and tuber crops. Rome: FAO.
- Patel NR. 2009. Assessing potential of MODIS derived Temperature/Vegetation Condition Index (TVDI) to infer soil moisture status. Int J Remote Sens. 30:23-29.
- Patel NR, Parida BR, Venus V, Saha SK, Dadhwal VK. 2012. Analysis of agricultural drought using Vegetation Temperature Condition Index (VTCI) from Terra/MODIS satellite data. Environ Monit Assess. 184(12):7153–7163.
- Piao S. 2003. Interannual variations of monthly and seasonal normalized difference vegetation index (NDVI) in China from 1982 to 1999. J Geophys Res. 108(D14):4401.
- Piao S et al. 2003. Interannual variations of monthly and seasonal normalized difference vegetation index (NDVI) in China from 1982 to 1999. Journal of Geophysical Research.108(D14):4401.
- Piao S, Wang X, Ciais P. 2006. Changes in satellite-derived vegetation growth trend in temperate and boreal Eurasia from 1982 to 2006. Global Biolog Band. 17:3228–3239.
- Prathumchai K, Honda K, Nualchawee K. 2001. Drought risk evaluation using remote sensing and GIS: a case study in Lop Buri Province. 22nd Asian Conference on Remote Sensing, November 5–9, Singapore.
- Quiring SM, Ganesh S. 2010. Evaluating the utility of the Vegetation Condition Index (VCI) for monitoring meteorological drought in Texas. Agric For Meteorol. 150(3):330–339.
- Richard Y, Poccard I. 2010. A statistical study of NDVI sensitivity to seasonal and interannual rainfall variations in Southern Africa. Int. J. Remote Sens. 19(15):2907–2920.
- Roberts D, Roth K, Perroy R. 2011. Hyperspectral vegetation indices. In Thenkabail PS, Lyon JG (Ed.), Hyperspectral remote sensing of vegetation, CRC Press, Boca Raton, p. 309–327.
- Rojas O, Vrieling A, Rembold F. 2011. Assessing drought probability for agricultural areas in Africa with coarse resolution remote sensing imagery. Remote Sens Environ. 115(2):343–352.
- Segele Z, Lamb P. 2005. Characterization and variability of Kiremt rainy season over Ethiopia. Meteorol Atmos Phys. 89(1–4):153–180.
- Seleshi Y, Zanke U. 2004. Recent changes in rainfall and rainy days in Ethiopia. Int J Climatol. 24(8):973–983.
- Shanko D, Camberlin P. 1998. The effects of the Southwest Indian Ocean tropical cyclones on Ethiopian drought. Int J Climatol. 18(12):1378–1388.
- Slayback DA, Pinzon JE, Los SO, Tucker CJ. 2003. Northern hemisphere photosynthetic trends 1982-99. Global Change Biol. 9(1):1–15.
- Sruthi S, Aslam MA. 2015. Agricultural drought analysis using the NDVI and land surface temperature data: a case study of Raichur District. Aquat Procedia. 4:1258–1264.
- Thomas R. 1984. Notes and problems in statistics. Bath, UK: Stanley Thornes.
- Turvey CG, Mclaurin MK. 2012. Applicability of the normalized difference vegetation index (NDVI) in index-based crop insurance design. Weather, Climate, and Society. 4(4):271–284.
- Unganai LS, Kogan FN. 1998. Drought monitoring and corn yield estimation in Southern Africa from AVHRR data. Remote Sens Environ. 63(3):219–232.
- Ungani LS, Kogan FN. 1998. Drought monitoring and corn yield estimation in southern Africa from AVHRR data. Remote Sens. Environ. 63:219–232.
- Vicente-Serrano SM. 2007. Evaluating the impact of drought using remote sensing in a Mediterranean semi-arid region. Nat Hazards. 40(1):173–208.
- Viste E, Korecha D, Sorteberg A. 2012. Recent drought and precipitation tendencies in Ethiopia. Theoret Appl Climatol. 112(3-4):35–55.
- Wang J, Rich PM, Price KP. 2003. Temporal responses of NDVI to precipitation and temperature in the central Great Plains, USA. Int J Remote Sens. 24(11):2345–2364.
- West BJ. 2012. Fractal physiology and chaos in medicine. Danvers, USA: World Scientific.
- Willmott CJ. 1981. On the validation of models. Physical Geography, Band 2:184–194.
- Willmott CJ. 1982. Some comments on the evaluation of model performance. Bulletin of the American Meteorological Society, Band 63:1309–1313.
- Willmott CJ, Matsuura K. 2006. On the use of dimensioned measures of error to evaluate the performance of spatial interpolators. International journal of Geographical Information Science 20(1): 89–102.
- Wolfe RE, Nishihama M, Fleig AJ, Kuyper JA, Roy DP, Storey JC, Patt FS. 2002. Achieving sub-pixel geolocation accuracy in support of MODIS land Science. Remote Sens Environ. 83(1–2):31–49.
- Woolfe JA. 1992. Sweet potato: an untapped food resource. New York: Cambridge University Press.
- Wu H, Wilhite DA. 2004. An operational agricultural drought risk assessment model for Nebraska, USA. J Natural Hazards. 33(1):1–21.
- Young SS, Harris R. 2005. Changing patterns of global-scale vegetation photosynthesis. Int J Remote Sens. 26(20):4537–4545.
- Young SS, Harris R. 2005. Changing patterns of global-scale vegetation photosynthesis. International Journal of Remote Sensing. Band 26:4537–45-63.
- Zambrano F, Saavedra ML, Verbist K, Lagos O. 2016. Sixteen years of agricultural drought Assessment of the BioBio Region in Chile using a 250 m Resolution Vegetation Condition Index (VCI). J Remote Sensing. 8(6):530.
- Zhao X, Tan K, Zhao S, Fang J. 2011. Changing climate affects vegetation growth in the arid region of the northwestern China. J Arid Environ. 75(10):946–952.
- Zhou L, Tucker CJ, Kaufmann RK, Slayback D, Shabanov NV, Myneni RB. 2001. Variations in northern vegetation activity inferred from satellite data of vegetation index during 1981 to 1999. J Geophys Res. 106(D17):20069–20083.