
 ?Mathematical formulae have been encoded as MathML and are displayed in this HTML version using MathJax in order to improve their display. Uncheck the box to turn MathJax off. This feature requires Javascript. Click on a formula to zoom.
Abstract
This paper reports three methods of researching the geoelectric index (GEI) based on the ratio between the variation amplitude of geoelectric field on an index calculation day and that on a magnetically quiet day, and uses the three methods to process the observation data of 18 geoelectric stations in China in September 2017. Results showed that, each method has obtained 4096 single-station geoelectric indices D and 240 multi-station average geoelectric indices Ds, all 3-hour indices. Comparing the geoelectric indices with the geomagnetic indices of the 18 stations, it can be understood that: 87.35%–88.26% of indices D are the same with the single-station geomagnetic indices K or have only a difference of 1 from the indices K, and 97.08%–97.50% of indices Ds are the same with the multi-station average geomagnetic indices or have only a difference of 1 from the indices
The high consistency between two kinds of indices shows that the methods of calculating geoelectric index are practicable, and that the calculated indices D and Ds are reliable. The geoelectric field, as an independent observation, should have a criterion to judge the interference.
1. Introduction
The local spontaneous electric field was found by Fox in 1830, and then was gradually applied into the geophysical exploration (Кrаеv et al. Citation1950; Ward Citation1980). In 1946, the French scholars conducted the geoelectric current observation experiment in France and Madagascar, and reported the oscillation phenomenon of geoelectric current (Schlumberger and Kunetz Citation1946). At the same time, the Hungarian Academy of Sciences cooperated with the Chinese Academy of Sciences to observe the geoelectric current in Beijing-China and Sopron-Hungarian, and recorded the comparable telluric current variation at a large spatial scale (Kantas Citation1956). Up to now, researchers have recognized that the geoelectric field is the electric field distributed on the surface and underground resulting from the interaction of various kinds of non-artificial currents inside and outside the solid earth with the earth medium, and that the geoelectric field includes the telluric electric field and spontaneous electric field, the local electric field on the surface formed by physical and chemical actions is called spontaneous electric field. For example, the redox electric field of ore body. The telluric electric field includes the quiet variation and disturbance variation, the source of telluric electric field comes from space. The telluric electric field includes the quiet variation and disturbance variation, which periodic compositions are plentiful. The quiet variation mainly has the periodic components of 1 year, 1 month, half a month, 1 day and half a day etc, while the disturbance variation mainly has the disturbed daily variation (daily periodicity), micro variation (10−4s–1 s), pulsation (0.2 s–1000 s), bay disturbance (mostly lasting for 1–3 h) and geoelectric storm (mostly lasting for 1–3d) (Chapman and Bartels Citation1940; Кrаеv et al. Citation1950; Fu et al. Citation1985). The geoelectric field variation on a magnetically quiet day, named the ‘quiet daily variation’, daily appears in different geomagnetic days such as quiet day, disturbance day, etc., while the non-quiet daily variation has the multi-period fast disturbance variations of geoelectric field overlapped on the quiet daily variation. Meanwhile, researchers also paid attention that the quiet day variation shows the regional characters of responding to the earth tides (Johnston et al. Citation1983; Huang and Liu Citation2006; Кrаеv et al. Citation1950).
Usually, both the geoelectric disturbance and geomagnetic disturbance are from the same space field source. For a long time, people used the geomagnetic activity index to make quantitative evaluation on the disturbance level of the earth’s electromagnetic field (e.g. Bartels et al. Citation1939; Bartels Citation1949; Albertson et al. Citation1974; Pirjola et al. Citation1990; Sucksdorff et al. Citation1991; Menvielle et al. Citation1995; Bitterly et al. Citation2000; Xu Citation2003). According to the electromagnetic field theory, the geoelectric activity index also can be used to make quantitative evaluation on the disturbance level; Recently, it was realized that, the mutual compensation and reference of geoelectric disturbance index and geomagnetic activity index can identify the disturbance level more accurately. It will play an important role in monitoring and studying electromagnetic environment variation; meanwhile, the geoelectric index has been developed to apply in the fields of monitoring active tectonics and lifeline engineering damage prevention etc. (e.g. Albertson et al. Citation1974; Egbert Citation2002; Pirjola Citation2002; Zheng et al. Citation2013; Zhang et al. Citation2017a; Zhang et al. Citation2017b; Zhang and Du Citation2017c). Sun and Du (Citation2017) summarized the time and frequency characteristics of geoelectric disturbance variation in the Mainland China during the geomagnetic storm (herein called the ‘geoelectric storm’), and initially calculated the single-station geoelectric disturbance index D (i.e. 3-hour geoelectric index similar to the geomagnetic K index) of some geoelectric stations in China and their multi-station average index Ds (‘D’ herein refers to the initial of the Chinese pinyin of geoelectric field, and the lowercase letter ‘s’ means that the geoelectric disturbance is chiefly caused by the solar activity) using the method called the Geoelectrical Index (abbreviated as ‘GEI’) of Amplitude Ratio of Removing Quiet Diurnal Variation. In general, when magnetic storms occur, most of the stations are calculated the index should be the same or similar, while for the disturbances that occur near individual stations, they will only have an effect on the calculation of individual stations. Therefore, the purpose of introducing the Ds/ index in this paper is mainly to better evaluate the D&K index consistency in the calculation area. These two geoelectric indices have a good matching with the each single-station geomagnetic index K and the multi-station average geomagnetic index
that are provided by China’s Geomagnetic Network Center using the observation data of the geomagnetic stations in China. However, the calculation of the GEI still need improvement and development to be more reasonable and perfect.
In order to reduce the influence of erroneous data from individual stations such as random pulses present in the geoelectric field observations on the GEI, two attempted improvements are incorporated in this paper (Specific practices are described in Section 3.2). There are many studies on the response of geoelectric field to the disaster events such as earthquake, volcano, etc (Varotsos and Alexopoulos Citation1984a; Varotsos and Alexopoulos. 1984b; Johnston Citation1997; Orihara et al. Citation2012). China has started the digital geoelectric field observation of the fixed stations since 1999 and gradually implemented the long-term, continuous and standardized geoelectric field observation with a high temporal-spatial resolution (Du et al. Citation2006a; Du et al. Citation2006b; Qian et al. Citation2008). Up to now, more than 120 geoelectric field stations consists of network in China, which is the largest scale network all over the world. Based on the observation data of the network, Chinese scholars also have made meaningful progress in the study of the time and frequency variation characteristics of geoelectric field and disaster events such as the earthquake, etc (Huang and Liu Citation2006; Fan et al. Citation2010; Liu et al. Citation2011; Ma et al. Citation2014; Wang et al. Citation2015). These researches show that the geoelectric field data of most stations in the network of China are practicable, and also provide reference for the selection of observation station and data in this research.
2. Observation station and data of geoelectric field in China
2.1. Observation way
In China, the geoelectric field observation way of the fixed station is followed the spontaneous electric field observation method in the geophysical electrical prospecting (Du et al. Citation2006a). It is the same as the observation device system and observation physical quantity in geophysical exploration, but not completely the same as the geophysical exploration method. Geophysical electric method exploration is to move the spatial position of observation device, measure the spatial distribution of geoelectric field, and detect the change of electrical distribution of underground medium with space. Geophysical electric field observation of fixed stations is to lay fixed electrodes in multiple directions, continuously measure the change of geoelectric field at any time for a long time, and detect the change of electrical distribution of underground medium with time.
In China, most of the geoelectric field stations have two horizontal orthogonal observation directions (i.e. the observations of the north component Ex and east component Ey) and includes one horizontal observation direction oblique to the two orthogonal directions. Along each observation directions, it has two channels (i.e. long and short electrode spacing channels, the short electrode spacing is 200–500 meters, and the ratio of long and short electrode spacing should not be less than 1.5 (Du et al. Citation2006a)) are employed. Totally, each station is instilled with 6 channels (). Each channel will output one measurement datum of geoelectric field per minute; for the second sampling instrument, a minute datum is the average value of second data in each minute. Hence each channel will generate 1440 data through a daily observation. The voltage resolution of measurement instrument is 10 μV and the frequency range is DC∼0.005 Hz, which is lower than the frequency range of the relative measurement instrument in the China’s geomagnetic network (Du et al. Citation2006a; Du et al. Citation2006b; Qian et al. Citation2008). For example, the frequency range of the GM4 flux-gate magnetometer that is currently used in the china’s observation network of geomagnetic field and made in China is DC∼0.3 Hz.
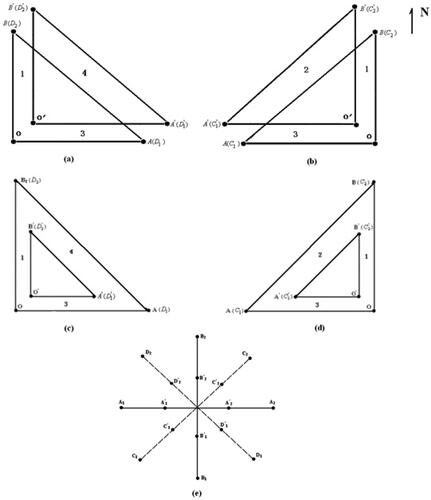
Figure 1. The electrode map of the geoelecreic field observation. (a and b): The electrode of parallel triangle; (c and d) : The electrode of internal triangle; (e): The electrode of ‘meter’ type.
2.2. Observation data
In this paper, the GEI is calculated by using the geoelectric field data of observation network over mainland China. In the observation of geoelectric field, the long-term stability of the observation system, which includes potential electrode, measurement instrument etc., are the key to produce high quality observation data. In addition, some stations are also affected by the artificial electrical noise environment in and around the electrode arrangement regions. In this way, we have to select the stations with high quality in this work that are rated as an ‘excellent’ grade in the annual evaluation of observation data quality of the network. Furthermore, the tidal diurnal variation (short for ‘TDV’) caused by the tidal force, is directly related to the seasonal and the moon phase. Considering that the observation data of geoelectric field on a same lunar calendar day in different years will be used to eliminate the TDV, it is necessary that the observation system and observation environment of the selected stations are normal for several continuous years and the data is reliable. According to the above requirements, we select the data of 18 geoelectric field stations over the mainland China () from 1 January 2014 to 20 September 2017 (UT time), totally 3.75 years, and include their Ex- and Ey-component data. These stations are located in the range of 32°N∼49°N and 79°E∼127°E. In the range, the azimuth of horizontal component H of geomagnetic field is quite close to that of the north component X, and the X-component is larger than the East component Y in their variation amplitude. Considering the orthogonal relationship of the polarization direction of electromagnetic wave, the observation data of the Ey-component of geoelectric field is used to calculate the GEI (). Secondly, in the current observation of geoelectric field, the measured base value commonly a few to a few hundred mV/km, can’t be accurately measured due to the polarized potential of measuring electrode, etc., but, the variation amplitudes of geoelectric field that are measured by the long and short channels in the same direction are consistent, so the data observed by a long channel of each station is used to calculate the GEI.
Figure 2. Distribution of 18 geoelectric field stations.
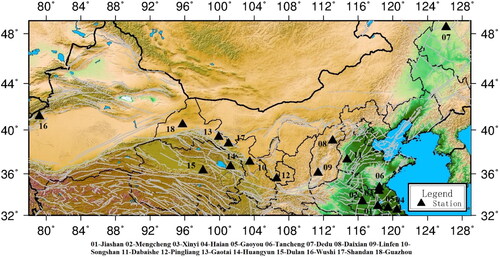
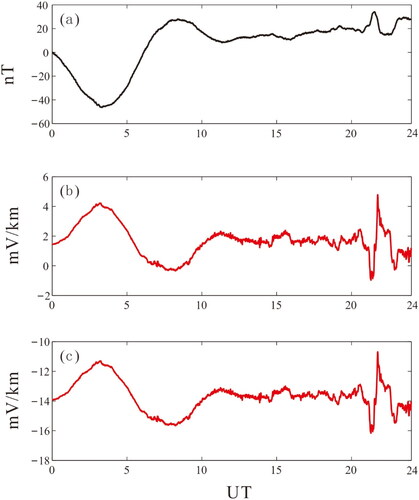
Figure 3. Observations from Dulan (15) station on Sept. 10, 2017. (a) Geomagnetic field H-component (b) Geoelectric field Ey-component long channel. (c) Geoelectric field Ey-component short channel
3. Calculation method of geoelectric index and its improvement
3.1. Method to determine the disturbance amplitude of geoelectric field
The determination of disturbance amplitude of geoelectric field in various geomagnetic activity days is the precondition for accurately quantifying the geoelectric index, which requires to solve the two key issues. The first one is how to eliminate the TDV of geoelectric field in an index calculation day. The geoelectric field is sensitive to the space electromagnetic activity, and its periodic components are very abundant and its disturbance variations occur at the same time in a vast area. For example, on geomagnetic disturbance days, such as geomagnetic storms, the power spectral density of geoelectric disturbance is 1–3 orders of magnitude greater than on magnetically quiet days (Serson Citation1973; William Citation2005; Sun and Du Citation2017). Meanwhile, there is an inverse relationship between the variation amplitude of geoelectric field and the electrical conductivity of underground medium at a station according to the Ohm’s law (), which directly influences the variation amplitude of various periodic components such as the TDV daily variation, geoelectric disturbance, etc. It will lead to the largely local difference of variation amplitude of geoelectric field among different stations, that is due to the resistivity structure under the stations. In addition, there are also some local short-time electrical noises caused by the artificial interference, such as the artificial electrical jump, pulse, etc. In this case, the elimination of geoelectric quiet daily variation on an index calculation day will be more complicated than that on a magnetically quiet day. The second one is how to determine the lower limit range of geoelectric disturbance amplitude in the calculation of geoelectric disturbance index. In the calculation of geomagnetic K index, the geomagnetic station network of China stipulates that the lower limit of variation amplitude in the mainland China is 0.6 times of the lower limit of the variation amplitude of geomagnetic field defined by Bartels (Citation1949) in the Niemegk geomagnetic stations (Xu Citation2003; Tschu Citation2001), that is inapplicable to the determination of the lower limit range of the electric disturbance amplitude.
In order to eliminate the quiet daily variation of geoelectric field on an index calculation day, we fit the quiet daily variation model of geoelectric field through the Taylor polynomial based on the observation data of geoelectric field Ey-component of the 18 stations on the same lunar calendar day in previous other year(s) as the index calculation day and on the geomagnetically quiet day, referring to the researches of Wang et al. (Citation2015). This model is regarded as the geoelectric quiet daily variations of the 18 stations on the index calculation day. Here, we introduce three quantities: A, B and B/A. Just like the calculation of geomagnetic index, the ‘peak-valley’ amplitude A () on the first 5 harmonic curve is obtained through the harmonic fitting of the geoelectric quiet daily variation curve (i.e. the calculated model curve) of each station, and then calculate the absolute value B of the corresponding difference between the geoelectric field data on the index day and the first 5 harmonic fitting data. B () is the amplitude of geoelectric disturbance variation after eliminating the influence of quiet daily variation. In order to eliminate the influence of the underground resistivity structure of each station on the geoelectric disturbance amplitude of each station, the ratio of B/A is used to express the amplitude of geoelectric disturbance.
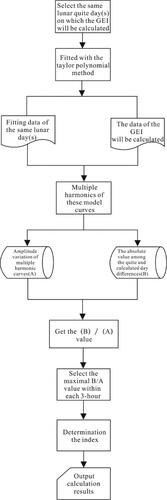
Figure 4. The calculation flow diagram.
3.2. Calculation process of geoelectric index
shows the calculation flow diagram of geoelectric index D by Sun et al. (Citation2018) according to the above-mentioned method. Its steps are as follows: (1) Based on the lunar day of the index calculation day, the geoelectric field data for the same lunar day and magnetically quiet day of other years are selected, and use the Taylor polynomial method for fitting out the quiet daily variation model for the geoelectric field Ey-component data. where the basic formula of Taylor polynomial is as follows:
(1)
(1)
where
and
are the latitude and longitude of the Taylor polynomial model expansion origin,
and
are the geographical latitude and longitude of each station.
is the coefficient of the polynomial model, N is the truncation order of the polynomial, and there are (N + 1)(N + 2)/2 model coefficients of the Taylor polynomial. Referring to the study of Wang et al. (Citation2015) on the daily variation model of geoelectric field, it is more appropriate to set N to 2. From the observed values of the minute component of the geoelectric field Ey for each station in a day, a linear system of equations is obtained as:
(2)
(2)
= {y1, y2, …, yn}, y1, y2, …, yn represents the observation data of each station, and
is the expansion coefficient related to
Solving the system of equations yields the quiet day geoelectric daily variation
for each station, which represents the quiet daily variation component common to each station and eliminates or weakens the local variation of each station. (2) Obtain the magnetically quiet daily variation curve of geoelectric field through the fitting of the first 5 harmonic waves of the calculated model curve data, and let that the ‘peak-valley’ amplitude of the fitting curve be the daily variation amplitude on the magnetically quiet day K = 0. For one day’s observations can be written as yt, which can be expressed in a mathematical expression as:
(3)
(3)
where
and phase can be calculated by the following equation:
(4)
(4)
(5)
(5)
(6)
(6)
k is the order of harmonics, it is more appropriate to set k to 5.
(3) Use the geoelectric field minute-value data on the index calculation day to correspondingly subtract the minute-value data of fitting curve accordingly to obtain the absolute value B of the difference, and calculate the variation amplitude A of 5 harmonic curves. (4) To calculate the ratio of B/A, the 24 h of the day (UT time) were averaged into eight 3-hour intervals, i.e. 00h:00m–02h:59m, 03h:00m–05h:59m, 06h:00m–08h:59m, 09h:00m–11h:59m, 12h:00m–14h:59m, 15h:00m–17h:59m, 18h:00m–20h:59m, 21h:00m–23h:59m. Select the maximum ratio B/A of each 3-hour interval. Convert the 8 maximum ratio values to the geoelectric index of each interval finally according to the relationship given in the . Let that the geoelectric index is divided into 10 index levels (0, 1, 2…9) and these index levels represent the different geoelectric disturbance levels, which is similar with the geomagnetic index K.
Table 1. The scale of D index.
The above-mentioned method (Sun et al. Citation2018) is called the original method in this paper. Sun et al. (Citation2018) initially calculated the geoelectric index by the original method based on the observation data of 11 geoelectric field stations in China. The value of geoelectric disturbance amplitude taken for the calculation is the maximum value of B/A ratios in each 3-hour interval (generally occur at the same time with the sudden commencement of geomagnetic field). Comparison between the geoelectric index and geomagnetic index of each station, 87.43% of the indices D are the same with the indices K or differ by only 1, and 93.75% of indices Ds and indices K̅ are the same or differ by only 1.
3.3. Improvement for calculation method of geoelectric index
In order to avoid or weaken the influence of possible wrong observation data (i.e. the random artificial noise, etc.) on individual stations on the geoelectric index, the following two improvement measures (i.e. two new methods) are introduced on the basis of the aforesaid calculation original method.
Attempt 1: improve the calculation step (4) in the original method by referring to the method of Zhang et al. (Zhang et al. Citation2017a, Citation2017b; Zhang and Du Citation2017c) which selects the variation amplitude of geoelectric field in calculation of the geoelectric current field. That is to say, select the average value of the first ten large B/A ratios in each 3-hour periods, and then convert the average value to the corresponding geoelectric index. In principle, this can avoid or weaken the influence of the artificial noise, etc. of individual stations in the geoelectric field observation on the geoelectric index. However, this perhaps ‘floods’ the sudden commencement variation of geoelectric field which coincides with the vast area in mainland China and synchronizes with the sudden commencement variation of geomagnetic field.
Attempt 2: the calibration comparison was added to attempt 1, i.e. the two indices were calculated simultaneously using original method and attempt 1. Sun et al. (Citation2018) used original method to calculate the GEI which instructions that the maximum difference between the individual index D values of each station is 2 in the same 3-hour period. Therefore, if the difference between two indices of the same station in the same 3-hour interval calculated by methods 1 and 2 is no less than 2, then it is believed that this index calculated by original method is an inappropriate one resulting from the random artificial noise, etc.in the observation of geoelectric field. In this case, the index D calculated by attempt 1 shall replace that calculated by original method, otherwise the index D calculated by original method shall be adopted.
4. Calculation results of the geoelectric index
According to the Kp index published by GeoForschungsZentrum, Potsdam (short for ‘GFZ’), 11 days of geomagnetic storm in September 2017. In view of the relative uniform distribution of different geomagnetic days, three methods were used to calculate the GEI using the 1 month observation data of 18 stations in to verify the practicability of the methods and the reliability of the calculated indices.
(1) Calculation with original method
The selected observation data were within September 1 to September 30, 2017 (totally 30 days). The 3-hour indices D of the 18 stations in each day during this one month (the number of D should be 4320, but the actual number is 4092 after excluding the days when the observation data of individual stations are unavailable) and their 3-hour indices Ds (totally 240 indices) are obtained. In connection with the geomagnetic indices K and of the 18 stations published by the China national geomagnetic network center, show respectively the frequency distribution of the indices D, Ds, K and
of the stations in one month (in the Figures, N is the totally number of geoelectric or geomagnetic indices of the 18 stations in the 30 days, and n is the number of geoelectric or geomagnetic indices in a same 3-hour interval (e.g. the total number of D/Ds/K/
= 1,2,3,4… in the 30 days)). The indices are overwhelmingly the same or differ by only 1 in the same 3-hour interval. The geoelectric and geomagnetic indices are compared to show that: in the 4096 pairs of single-station electric and magnetic indices, 88.13% of the D indices are the same with the K indices or they only have a difference of 1; in the 240 pairs of average electric and magnetic indices, 97.5% of the indices Ds are the same with the indices
or differed by only 1. In accordance with the comparison of the and , it can be seen that the D and K indices in a same 3-hour interval are almost the same or differed by only 1, however in terms of a same 3-hour index, the dispersion of indices D is slightly larger than that of the indices K among different stations, such as the 1st, 6th to 8th indices of stations 1 and 2. shows the geoelectric and geomagnetic indices on 5 September 2017, similar with the result of .
Figure 5. Geoelectric and geomagnetic indices of the 18 stations on 1 September 2017 (The graphs of a b c are the results calculated by the three calculation methods, the graph d is the result calculated by the K index. a- original method b- attempt 1 c- attempt 2).
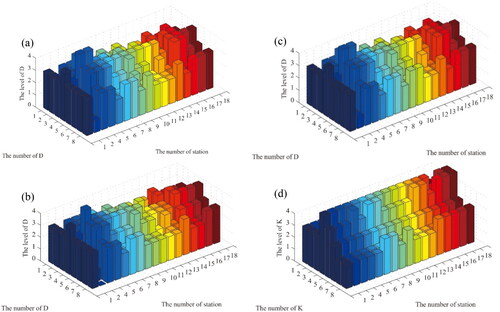
Figure 6. Frequency Distribution of Geoelectric Index and Geomagnetic Indices of the 18 stations in September 2017(original method). (a) Index D; (b) Index Ds; (c) Index K; (d) Index .
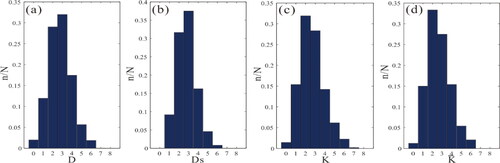
Table 2. Geoelectric and geomagnetic indexes of the 18 stations on Sept. 1, 2017(original method, attempt 1, attempt 2. Those marked in yellow are the indices with differences in calculation.).
Table 3. Geoelectric and Geomagnetic Indexes of the 18 stations on Sept. 5, 2017(original method, attempt 1, attempt 2. Those marked in yellow are the indices with differences in calculation.).
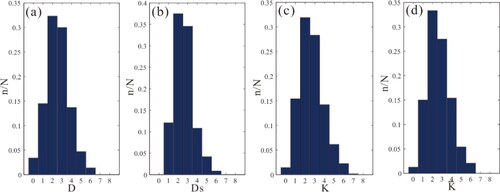
(2) Calculation with attempt 1
The indices D and Ds were calculated using Attempt 1 for the same period as original method. In the 4096 pairs of indices D and K, 87.35% of the indices D are the same with the indices K or differed by only 1; in the 240 pairs of indices Ds and 97.08% of the indices Ds are the same with the indices
or differed by only 1 (). show the geoelectric and geomagnetic indices of each station on 1 September 2017, and shows the indices on 5 September 2017. In accordance with the comparison, the electric and magnetic indices are highly consistent but the dispersion of indices D is still slightly larger than that of indices K among different stations. In accordance with the comparison between and , it can be seen that totally 7 indices D reach the same with the indices K on Sept. 1, 2017, such as the 2nd 3-hour index of station 5, the 6th index of station 6, etc., but 4 indices D have a difference of 2 from indices K, such as the 8th index of station 2, the 4th index of station 7; and totally 8 indices D reach the same with indices K on Sept. 5, 2017, such as the 4th index of station 2, the 8th index of station 7, etc., but the 3rd index of station 4 and the 2nd index of station 14 have a difference of 2 from indices K. Overall, attempt 1 are superior to original method in the dispersion degree of the same 3-hour indices D and K: it avoids the wrong index resulting from the random artificial noise.
Figure 7. Frequency distribution of geoelectric and geomagnetic indices of the 18 stations in September 2017(attempt 1). (a) Index D; (b) Index Ds; (c) Index K; (d) Index .
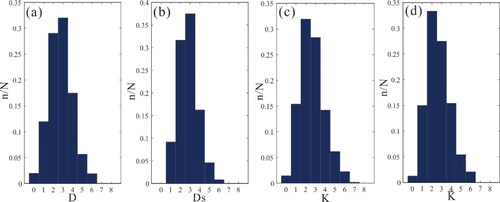
(3) Calculation with attempt 2
The indices D and Ds in the same period are calculated with attempt 2. In the 4096 pairs of indices D and K, 88.26% of the indices D are completely the same with the indices K or differed by only 1, which is improved comparing with the previous 2 methods (original method and attempt 1); in the 240 pairs of indices Ds and 97.5% of the indices Ds are the same with the indices
or differed by only 1 (). and show the indices D and K of the 18 stations on 1 September, 2017, and shows two kinds of electric and magnetic indices on 5 September 2017. In accordance with the comparison between the calculated electric and magnetic indices with original method and attempt 2, it can be seen that the indices calculated with attempt 2 has basically the same as original method. However, the agreement of the D index calculated by attempt 2 was slightly better (88.13% for the original method, 87.35% for attempt 1, and 88.26% for attempt 2), and the index Ds was the same as the original method, but higher than that of attempt 1. The D index reflects the changes in the electromagnetic environment around the station, and the Ds index reflects the changes in the vast area of the mainland of China. In the above calculation, the D index was improved, while the Ds index did not change. This indicates that the localized anthropogenic noise from individual stations does not affect a large area of the mainland of China, and that in the fitting calculation of the quiet daily variations of geoelectric field of the 18 stations through the Taylor polynomial method, the noise influence of individual stations seems to can be eliminated and weakened. At the same time, the calibration comparison also plays a role.
Figure 8. Frequency distribution of geoelectric and geomagnetic indices of the 18 stations in September 2017(attempt 2). (a) Index D; (b) Index Ds; (c) Index K; (d) Index .
The highest geomagnetic activity day in Sept. 2017 was Sept.8, and the largest geomagnetic index K = 6 this day. Attempt 2 is used to calculate the indices D and Ds in this day; the calculation result shows that 91.18% of the indices D are completely the same with the indices K or differed by only 1, and 87.5% of the indices Ds are the same with the indices or differed by only 1. As Sun et al. (Citation2018) calculated the results using original method, the consistency between two kinds of geoelectric and geomagnetic indices (D & K, Ds &
) on the day of the largest geomagnetic index K = 7 on June 22, 2015 is similar to the results calculated in this paper.
In terms of calculation principles, attempt 1 and 2 calculate the geoelectric indices D and Ds better than original method, unless the use of original method can determine that the maximum B/A value is a simultaneous change over a large spatial area.
5. Discussion and conclusion
5.1. Reliability of geoelectric index
In this paper, daily geoelectric indices were calculated by three methods and 18 stations during 1 month (September 2017), and each method has obtained 4096 indices D and 240 indices Ds. For all the indices D obtained by the three methods, minimally 87.35% and maximally 88.26% of them are completely the same with the geomagnetic index K or only have a difference of 1; for all the indices Ds obtained by the three methods, minimally 97.08% and maximally 97.5% of them are completely the same with indices or only have a differ by 1. The advantage of original method is that it is simple and convenient to select the maximum disturbance amplitude (B/A) in each 3-hour period, and the two kinds of electric and magnetic indices match well, with 88.13% of D and K being identical or differing by 1indicesindices. However, this method requires that the selected maximum B/A values occur simultaneously over a large spatial area in mainland China, and the environmental interference of individual stations, e.g. the artificial noise etc., will easily cause a wrong index D. The advantage of attempt 1 is to select the first 10 major B/A values in each 3-hour period, which eliminates or weakens the influence of environmental interference. However, from the coincidence degree between the two types of electric and magnetic indices, attempt 1 is the lowest in the three methods: only 87.35% of the indices D are completely the same with indices K or differing by 1. The advantage of attempt 2 is that the checking comparison of indices D is added on the basis of methods 1 and 2. From the indices D calculated with attempt 2, the two kinds of electric and magnetic indices have the highest degree of coincidence: 88.26% of the indices D are completely the same with the indices K or differing by 1.
In addition, the high consistency between the D index and the K index does not mean that the D index can replace the K index. In the quantitative study of geophysical changes, multiple methods can support the same phenomenon better than a single method. In this paper, the two indices complement each other and both can quantify the disturbance degree of space electromagnetic field, which is of equal importance.
On the whole, the geoelectric indices calculated by the three methods have a very high degree of coincidence with the geomagnetic indices, and the geoelectric indices calculated with various methods are almost identical. This proves that the calculated geoelectric indices are reliable although the geoelectric field observation has many influence factors: the geoelectric field easily suffer an interference from the artificial-noise etc., the geoelectric pulses sensitive to the spatial electromagnetic activity are very ample on the time-varying data curve of geoelectric field, and the geoelectric observation system (e.g. the measurement instrument and electrodes, etc.) is still to be improved in its long-time stability. It also shows that the geoelectric indices D and Ds can quantitatively define the level of electromagnetic activity, which has the same role and significance as the currently commonly used geomagnetic indices K and Kp. Further speaking, the mutual compensation between the two kind of geoelectric and geomagnetic indices can more accurately define the earth’s electromagnetic activity level.
However, there are still two problems with the geoelectric indices D and Ds: first, the indices D in a same 3-hour interval are more dispersive in their values than the indices K among different stations (see and and 3), which was also noticed by Sun et al. (Citation2018). Second, the difference value between a few of indices D and indices K reaches 2, and the difference value between the extremely individual index Ds and index even reaches 3, with a proportion of 0.42% (only one index in 240 pairs of electric and magnetic indices). For example, the index Ds in the first 3-hour interval on September 10, 2017 was 1 (figure and table omitted), but the inquired index
in this interval from the China’s Geomagnetic Network Center was 4 and the geomagnetic index Kp published by the GFZ in this interval was 0, so is this the error in the calculation of the geoelectric index or the result of the China’s Geomagnetic Network Center?
The reason for the first defect depends mainly on the quality of geoelectric field observation data at individual stations. The network of geoelectric field in China produces the observation data with a magnitude ∼ mV/km, and the resolution of its measurement instrument is 10 (Du et al. Citation2006a). There are many factors affecting the geoelectric field observations of this magnitude, such as the artificial noise in observation, sensitive response to the local spatial electromagnetic activity of the stations (e.g. local lightning), performance of measurement instrument, etc. which are all critical links influencing the quality of observation data. Different stations have different the observation conditions mentioned-above, so the quality of observation data is different. On the other hand, in order to eliminate the quiet daily variation of geoelectric field on an index calculation day we use the geoelectric daily variation on the magnetically quiet day and on the same lunar calendar day in previous other year(s) to remove the tidal components related to the moon phase and sun etc., so this requires that the observation data of geoelectric field at the used stations are long-term reliable. Secondly, part of stations in this paper are located in the region of electrode arrangement observing the DC apparent resistivity (Du et al. Citation2006b), such as the stations 01, 02, 03, 04, 05, 06, 08, 09, 11 and 17. In the repeated observation of apparent resistivity in 24 h of everyday which hourly lasts for about 8 min, the DC current∼1–2 A will be transmitted underground, resulting in the DC potential difference
between the measuring electrodes of geoelectric field observation (a kind of artificial noise).The potential difference
is different at different stations; at the stations the measurement instrument of geoelectric field eliminates it through setting different thresholds for different stations, which will cause accidental deletion of real short-time geoelectric field variation, leading to the slight dispersion of the indices D among stations comparing with the indices K. The method to solve this problem in this paper is to use many stations in the calculation of indices D, especially using the observation data of geoelectric field of the stations without the apparent resistivity observation as possible, and then obtain the geoelectric multi-stations average indices Ds. In fact, from and , we can know that at stations 12 and 15, index D has good agreement with index K. These stations have no interference from geological resistivity observations and other environmental disturbances, which are also the stations with higher observation quality in the evaluation of the quality of observation data of the Chinese geoelectric field network in recent years. Therefore, the first defect caused by the artificial noise etc. can be well solved by selecting multiple stations, especially selecting the observation data of the stations with a high observation quality to calculate their indices D and then to obtain the average index Ds.
The main reason for the second defect is that the geoelectric and geomagnetic indices are calculated from two physical quantities respectively–the geoelectric field and geomagnetic field which disturbances arise from the induction of the earth medium to the spatial electromagnetic activity, which follows the law of electromagnetic induction and the law of electromagnetic field propagation. However, the instruments measuring the geomagnetic and geoelectric fields in China are different at each station (for example, at the stations in ), independently measuring the geoelectric field and the geomagnetic field with two kinds of geoelectric and geomagnetic instruments. Thus, some differences seem to cannot be avoided between the geoelectric index and geomagnetic index. Especially, the measurement instrument of geoelectric field, in China, has a frequency range of 0 Hz∼0.005 Hz, while the frequency range of the relative measurement instrument of geomagnetic field (such as the fluxgate magnetometer made in China) is 0 Hz∼0.3 Hz, which is higher than the geoelectric field instrument, so there will be a slight difference in the high-frequency components of geoelectric and geomagnetic disturbances measured by the two kinds of the instruments. In fact, it can be seen from the and that most of the geoelectric indices D and Ds are equivalent to or slightly smaller than the geomagnetic indices K and which is due to the low frequency range of geoelectric field instruments.
Secondly, the response of the geoelectric field to the slowly varying-time geomagnetic field is low, while the response to the rapidly varying geomagnetic field is timely and large in amplitude, so it has a quite ample short-time disturbance such as a geoelectric pulse, etc., which is richer than that of geomagnetic field (). For example, the geoelectric field has a small-amplitude response in the later period of principal phase and recovery phase of a geomagnetic storm, and the principal phase and recovery phase of a geoelectric storm during the period almost cannot be specifically distinguished (Sun and Du Citation2017). It will influences the indices D and Ds, resulting in a slightly deviation between the geoelectric and geomagnetic indices as well.
In addition, we pay attention that the proportion of coincidence degree between the geoelectric and geomagnetic indices at a high geomagnetic activity level is lower than that at a low geomagnetic activity level. It is directly related with the different frequency range between the geoelectric and geomagnetic instruments and leads to the smaller geoelectric index than the geomagnetic index.
5.2. Conclusion
The geoelectric disturbance is closely related with the geomagnetic disturbance. Dozens of geomagnetic indices are put forward in the geomagnetism field in order to realize the quantitative definition of the earth’s electromagnetic activity level. Sun et al. (Citation2018) attempted to define the electromagnetic activity level with the observation data of geoelectric field and proposed the calculation method for the geoelectric index, which is attempted to be improved in this paper (i.e. the original method), and the following conclusions were obtained by comparing the calculation results of indices the original method and the two improved methods (i.e. attempt 1 and attempt 2), in the calculation results, it is possible that the calculation result of attempt 2 is a little better:
The calculation results of the three methods are basically the sameindices; the two improved methods can avoid or weaken the influence of wrong geoelectric data caused by the interferences such as the random artificial noise etc. of individual stations on the geoelectric index, so the three calculation methods are practicable and attempt 2 is superior to other two methods ().
In the geoelectric indices calculated with the three methods, most of the indices are highly consistent with the geomagnetic indices: the geoelectric indices are numerically identical to the geomagnetic indices for the same 3-hour period or differ only by 1. In the 4096 pairs of single-station geoelectric and geomagnetic indices of each method, the proportion of coincidence degree between the geoelectric index D and geomagnetic index K is in the range of 87.35%–88.26%; in 240 pairs of multi-station average indices, the geoelectric indices Ds coincides with the geomagnetic index
coincide in the range of 97.08%–97.50%. It indicates that the geoelectric indices calculated by the three methods are reliable.
The geoelectric field observations have many influencing factors and are rich in fast disturbance variations, but the electromagnetic activity level can be quantitatively defined on the basis of geoelectric field observation after the elimination of the influencing factors. Obviously, the geoelectric indices D and Ds are another approach to define the earth’s electromagnetic activity level, and the mutual compensation and reference between the geoelectric and geomagnetic indices can more accurately identify the electromagnetic activity level.
The geoelectric 3-hour indices D among different stations are slightly discrete, the geoelectric and geomagnetic indices have a slight difference (i.e. between D and K & Ds and
Table 4. The same or similar ratio of the three calculation methods.
Acknowledgments
We would like to thank the China’s Geoelectric Observation Network for providing observation data of the geoelectric fields, the China’s Geomagnetic Network Center for providing the geomagnetic indices and the World Data Center for providing geomagnetic activity data.Thanks for the hard work of editors and anonymous experts.
Data availability statement
The data that support the findings of this study are available from the first author, Junsong Sun, upon reasonable request.
Disclosure statement
The authors report no conflict of interest.
Additional information
Funding
References
- Albertson VD, Thorson JM, Miske SA. 1974. The effects of geomagnetic storms on electrical power systems. IEEE Trans on Power Apparatus and Syst. PAS-93(4):1031–1044.
- Bartels J, Heck NH, Johnston HF. 1939. The three-hour-range index measuring geomagnetic activity. J Geophys Res. 44(4):411–454.
- Bartels J. 1949. The standardized index Ks, and the planetary index Kp. IATME Bull. 12b, 97:2010–2021.
- Bitterly M, Menvielle M, Bitterly J, Berthelier A. 2000. A comparison between computer derived (FMI method) and hand scaled K indices at Port-aux-Francais and Port Alfred French Observatories. www.cetp.ipsl.fr/∼isgi/FMI_method.pdf
- Chapman S, Bartels J. 1940. Geomagnetism. Oxford: Clarendon Press.
- Du XB, Xi JL, Tan DC, Zhao JL, Qian JD, Lu YQ, Lu J, Tang YX, Kang HL, Chen YF, et al. 2006a. DB/T 18.2-2006. Specification for the construction of seismic station geoeletrical station part 2: geoeletrical field observatory. Beijing: Seismological Press (in Chinese).
- Du XB, Zhao JL, Tan DC, Xi JL, Qian JD, Lu J, Tang YX, Kang HL, Lu YQ, Chen YF, et al. 2006b. DB/T 18.1-2006. Specification for the construction of seismic station geoeletrical station part 1: geoeletrical resistivity observatory. Beijing: Seismological Press (in Chinese).
- Egbert GD. 2002. On the generation of ULF magnetic variations by conductivity fluctuations in a fault zone. Pure Appl Geophys. 159(6):1205–1227.
- Fan Y-Y, Du X-B, Jacques Z, Tan D-C, An Z-H, Chen J-Y, Zheng G-L, Liu J, Xie T. 2010. The electromagnetic phenomena before the Ms8.0 Wenchuan Earthquake. Chin J Geophys. 53(6):997–1010 (in Chinese).
- Fu CY, Chen YT, Qi GZ. 1985. Geophysical foundation. Beijing: Science Press (in Chinese).
- Huang QH, Liu T. 2006. Eaethquakes and tide response of geoelectric potential field at the Niijima station. Chin J Geophys. 49(6):1745–1754 (in Chinese).
- Johnston MJS, Ware RH, Mueller R. 1983. Tidal-current channeling in the San Andreas Fault, California. Geophys Res Lett. 10(1):51–54.
- Johnston MJS. 1997. Review of electric and magnetic fields accompanying seismic and volcanic activity. Surv Geophys. 18(5):441–476.
- Kantas K. 1956. Results of the simultaneous measurements of telluric currents between Peking (China) and Ospron (Hungary) executed from 9th to 14th January 1956. Chin J Geophys. 5(2):80–88 (in Chinese).
- Кrаеv АP. 1950. Geoelectrics principle. Zhang KQ, Chen PG, Zhang ZC. Trans. 1954. Beijing: Geological Publishing House (in Chinese).
- Liu J, Du XB, Zlotnicki J, Fan YY, An ZH, Xie T, Zheng GL,Tan DC, Chen JY. 2011. The changes of the ground and ionosphere electricmagnetic fields before several great earthquakes. Chin J Geophys. 54(11):2885–2897 (in Chinese)
- Ma QZ, Li W, Zhang JH, Guo YG, Fang GQ. 2014. Study on the spatial variation characteristics of the geoelectric field signals recorded at the station in the east Huabei area when a great current is injected. Chin J Geophys. 57(2):518–530 (in Chinese).
- Menvielle M, Papitashvili N, Hakkinen L, Sucksdorff C. 1995. Computer production of K indices: review and comparison of methods. Geophys J Int. 123(3):866–886.
- Orihara Y, Kamogawa M, Nagao T, Uyeda S. 2012. Preseismic anomalous telluric current signals observed in Kozu-shima Island, Japan. Proc Natl Acad Sci USA. 109(47):19125–19128.
- Pirjola R, Ryno J, Sucksdorff C. 1990. Computer production of K-indices by a simple method based on linear elimination. In Proceedings of International Workshop on Observatory Data Acquisition and Processing. 136–146.
- Pirjola R. 2002. Review on the calculation of surface electric and magnetic fields and of geomagnetically induced currents in ground-based technological systems. Surveys Geophys. 23(1):71–90.
- Qian JD, Feng ZS, Ma SL, Zhao JL, Xia Z, Zhou X, Xi JL, Ju HH. 2008. Technical requirements of instruments in network for earthquake monitoring Geomagnetic meter Part2: proton vector magnetometer. Beijing: China Earthquake Administration (in Chinese).
- Schlumberger M, Kunetz G. 1946. Variations rapides simultanées du champ tellurique en France et à Madagascar. CR Acad Sci Paris. 223:551.
- Serson PH. 1973. Instrumentation for induction studies on land. Phys Earth Planet Interiors. 7(3):313–322.
- Sucksdorff C, Pirjola R, Hakkinen L. 1991. Computer production of K-values based on linear elimination. Geophys Trans. 36:333–345.
- Sun JS, Du XB. 2017. The time-frequency characteristics of geoelectric storm in Chinese mainland. Acta Seismol Sin. 39(4):615–632. (in Chinese).
- Sun JS, Du XB, Wang L, Cui TF. 2018. Studies on the geoelectric index (GEI). Chin J Geophys. 61(11):4493–4503 (in Chinese).
- Tschu KK. 2001. Studies on the disturbance variations of geomagnetic field at So-Sè, near Shanghai, China. Chin J Geophys. 44(Suppl.):51–67 (in Chinese).
- Varotsos P, Alexopoulos K. 1984a. Physical properties of the variations of the electric field of the earth preceding earthquakes, I. Tectophysics. 110(1-2):73–98.
- Varotsos P, Alexopoulos K. 1984b. Physical properties of the variations of the electric field of the earth preceding earthquakes, II. Determination of epicenter and magnitude. Tectonophysics. 110(1-2):99–125.
- Wang L, Du XB, Wu Z, Zhang X, Cui TF. 2015. Daily variation model of the geo-electric field based on the geo-electric data from the regional geo-electric observation networks. Acta Seismol Sin. 37(5):830–841 (in Chinese).
- Ward SH. 1980. Electrical, electromagnetic, and magnetotelluric methods. Geophysics. 45(11):1659–1666.
- William L. 2005. Fundamentals of geophysics. England: Cambridge university press.
- Xu WY. 2003. Geomagnetism. Beijing: seismological Press (in Chinese).
- Zhang X, Liu J, Du XB. 2017a. A model of the telluric current eddy: a case from eastern China. J Geophys Eng. 2017(3):478–486.
- Zhang X, Du XB, Wang L, Liu J, Tan DC. 2017b. The spatial distribution of telluric currents and its relationship with earthquake activity in North-South seismin belt. Earth Sci Front. 24(2):202–211 (in Chinese).
- Zhang X, Du X-B. 2017c. The responses analysis of GIC and vortex current in Huabei region during geoelectric storms. Chin J Geophys. 60(5):1800–1810 (in Chinese).
- Zheng K, Trichtchenko L, Pirjola R, Liu L-G. 2013. Effects of geophysical parameters on GIC illustrated by benchmark network modeling. IEEE Trans Power Delivery. 28(2):1183–1191.