
 ?Mathematical formulae have been encoded as MathML and are displayed in this HTML version using MathJax in order to improve their display. Uncheck the box to turn MathJax off. This feature requires Javascript. Click on a formula to zoom.
Abstract
Urban flood risk assessment requires attention in inland areas with intensifying climate change and an increasing probability of extreme precipitation. This study describes the developments and testing of a sub-catchment-based multi-index fuzzy evaluation approach that can provide adaptation guidance for municipal decision-makers at a local level. We first built a comprehensive flood risk assessment system considering three categories: hazard, urban system, and social environment. The proposed evaluation system includes hybrid uncertain information that involves random indicator sources and hesitant fuzzy judgments from experts. The storm weather management model combined with geographic information system tools was then applied to obtain random indicators. Subsequently, hesitant fuzzy linguistic sets and the Euclidean distance method were adopted to solve the problem of uncertainty and vagueness from subjective hesitant information. Therefore, the aggregation method provides a beneficial way to assess flood risk in a hybrid uncertain environment. In addition, the proposed approach was applied to the Jinjiang district in an inland city in the P. R. of China. This supports efforts to prioritize locally tailored policies and practical measures for higher-risk sub-catchments within large urban systems.
1. Introduction
Urban flooding occurs when the excess surface runoff caused by floods or rainstorms surpasses the capacity of the urban drainage system, which is the most frequent and serious natural hazard in cities worldwide. Globally, 20% of urban residents are exposed to a 100-year flood, and more than 600 cities are likely to be completely inundated by a 100-year flood (United Nations Human Settlements Programme (UN-Habitat) Citation2022). Urban flooding events result in traffic network paralysis (Kogure Citation2016; Zhou et al. Citation2021), property damage to residential and public buildings (Jakoubek Citation2007), and even casualties (Xu et al. Citation2022). Globally, coastal cities are hotspots that face high economic and non-economic losses from urban flooding. However, with intensifying climate change and increasing probability of extreme precipitation, many inland cities in China face more flooding hazards than they have not previously had the opportunity or rarely encountered (Ministry of Water Resources of the People’s Republic of China Citation2019). On July 20 last year, a heavy rainstorm flooded the whole Zhengzhou city and caused 380 deaths or missing and 40.9 billion CNY in direct economic losses (State Council Disaster Investigation Team Citation2022). Compared with coastal cities, the natural drainage capacity and the standard of urban drainage infrastructure in inland cities are generally lower. Therefore, it is necessary to analyze the spatial and temporal distribution of flooding in inland cities, identify potential high-risk areas at the local level, and develop suitable adaptation strategies and measures (IPCC Citation2022; Jia et al. Citation2022).
Disaster risk is a combination of factors that determine the potential for people to be exposed to particular types of natural hazard (Wisner et al. Citation2014). Disaster risk assessment in the broad sense is conducted in the disaster system consisting of disaster-pregnant environments, disaster-causing factors, and disaster-bearing carriers (Ding et al. Citation2020; Shi Citation1996, Citation2002). Existing methods for urban flood risk assessment can be divided into four categories: i) statistically based probability assessment for future hazard exposure based on flooding event records with long time series (Benito et al. Citation2004); ii) multi-attribute decision making (MADM) based on a multi-index assessment system (Ghosh and Kar Citation2018; Othmer et al. Citation2020); iii) geographic information system (GIS) that can handle large amounts of spatial data, visualize flood risk layer by layer, carry out rapid investigation on a large scale (Zhang et al. Citation2020); and iv) scenario simulation (SS) analysis using one/two dimensional hydrodynamic software, such as the storm water management model (SWMM) developed by United States Environmental Protection Agency and MIKE series developed by Danish Hydraulic Research Institute (Geng et al. Citation2020), and determining the most critical factors that cause flood risk changes by changing input conditions (Gangrade et al. Citation2019).
Although the above methods are able to produce acceptable results, they cannot assess a comprehensive flood risk considering aspects of disaster-pregnant environments, disaster-causing factors and disaster-bearing carriers. Therefore, some scholars have attempted to use the aggregation approach of the above methods to address the absence of measured water level and surface flow data, or to solve the hybrid uncertainty caused by hybrid information. Most studies using GIS tools and SWMMs apply probability assessment to improve the accuracy of the results (Cai et al. Citation2019; Xu et al. Citation2020). However, simulation results based on the assumed rainfall derived from experience formulas or designed equations present a challenge for the assessment of risk in the future, especially under climate change and other more local environmental changes that will impact run-off and other hydraulic variables underlying flooding hazards (Dodman et al. Citation2022). Therefore, it is necessary to build a surface runoff model with observational rainfall data.
Moreover, the uncertainty of most index systems in MADM methods is not probabilistic but comes from vagueness (Rodriguez et al. Citation2012). Therefore, fuzzy set theory was developed and applied successfully to depict imperfect, incomplete, and vague information. For example, Lyu adopted a series of fuzzy numbers to increase the accuracy of risk assessment results, including interval fuzzy AHP (Lyu and Shen Citation2018; Lyu et al. Citation2019b), triangular fuzzy AHP (Lyu et al. Citation2020b, Citation2020c) and trapezoidal fuzzy AHP (Lyu et al. Citation2020a). Nevertheless, the risk assessed by traditional fuzzy sets is constrained by a lack of transparency arising from the use of diverse information sources (Borujeni and Gitinavard Citation2017). In recent decades, the use of hesitant fuzzy linguistic sets (HFLS) (Rodriguez et al. Citation2012), developed from hesitant fuzzy sets (HFS) (Torra Citation2010), has become one way forward to bring flexible assessment of expert knowledge into the analytical approach and decrease the uncertainty and vagueness of subjective hesitant information (Li et al. Citation2019c). Consequently, urban flooding risk assessment, which considers objective indicators and subjective expert remarks, is a typical multi-criteria decision-making problem with hybrid information.
Therefore, the objective of this study was to provide a sub-catchment-based assessment of urban flood risk at the local level under a hybrid information environment by using the MADM method incorporated with SWMM and GIS technique. We firstly built a new urban flooding risk evaluation system reflecting the characteristics of hazard (heavy precipitation), urban system (the built environment), and social environment (people and facilities), in which all indicators are quantitative and the indicators’ weights come from experts’ subjective assessments. However, it is difficult to obtain the expected indicator values based on empirical formulas for rainfall intensity and for experts to give judgments precisely. To handle the uncertainty from the simulated indicator values, observational rainfall data of more than 50 mm in the study area were used to calibrate the SWMM. To handle subjective vagueness, hesitant fuzziness was employed to describe experts’ linguistic terms. Subsequently, a novel information aggregation approach was developed for urban flood risk assessment based on sub-catchment simulation using SWMM, GIS techniques, and HFLS.
2. Methodology
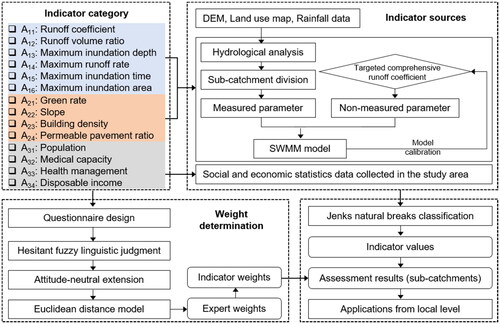
A multi-index hesitant fuzzy assessment framework is proposed based on sub-catchment numerical simulation results, which provides an approach to assess the urban flood risk at the local level, as shown in . The assessment flowchart includes four parts: i) quantitative indicator system consisting of three categories covering meteorological-hydrological, topographic-landform, land cover, geology, and social indicators, ii) indicator sources processing from hybrid information based on SWMM and GIS technique, iii) evaluator and indicator weights determination by a hesitant fuzzy weighted averaging operator and the Euclidean distance method (Liao and Xu Citation2014, Citation2015), and iv) application of weighted index to the study area to obtain risk levels for sub-catchments in GIS and provide adaptation measures from local levels. The GIS-SWMM was used to obtain the expected simulation results as random indicator values using observational rainfall events. The HFLS and Euclidean distance model were used to decrease the uncertainty and vagueness of the experts’ weights. The proposed sub-catchment-based multi-attribute fuzzy evaluation approach using the GIS-SWMM-HFLS method considers both quantitative indicators and hesitant fuzziness in the urban flood risk assessment for the first time.
Figure 1. Assessment flowchart of sub-catchment-based urban flooding risk. The red box is the category of disaster-causing factors, the blue box is the category of disaster-pregnant environment, and the yellow box is the category of disaster-bearing carriers. The rounded rectangle represents the calculation results.
2.1. Assessment model
Urban flood risk can be conceptually described as the result of a combination of hazard, urban environment, and social vulnerability. The assessment structure consists of one evaluator hierarchy containing 14 indicators from the above three aspects. The general framework for the urban flood risk assessment from local level was as follows: there are sub-catchments in a study area to be evaluated, i.e.
indicators, i.e.
and
experts, i.e.
The urban flood risk of each sub-catchment (
) is equal to a comprehensive value, which was obtained by adding the weighted average of all indicators in the three categories, as shown in EquationEq. (1)
(1)
(1) .
and
represent the values of each indicator;
and
represent the weights of the indicators.
(1)
(1)
2.2. Indicator category
Following the principles of validation, convenience, and adaptation (Li et al. Citation2019b, Citation2019c), 14 indicators were selected from three categories of the disaster risk system theory. First, the disaster-causing factors in our analysis were mainly the runoff parameters of urban flood, including runoff coefficient, runoff volume ratio, maximum inundation depth, maximum runoff rate, maximum inundation time, and maximum inundation area. According to previous studies, these parameters reflect the intensity of rainfall events and the hazard resistance capacity of the study area (Zhou and Shen Citation2013). The six indicators have a negative correlation with urban flood risk.
In a sub-catchment the runoff coefficient (
) is the amount of surface runoff (
) in a certain period divided by the amount of rainfall (
) in the same period. The runoff volume ratio (
) is the ratio of the surface runoff volume of a sub-catchment (
) to the average runoff volume of the study area (
) during the same precipitation event.
(2)
(2)
(3)
(3)
Maximum inundation depth (
), maximum runoff rate (
), maximum inundation time (
), and maximum inundation area (
) refer to the maximum values in a sub-catchment area. According to the SWMM manual (Rossman and Huber Citation2016), let
be a coefficient,
be the ordinate against rainfall volume,
be ponded water above the depression storage depth,
be the width (
),
be the net excess ponds atop the sub-catchment surface to a depth,
be the surface area of the sub-catchment (
), and
be a surface roughness coefficient; then, the maximum inundation depth and maximum runoff rate can be expressed as EquationEqs. (4)
(4)
(4) and Equation(5)
(5)
(5) . Then, maximum inundation time is the difference between the time when the flood is dry (
) and the time when the flood begins to inundate (
) expressed in EquationEq. (6)
(6)
(6) . Maximum inundation area is expressed as the runoff volume of a sub-catchment (denoted
) divided by the maximum inundation depth (
).
(4)
(4)
(5)
(5)
(6)
(6)
(7)
(7)
Second, the disaster-pregnant environment refers to elements of the built environment that influence the likelihood and severity of flooding events. Urban construction has changed the original topography. The occurrence of urban flooding hazards is closely related to the terrain of the built environment; in our analysis, this was represented by four indicators. The slope (), which determines the direction of water flow was calculated using the GIS tool as the ratio of elevation to horizontal difference. The green rate (
), building density (
), and permeable pavement ratio (
) reflect the permeable and impermeable land use in the study area, which plays an important role in urban flooding generation. The green rate to permeable pavement ratio has a positive correlation with urban flood risk, whereas slope and building density have negative correlations.
Using the number of grids extracted by the land use map, we defined the green rate, building density, and permeable pavement ratio as the percentages of green grids, building grids, and permeable pavement grids in the total grids for each sub-catchment. In the th sub-catchment, the number of total grids is denoted as
the number of green grids (the lawn, green belt, etc. are included whereas low-impact development facilities such as green roofs and reservoirs are excluded) is denoted as
the number of building grid is denoted as
and the number of permeable pavement grids is denoted as
(8)
(8)
(9)
(9)
(10)
(10)
Within the construction of sponge and resilient cities in China, permeable pavements are widely used and regarded as an effective measure for managing water permeability, drainage, and noise reduction functions (Li et al. Citation2021; Wendling and Holt Citation2020). According to the technical guidelines for sponge city construction implemented since 2014 (Ministry of Housing and Urban-Rural Development of the People’s Republic of China Citation2014) permeable pavements are increasingly used in China. Permeable pavements allow the model to reflect the most recent innovation in urban design as part of adapting cities to climate change-associated risks. We use the difference between the built-up grids minus the hardened grids to estimate the number of permeable pavement grids. We define as the number of built-up area grids and
as the pervious pavement rate. Then, the number of permeable pavement grids (
) is obtained.
(11)
(11)
Third, disaster-bearing carriers describe exposure and vulnerability. In the Chinese experience, more populous places have more developed economies, resulting in denser urban roads and traffic and higher observed impact on people and property caused by flooding events (Huang Citation2020). The severity of hazard impacts is closely related to population size, which has a negative correlation with urban flood risk. Medical capacity, health management, and disposable income reflect the capacity of post-disaster emergency response and recovery, which have a positive correlation with urban flood risk (Idris et al. Citation2018). For example, areas with advanced medical capacity can often minimize hazard losses, whereas under-serviced areas tend to have more casualties.
We defined the area of a sub-catchment as the estimated number of people per square kilometer as
and the population for each sub-catchment (
) was obtained in EquationEq. (12)
(12)
(12) . Based on the population for each sub-catchment (
), medical capacity (
) was calculated by multiplying the per capita medical allocation rate of the study area, which was defined as the number of hospitals (
) divided by the total population (
), and health management (
) was calculated by multiplying the ratio of the total number of fitness facilities (
) and psychological counseling centers (
) in the study area to the total population (
). Disposable income (
) refers to the income obtained by residents in a year and can be used for free disposal multiplied by the per capita disposable income (
).
(12)
(12)
(13)
(13)
(14)
(14)
(15)
(15)
2.3. Indicator processing by SWMM and GIS tools
The proposed urban flooding risk evaluation system has hybrid information: the indicators of the disaster-bearing carriers were crisp, the indicators of the disaster-causing factors and disaster-pregnant environment were random, and experts’ remarks on the indicators’ importance were hesitant and fuzzy. Based on open source data, this study used GIS tools and SWMM to obtain the expected simulation, which allowed for the random values to be merged into crisp values.
The first step was hydrological analysis using GIS. The fill tool was used for terrain pre-processing based on the original digital elevation model (DEM) map. The purpose of the flow direction analysis was to calculate the outlet direction position of the basin based on the characteristics of water flowing from high terrain to low terrain. The single drainage direction algorithm was used to generate the numerical values of [1, 2, 4, 8, 16, 32, 64, 128] in a total of eight directions (O'Callaghan and Mark Citation1984).
The sub-catchment division was the main step in SWMM, as well as the basis of the urban flood risk assessment model. The quality of the division had a considerable impact on the accuracy of the results. Two approaches are often used to divide the study area: manual and Thiessen polygon divisions. The former artificially divides the study area based on the direction of the drainage pipe network and the distribution of buildings and streets, which is suitable for cases with a small research scope, simple pipeline network, and clear flow direction. Accuracy depends on the experience of the experimenters. In theory, the high precision and good effect of the model are ensured by the actual drainage conditions. However, when facing the data scarcity of pipeline networks, specifically referring to the pipeline diameter and the pipeline bottom elevation, in old build-up areas, manual division is impossible. The classic Thiessen polygon method (Brassel and Reif Citation2010) is widely used in the division of urban sub-catchments and delineates sub-catchments based on pipe network nodes or water outlets (Yang et al. Citation2022). Compared with the manual division method, the urban storm water model constructed using the Thiessen polygonal division method was more suitable for simulating storm flooding scenarios in the study area (Li et al. Citation2019a). In this study, Thiessen polygons were generated in GIS, and the division results were adjusted manually, which is relatively simple, time-saving, and suitable for district research areas.
Parameter (including measured and non-measured parameters) preparation and model calibration are described in Section 3.3 when testing the proposed framework in the Jinjiang district.
2.4. Indicator weights using HFLS and Euclidean distance
We applied a hesitant fuzzy weighted averaging operator and the Euclidean distance method to determine the indicator weights. The experts were free to interpret these terms. Individual judgments were converted into numeric scores, which were summed to provide weights for individual model variables. Based on hesitant fuzzy set theory, the linguistic variable was connected to a real number in the interval through a compatibility function. In this study, a 7-scaled linguistic term set (extremely unimportant, very unimportant, unimportant, medium, important, very important, and extremely important) was used for urban flood risk assessment:
The number of options for the importance of the indicator given by experts, which was defined as the length of the evaluation linguistic terms can be different. To ensure comparability, shorter values must be extended until all values are equal in length (Liao et al. Citation2014). Thus, an attitude-neutral extension method was adopted. The extension value was where
is the parameter determined by the experts’ attitudes, and
and
are the maximum and minimum values, respectively. This study assumes that all experts were neutral towards values, which means
In decision-making problems, determining expert weights is complex, as it is difficult to account for the experience and knowledge of each expert. Traditional evaluation methods usually provides random or the same weight to each expert, which limits the sensitivity of the evaluation (Kumar and Kumar Citation2021). The expert weight in this study was determined by using the Euclidean distance model to maximize group consensus and minimize expert differences (Li et al. Citation2019b). The Euclidean distance between two experts’ judgments represents the degree of divergence, and the hesitancy degree represents the fuzziness of the expert when describing the importance of the UFR indicators.
First, the experts provided judgments for the importance of UFR indicator. Hesitant fuzzy linguistic elements were then used to describe the experts’ judgments and were then transformed into the corresponding value and expanded to the same length
is denoted as the hesitant fuzzy number of expert
towards indicator
then:
(16)
(16)
The optimal evaluator weight was calculated using the optimized Euclidean distance model. To evaluate the importance of indicator the Euclidean distance between
and
namely the judgment divergence between expert
and expert
was expressed as:
(17)
(17)
If represents the weight of expert
the weighted hesitant fuzzy number of expert evaluation with the same length is expressed as
Then, the weighted sum of the Euclidean distance from expert
judgment score to expert
for the indicator is expressed as
(18)
(18)
When the degree of disagreement between the weighted hesitant fuzzy numbers is the smallest, the degree of group consensus can be maximized, and the evaluation results obtained are more objective. Therefore, the minimum Euclidean distance between experts is
(19)
(19)
The relative importance of each indicator was determined using hesitant fuzzy evaluation given by experts. The weighted calculation adopted the hesitant fuzzy weighted average operator method (Li et al. Citation2017). To ensure comparability, the original hesitant fuzzy evaluation value of each expert was extended to the same length E.
represents the weighted value of the expert weight and the expanded hesitant fuzzy number. The parameters
of the weighted average algorithm were calculated as follows:
(20)
(20)
The weights of the three aspects were calculated: disaster-causing factors (denoted ), disaster-pregnant environment (denoted
), and disaster-bearing carriers (denoted
). The weighted average algorithm was adopted based on the three parameters
(21)
(21)
3. Testing the proposed methodology
3.1. Background
The Jinjiang district is one of the five central urban areas of Chengdu (), located in the southeast of the city. It has the smallest total area of 62 km2 and the second largest population density among all districts in Chengdu (Zhou and Xiong Citation2021). The city has a humid subtropical monsoon climate with warm and humid seasons throughout the year. The northwest area of the district is flat, and the southeast has occasional shallow hills, with an average elevation of approximately 500 m (Chengdu Jinjiang District Local Chronicle Compilation Committee Office Citation2020). According to the Chengdu Water Resources Bulletin and local yearbook, there were 30 serious inundation events from 2000 to 2020. One of the highest impact events by heavy rainfall occurred on August 12, 2020, which flooded 365 roads, paralyzed traffic for nearly 12 h, affected 107,000 people, and caused 1.65 million in economic loss.
Figure 2. Location of the study area: (a) Chengdu boundary; (b) the remote sensing image of the Jinjiang district with a 4 m resolution ratio.
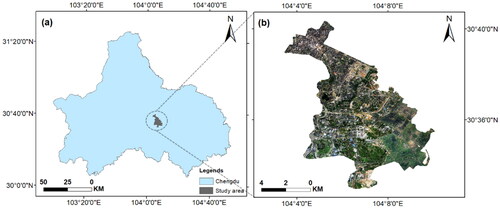
As the oldest commercial centre, the Jinjiang district was built in 1990. With a continuously increasing urbanization process during the past three decades in Chengdu, the urban built-up area of the Jinjiang district covers 37 km2. Characterized by complex water systems, a narrow downstream outlet section, and poor urban drainage conditions, the Jinjiang district has become one of the most severely affected areas under extreme rainfall conditions. In addition, the local government has vertical governmental relations but follows territorial management when dealing with urban flood risk management. The administrative divisions in the Jinjiang district correspond to 11 sub-districts covering 75 neighbourhood committees after adjustment in 2020. Therefore, we think it is necessary to assess the urban flood risk based on sub-catchments from the local level to give specific adaptation measurements.
3.2. Data collection
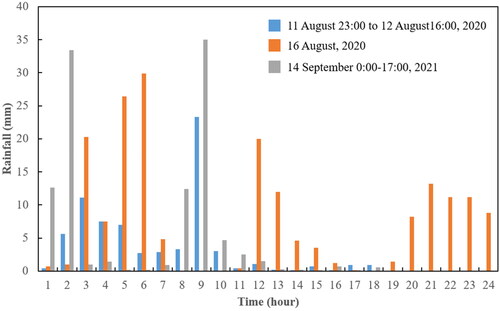
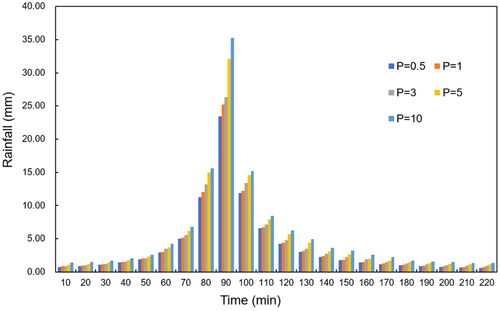
The data used in the proposed framework included topography and geomorphology as well as automatically generated drainage boundaries, calculated slopes, and regional boundaries in GIS tools. DEM data with 30-meter resolution came from the geospatial data cloud platform (Computer Network Information Center of Chinese Academy of Sciences Citation2020). The data identifier was ASTGTM_N30E104, the central longitude was 104.5, the central latitude was 30.5, the stripe number was 104, and the row number was 30. Land use data with 10-meter accuracy were downloaded from Finer Resolution Observation and Monitoring of Global Land Cover (Gong et al. Citation2020) (with file name 100E40n.tif). Hourly rainfall data for three rainfall events on August 12, 2020, August 16, 2020, and September 14, 2021, were provided by the Huiju Environment Platform (Huiju Data Citation2020), and a total of 60 rainfall datasets were downloaded at an interval of one hour, as shown in . Statistical data, such as population, per capita disposable income, number of hospitals, number of fitness facilities, and number of psychological counselling centres, were collected from the statistical bulletin of the national economic and social development of Jinjiang district, Chengdu in 2020 (Jinjiang District Bureau of Statistics Citation2021).
Figure 3. Hourly rainfall process of three urban flooding events in Jinjiang district.
3.3. Indicator value processing
The location of the drainage boundary and the outlet was determined by the terrain, flow direction, and river network, which is the basis for the sub-catchment division in the Jinjiang district. The simulation results provided indicator values for disaster-causing factors and disaster-pregnant environments.
3.3.1. Hydrological analysis and SWMM establishment
The flow direction calculation results are shown in . The flow calculation does not refer to a specific water flow calculation, but to the cumulative calculation of each grid of flow analysis results. Its purpose is to determine the flow path according to the flow direction data and obtain the accumulative amount of regional confluence. When the accumulated flow value reaches a certain value, surface runoff occurs. The river network is composed of these flow paths. Using stream definition and stream link tools, a river network diagram was obtained. Based on hydrological analysis, 224 sub-catchments were obtained using the Thiessen polygon after artificial adjustment.
Figure 4. Data processing results: (a) the flow direction; (b) the slope; (c) the land use map; (d) the 224 sub-catchments.
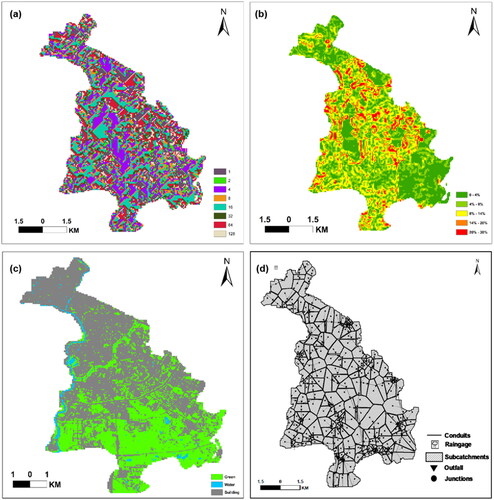
The measurement parameters, including the area, width, impervious ratio, and slope of each sub-catchment, were prepared for SWMM construction through GIS calculation. The 224 area values were automatically counted in the attribute table using the zonal geometric statistics tool, among which the maximum area was 131 ha and the minimum area was 1 ha. Because the length of the surface flow was difficult to determine accurately, the square root of the sub-catchment area was used to determine the width of the sub-catchment, assuming that each sub-catchment is a square region (Bisht et al. Citation2016). In addition, the average slope in each sub-catchment was spatially obtained, as shown in .
Rainfall infiltration and surface runoff in the study area largely depended on imperviousness, which is one of the most sensitive factors to surface runoff in the SWMM (Barco et al. Citation2008). The actual impermeability value should be calculated based on the measured ratio of the roof, concrete pavement, and other actual areas in the study area. However, this measurement was not easy to obtain. The weighted runoff coefficient method was used in this study. If there are types of land use in the
sub-catchment, and let
and
represent the area of
land types and its runoff coefficient; then the impervious ratio of each sub-catchment can be defined as:
(22)
(22)
The study area was divided into three categories: green, water, and impervious areas, as shown in . Based on the land use data, the areas were represented by the number of grids, including the region, green, roof, road, and water, obtained through the grid calculator in GIS. The different runoff coefficients were graded according to the standard for the design of the building water supply and drainage (Ministry of Housing and Urban-Rural Development of the People’s Republic of China Citation2019).
The non-measured parameters included Manning’s N of overland flow for pervious and impervious areas, depth of depression storage for impervious and pervious areas, and percentage of impervious areas with no depression. Because the simulated area belongs to a small watershed, the Horton model was selected as the infiltration model, dynamic wave was selected as the confluence model, and the initial parameters were selected by referring to the SWMM5 user manual (Rossman Citation2010). The other initial values of the non-measured parameters were selected based on the actual conditions of the study areas.
As the monitoring system of the pipeline network in the study area was imperfect, the numerical simulation lacked calibrated measured data. To verify the reliability and accuracy of the model, the comprehensive runoff coefficient method was adopted to ensure that the simulated values obtained by the established model were within the value ranges of the study area (Liu Citation2009). First, the range of the comprehensive runoff coefficient for the Jinjiang district was determined. Referencing the standard for the design of outdoor wastewater engineering (Ministry of Housing and Urban-Rural Development of the People’s Republic of China Citation2021), the Jinjiang district in Chengdu is a population agglomeration area; therefore, the average comprehensive runoff coefficient of the simulation results should be between 0.6 and 0.7. Second, a closer value of the comprehensive runoff coefficient of the Jinjiang district was calculated according to the type of underlying surface cover. The green, road, and roof grids in the study area were obtained by GIS, and their runoff coefficient values were obtained according to the code for design of outdoor wastewater engineering revised in 2016. The weighted value of the comprehensive runoff coefficient close to the actual condition of the Jinjiang district was 0.601.
Taking the comprehensive runoff coefficient of the Jinjiang district as the objective function, the non-measured parameters were constantly adjusted until a target runoff coefficient value of 0.601 was reached. An optimization process for the non-measured parameters was conducted. The simulation results of the six rounds were taken as the optimized parameters to build the model. The visualized sub-catchments, points, pipes, discharges, and rainfall events were built in the SWMM as shown in .
3.3.2. Model calibration
The coefficient of variation method was used to calculate the degree dispersion between the simulated and actual runoff coefficients. Five rainstorm scenarios with recurrence intervals of 0.5, 1, 3, 5, and 10 years () and three observational rainfall datasets () were selected to calibrate the model. The intensity of the rainfall series in five return periods was derived from the following formula for Chengdu:
(23)
(23)
where
is the rainfall intensity (
),
is the rainfall duration (
), and
is the recurrence interval (
).
Figure 5. The intensity of rainfall series in five return periods (t = 220 min, r = 0.4).
Based on the target value of the comprehensive runoff coefficient (0.601), we calculated the variation surface runoff coefficient () in . The simulated runoff coefficient fluctuated around the value of the target comprehensive runoff coefficient, and the coefficient of variation under rainfall in different return periods was lower than 15%, indicating that the established model reflected the actual situation well.
Table 1. The coefficient of variation results.
3.3.3. Indicator classification
To reduce the differences at the same level, it was necessary to determine the appropriate classification criteria for different index assignments (Ji et al. Citation2013). The Jenks natural breaks classification method (Jenks and Caspall Citation1971) is a data clustering method that was used to determine the best arrangement of median values of different classes, minimize the intra-class variance and maximize the inter-class variance (Mo et al. Citation2010). Based on the quantification values of 14 indicators for 224 sub-catchments (Table A1 in Supplementary Material), the GIS classification tool was used in this study to classify each indicator into four levels, as shown in Table A2 of the Supplementary Material.
3.4. Indicator weight calculation
A questionnaire was designed to obtain expert judgment regarding the importance of 14 indicators (https://www.wjx.cn/vj/YNndJw6.aspx). Five experts were invited, including two senior engineers from the municipal design institute and three senior researchers from the risk assessment field. The original values transformed from expert judgment and the importance matrix after attitude-neutral extension are presented in Tables A3 and A4 of the Supplementary Material. Calculated using the equations in Section 2.4, the expert weights were
the weights of the hazard-causing factor indicators
were {0.156,0.197,0.131,0.132,0.189,0.195}, the weights of the hazard-pregnant environment indicators
were
and the weights of the hazard-bearing carriers indicators
were
(Table A5 of the Supplementary Material). Among the disaster-causing factors, the runoff volume ratio, maximum inundation area, and maximum inundation time were ranked as the top three important indicators. Slope was the most important indicator of the disaster-pregnant environment, whereas population was the most important indicator of disaster-bearing carriers.
3.5. Assessment results
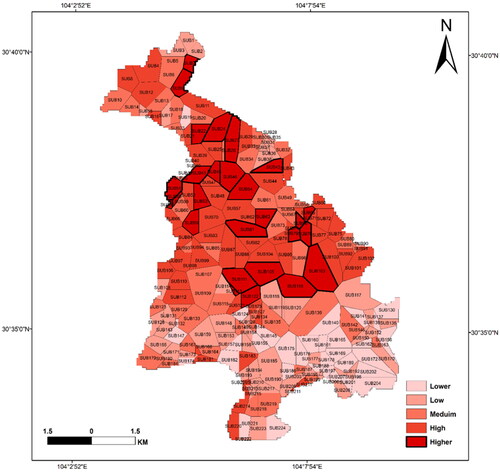
The urban flood risk values for 224 sub-catchments in the Jinjiang district were calculated using EquationEq. (1)(1)
(1) , and visualized using GIS tools, as shown in . We used the Jenks natural break classification method to classify the sub-catchment risk values into five levels: higher, high, medium, low, and lower. The four natural turning points were 6.87, 7.31, 7.73, and 8.18. There were 34 lower-risk, 60 low-risk, 47 medium-risk, 56 high-risk, and 27 higher-risk sub-catchments. The higher-risk and high-risk areas are located in the north of the Jinjiang district, which are mainly residential and commercial buildings with poor permeability and relatively low terrain. Urban parks and farmlands are distributed in the south of the Jinjiang district with strong water absorption capacity and green drainage facilities, in which low- and lower-risk areas are mainly located. Medium-risk areas are distributed in each densely built area.
Figure 6. Urban flood risk levels for the sub-catchments in Jinjiang district.
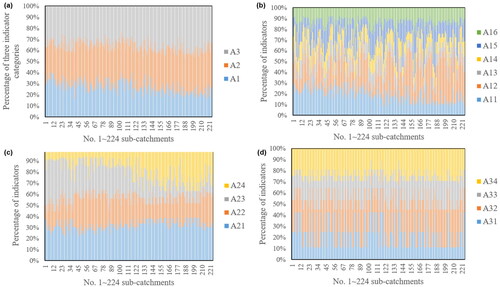
In addition, the average risk values of disaster-causing factors, disaster-pregnant environment, and disaster-bearing carriers for 224 sub-catchments were 2.05, 2.73, and 2.71, respectively, which indicates a higher risk in the urban system and social vulnerability than the heavy rainstorm as shown in . In the hazard category, the risk from the runoff volume ratio (A12) accounted for the most, followed by the runoff coefficient (A11), as shown in . In the disaster-pregnant environment, the risk from the green rate (A21) accounted for the most, as shown in . Among the disaster-bearing carriers, the risk from medical capacity (A32) accounted for the highest in .
Figure 7. Percentage contribution of indicators to urban flood risk: (a) the three categories; (b)∼(d) the indicators in each category (indicator numbers are consistent with Table A2 of the Supplementary Material).
3.6. Interpretation of higher-risk sub-districts
The 27 sub-catchments with risk values higher than 8.18, listed in Table A6 of the Supplementary Material, cover 11 sub-district offices and 19 neighbourhood committees in the Jinjiang district. The main contributors to higher-risk areas include dense buildings with aging drainage pipes that cannot withstand heavy rainfall, and varying slopes ranging from 6.5 to 18.2 that are greater than twice the average slope of 3.4 in the study area. In addition, there are cases where multiple risk sub-catchments are located in the same neighbourhood committee. Thus the percentages of 27 higher-risk sub-catchments in the 19 neighbourhood committees and 11 sub-districts provides a ranking approach for the risk hotspots at the local level. Chenglong road and Shizishan sub-districts had 17.24% of the higher-risk sub-catchments, followed by Longzhou road with 13.79%, Shuanggui road, Donghu, and Shuyuan with 10.35%, Lianxin with 6.90%, and Liujiang, Sansheng, Shahe and Jinguanyi with 3.45%. At the local level, the Shiniuyan neighbourhood committee had 13.79% of the higher-risk sub-catchments (SUB51, SUB53, SUB55, and SUB56), followed by the Jiahong road and Huangjing neighbourhood committees, which include three higher-risk sub-catchments.
4 Discussion
4.1. Validation
To validate the assessment results, we first compared the distribution of higher-risk sub-catchments with the results of Specialized Planning for Drainage Projects in the Central Urban Areas of Chengdu, completed by Chengdu Municipal Engineering Design and Research Institute in 2018. With the return period of 0.5 ∼ 1.5 year, the flood risk points in Jinjiang district were mainly located in six sub-districts, in which the Chenglong road, Shizishan, Shahe and Shuyuan sub-districts were consistent with the higher-risk sub-districts identified in Section 3.5 based on sub-catchment flood risks. Moreover, we compared the assessed flood areas with historical records of August 12–16, 2020, posted on the website of the Jinjiang district government. Public information shows that the Chenglong road and Sansheng sub-districts have suffered from flood events (Chengdu Municipal People’s Government Citation2020). Using the proposed method, Chenglong road sub-district was assessed as the highest risk area with the most higher-risk sub-catchments (Section 3.6), which indicates that the assessed results are reliable. In addition, we extracted the risk indicators of SUB81, SUB105, SUB111, SUB113, and SUB116 covered by the Chenglong road sub-district, and found that the slope (A22) in the disaster-pregnant environment had the greatest impact.
4.2. Assessment efficiency
In dealing with flood risk assessment problems with hybrid uncertainties, access to indicator sources and the processing of experts’ weighting information are critical. The SWMM and GIS tools integrated with the HFLS were used in a general MADM framework to address the closest evaluation result to the actual situation. Compared with the index system proposed by (Li et al. Citation2019c), the indicators in our study were quantitative with random and crisp values, whereas the experts’ information was fuzzy, which removed uncertainty from the indicator source. Furthermore, the SWMM built on heavy rainfall events and calibrated by five rainstorm scenarios was used to obtain the random indicator values instead of using historical data. This provides evaluation results that are consistent with the actual situation. However, compared with the SWMM-GIS approach used in (Lyu et al. Citation2019a), SWMM and GIS tools were applied following common simulation principles and focus on the novelty of aggregation with HFLS. Compared with our previous work using interval-valued terms (Ying et al. Citation2021), the integrated SWMM-GIS-HFLS approach provided a more accurate distribution of flood risk area in the Jinjiang district under the same scenario simulation condition. Moreover, the proposed approach can provide detailed spatial variability of urban sub-district flood risk rather than from the regional or city scale (Zhang et al. Citation2020), which is more in line with the territorial mode of emergency management of local governments in China.
4.3. Adaptation measures
Urban flooding prevention and control measures can be planned at the local sub-district level based on the risk evaluation results and the targeted neighbourhood committee analyzed above. First, reconstruction of the pipeline network should be prioritized according to the number of higher-risk areas covered in the sub-districts and neighbourhood committees. For example, elements such as the key nodes in the completed rainwater pipe network in Shiniuyan, Jiahong Road, and Chenglong Road should be further considered for municipal funding support. The end of the rainwater outlet from the 1st Ring Road, Yixinqiao South Street, and Haijiao Road drainage to the Jinjiang River should be optimized.
Second, a combination of nature-based solutions can be applied in residential and commercial areas (Sichuan Provincial Department of Housing and Urban-Rural Development Citation2017). For higher-risk areas with denser residential and commercial buildings, such as the Feicuicheng court in the Feicuicheng neighbourhood committee, Beverly court in the Jiahong road neighbourhood committee, Huangjing garden court in the Huangjing neighbourhood committee, green roofs accounting for 40% of the building roof area can be applied. In addition, permeable materials can be used for road reconstruction in the higher-risk areas, combined with the ecological grassland on the roadside to increase the water permeability of the road surface.
Third, hazard prevention education and physical-mental construction for residents in higher-risk areas should be strengthened by posters, brochures, WeChat, and other online ways to improve residents’ awareness of flood prevention and their ability to provide interpersonal assistance. The impact of urban flooding hazards on economic loss and physical damage may cause mental illnesses that last for a long time and cannot be quantified. High- and higher-risk areas are characterized by densely populated residential and commercial buildings. The capacity of medical and health management in the 19 neighbourhood committees, including hospitals, fitness facilities, and psychological counselling centres, needs to be reassessed.
5. Conclusion
The proposed sub-catchment-based multi-index fuzzy evaluation approach aims at flood risk management decision making at a local level. The aggregation method integrating SWMM, GIS techniques, and HFLS provides a beneficial way to assess urban flood risk in a hybrid uncertain environment. In this way, some insights for adaptation measurements to urban flood events in inland cities were derived. The main contributions of this paper are as follows: (1) an integrated comprehensive urban flood risk assessment indicator system was proposed that had random indicators in the categories of disaster-causing factors, disaster-pregnant environment, and crisp indicators in the category of disaster-bearing carriers; (2) SWMM built on the observational rainfall data from urban flood events and calibrated by five rainstorm scenarios can provide experimental values close to the real characteristics of the assessment areas for the random indicators; (3) use of HFLS in the experts’ judgments solves the problem of the uncertainty and vagueness from the subjective hesitant information; and (4) derivation of practical management priorities for local level decision-makers. The 224 sub-catchment risk assessment results show that, under conditions of heavy rainfall on August 12, 2020, the factors that contribute the most to flood risk are the green rate in the urban system and the medical capacity in the social environment. Based on the ranking of higher-risk sub-catchment percentage, the 11 sub-districts in the Jinjiang district were classified into five levels, in which the practical measures on reconstruction, LID application, and risk perception should be given priority planning and funding. Nevertheless, most areas in the Jinjiang district lack pipeline network data. In addition, the sub-catchment division cannot exactly match the neighbourhood committee boundaries. More data sources, such as the digital surface model, should therefore be applied.
Supplemental Material
Download MS Word (77.4 KB)Acknowledgments
The authors greatly appreciate Han Qian, a senior engineer from Chengdu Municipal Engineering Design and Research Institute Co., LTD. and Dr. Ruidong Li from Tsinghua University. The authors greatly appreciate all anonymous referees for their valuable and insightful suggestions.
Disclosure statement
No potential conflict of interest was reported by the author(s).
Data availability statement
The DEM data are openly available in [the geospatial data cloud platform] at [http://www.gscloud.cn], reference number [(Computer Network Information Center of Chinese Academy of Sciences Citation2020)]. The land use map is openly available in [Finer Resolution Observation and Monitoring of Global Land Cover] at [http://data.ess.tsinghua.edu.cn/], reference number [(Gong et al. Citation2020)]. The rainfall data is openly available in [Huiju Environmental Platform] at [https://hz.hjhj-e.com/home], reference number [(Huiju Data Citation2020)]. The questionnaire build by authors and used to obtain experts’ linguistic terms was online in [https://www.wjx.cn/vj/YNndJw6.aspx] with Chinese version.
Additional information
Funding
References
- Barco J, Wong KM, Stenstrom MK. 2008. Automatic calibration of the US EPA SWMM model for a large urban catchment. J Hydraul Eng. 134(4):466–474.
- Benito G, Lang M, Barriendos M, Llasat MC, Francés F, Ouarda T, Thorndycraft V, Enzel Y, Bardossy A, Coeur D. 2004. Use of systematic, palaeoflood and historical data for the improvement of flood risk estimation. Review of Scientific Methods. Natural Hazards. 31(3):623–643.
- Bisht D, Chatterjee C, Kalakoti S, Upadhyay P, Sahoo M, Panda A. 2016. Modeling urban floods and drainage using SWMM and MIKE URBAN: a case study. Nat Hazards. 84(2):749–776.
- Borujeni MP, Gitinavard H. 2017. Evaluating the sustainable mining contractor selection problems: an imprecise last aggregation preference selection index method. J Sustainable Min. 16(4):207–218.
- Brassel KE, Reif D. 2010. A procedure to generate Thiessen polygons. Geograph Anal. 11(3):289–303.
- Cai T, Li X, Ding X, Wang J, Zhan J. 2019. Flood risk assessment based on hydrodynamic model and fuzzy comprehensive evaluation with GIS technique. Int J Disaster Risk Reduct. 35:101077.
- Chengdu Jinjiang District Local Chronicle Compilation Committee Office. 2020. Jinjiang yearbook. Beijing: Xinhua Publishing House.
- Chengdu Municipal People’s Government. 2020. Platform for government information disclosure. [accessed 2023 Jan 15]. http://www.chengdu.gov.cn/.
- Computer Network Information Center of Chinese Academy of Sciences. 2020. Geospatial data cloud. [accessed 2022 May 10]. http://www.gscloud.cn.
- Ding Y, Wang P, Liu X, Zhang X, Hong L, Cao Z. 2020. Risk assessment of highway structures in natural disaster for the property insurance. Nat Hazards. 104(3):2663–2685.
- Dodman D, Hayward B, Pelling M, Castan Broto V, Chow W, Chu E, Dawson R, Khirfan L, McPhearson T, Prakash A, et al. 2022. 2022: cities, settlements and key infrastructure. In: Climate change 2022: impacts, adaptation and vulnerability. Contribution of working group II to the sixth assessment report of the intergovernmental panel on climate change. Cambridge, UK and New York, NY, USA: Cambridge University Press.
- Gangrade S, Kao S-C, Dullo TT, Kalyanapu AJ, Preston BL. 2019. Ensemble-based flood vulnerability assessment for probable maximum flood in a changing environment. J Hydrol. 576:342–355.
- Geng Y, Zheng X, Wang Z, Wang Z. 2020. Flood risk assessment in Quzhou City (China) using a coupled hydrodynamic model and fuzzy comprehensive evaluation (FCE). Nat Hazards. 100(1):133–149.
- Ghosh A, Kar SK. 2018. Application of analytical hierarchy process (AHP) for flood risk assessment: a case study in Malda district of West Bengal, India. Nat Hazards. 94(1):349–368.
- Gong P, Chen B, Li X, Liu H, Wang J, Bai Y, Chen J, Chen X, Fang L, Feng S. 2020. Mapping essential urban land use categories in China (EULUC-China): preliminary results for 2018.
- Huang X. 2020. Study on urban waterlogging vulnerability evaluation and disaster impact model. Xi’an: Xi’an University of Technology.
- Huiju Data. 2020. Huiju environmental platform. [accessed 2022 May 10]. https://hz.hjhj-e.com/home.
- Idris I, Puteh S, Hod R, Nawi A, Ahmad I, Siwar C, Taha M. 2018. Mental health disorder among post flood victims in Pahang. Asean J. Psychiatry. 19(2):1–6.
- IPCC. 2022. Climate change 2022: impacts, adaptation and vulnerability.
- Jakoubek M. 2007. Flood protection of Prague Metro after the 2002 flood. In: Barták, Hrdina, Romancov, Zlámal, editor, Proceedings of the World Tunnel Congress 2007 and 33rd ITA/AITES Annual General Assembly. p. 1303–1308.
- Jenks GF, Caspall FC. 1971. Error on choroplethic maps: definition, measurement, reduction. Ann Assoc Am Geogr. 61(2):217–244.
- Ji Z, Li N, Xie W, Wu J, Zhou Y. 2013. Comprehensive assessment of flood risk using the classification and regression tree method. Stoch Environ Res Risk Assess. 27(8):1815–1828.
- Jia H, Chen F, Pan D, Du E, Wang L, Wang N, Yang A. 2022. Flood risk management in the Yangtze River basin - comparison of 1998 and 2020 events. Int J Disaster Risk Reduct. 68:102724.
- Jinjiang District Bureau of Statistics. 2021. The 2020 national economic and social development statistical bulletin of Jinjiang district, Chengdu. Chengdu: Government of Jinjiang District. http://www.cdjinjiang.gov.cn/jjq/c132926/2022-06/02/content_f4fa17c44dc04cbf82bd7dd14bdd6494.shtml (in Chinese).
- Kogure T, 2016. Natural disaster measures on Tokyo Metro. J Disaster Res. 11(2):289–297.
- Kumar S, Kumar M. 2021. A game theoretic approach to solve multiple group decision making problems with interval-valued intuitionistic fuzzy decision matrices. Int J Manage Sci Eng Manage. 16(1):34–42.
- Liao H, Xu Z. 2014. Some new hybrid weighted aggregation operators under hesitant fuzzy multi-criteria decision making environment. J Intell Fuzzy Syst. 26(4):1601–1617.
- Liao H, Xu Z. 2015. Extended hesitant fuzzy hybrid weighted aggregation operators and their application in decision making. Soft Comput. 19(9):2551–2564.
- Liao H, Xu Z, Zeng X. 2014. Distance and similarity measures for hesitant fuzzy linguistic term sets and their application in multi-criteria decision making. Inf Sci. 271:125–142.
- Li Z, Cao Y, Zhang J, Liu W. 2021. Urban rainfall characteristics and permeable pavement structure optimization for sponge road in North China. Water Sci Technol. 83(8):1932–1945.
- Li Z, Liang X, Yin H. 2017. A multi-criteria group decision making method for elevator safety evaluation with hesitant fuzzy judgments. Appl Comput Math. 16(3):296–312.
- Liu XP. 2009. Parameter calibration method for urban rainfall-runoff model based on runoff coefficient. Water Wastewater Eng. 11:213–217.
- Li RN, Wang J, Hu ZH. 2019a. Sub-catchment division method and rainstorm waterlogging scenario modeling in north Huangpu district. Water Resour Power. 37(7):50–53.
- Li Z, Zhang Q, Liao H. 2019b. Efficient-equitable-ecological evaluation of regional water resource coordination considering both visible and virtual water. Omega. 83:223–235.
- Li Z, Zhang X, Ma Y, Feng C, Hajiyev A. 2019c. A multi-criteria decision making method for urban flood resilience evaluation with hybrid uncertainties. Int J Disaster Risk Reduct. 36:101140.
- Lyu H, Shen S. 2018. Flood risk assessment in metro system using IAHP incorporated into GIS a case study in Guangzhou Metro.
- Lyu H, Shen S, Yang J, Yin Z. 2019a. Inundation analysis of metro systems with the storm water management model incorporated into a geographical information system: a case study in Shanghai. Hydrol Earth Syst Sci. 23(10):4293–4307.
- Lyu H-M, Shen S-L, Zhou A, Yang J. 2020a. Risk assessment of mega-city infrastructures related to land subsidence using improved trapezoidal FAHP. Sci Total Environ. 717:135310.
- Lyu HM, Shen SL, Zhou A, Zhou W. 2019b. Flood risk assessment of metro systems in a subsiding environment using the interval FAHP-FCA approach [Article]. Sustainable Cities Soc. 50:101682.
- Lyu H, Sun W, Shen S, Zhou A. 2020b. Risk assessment using a new consulting process in fuzzy AHP. J Constr Eng Manage. 146(3):04019112.
- Lyu H, Zhou W, Shen S, Zhou A. 2020c. Inundation risk assessment of metro system using AHP and TFN-AHP in Shenzhen. Sustainable Cities Soc. 56:102103.
- Ministry of Housing and Urban-Rural Development of the People’s Republic of China. 2014. Technical guide for sponge city construction - construction of rainwater system for low impact development (trial). Beijing; [accessed 2022 Oct 10]. https://img6.ccement.com/2015/07/20/a9ebe6eb.pdf.
- Ministry of Housing and Urban-Rural Development of the People’s Republic of China. 2019. Standard for design of building water supply and drainage (GB 50015-2019). Beijing: China Planning Press; [accessed 2022 May 10]. http://www.jxida.com.cn/download/1585125631817543.pdf.
- Ministry of Housing and Urban-Rural Development of the People’s Republic of China. 2021. Standard for design of outdoor wastewater engineering (GB 50014-2021). [accessed 2022 May 10]. https://www.ceett.org.cn/huanbao/static/file/upload/20211112152151108.pdf.
- Ministry of Water Resources of the People’s Republic of China. 2019. Bulletin of China’s floods and droughts. Beijing: China Water Resources and Hydropower Press; [accessed 2022 Oct 10]. http://www.mwr.gov.cn/sj/tjgb/zgshzhgb/201912/t20191210_1374387.html.
- Mo J, Lu J, Li Y, Chen Y. 2010. GIS-based sensitivity assessment on environment of developing flood hazards in Guangxi Province. J Catastrophol. 25(4):33–37.
- O'Callaghan JF, Mark DM. 1984. The extraction of drainage networks from digital elevation data. Comput Vis, Graph, Image Process. 28(3):323–344.
- Othmer FJ, Becker D, Schulte LM, Greiving S. 2020. A methodological approach to municipal pluvial flood risk assessment based on a small city case study. Sustainability. 12(24):10487.
- Rodriguez RM, Martinez L, Herrera F. 2012. Hesitant fuzzy linguistic term sets for decision making. IEEE Trans Fuzzy Syst. 20(1):109–119.
- Rossman LA. 2010. Storm water management model user’s manual, version 5.0. National Risk Management Research Laboratory, Office of Research and Development, US Environmental Protection Agency.
- Rossman LA, Huber WC. 2016. Storm water management model reference manual volume I - hydrology. US Environmental Protection Agency. Vol. 3.
- Shi P. 1996. Theory and practice of disaster study. J Nat Disasters. 5(4):6–17.
- Shi P. 2002. Theory on disaster science and disaster dynamics. J Nat Disasters. 11(3):1–9.
- Sichuan Provincial Department of Housing and Urban-Rural Development. 2017. Design standard for rainwater management and utilization of low impact development projects in Sichuan Province (DBJ51/T 084-2017). Vol. 2022. Chengdu: Southwest Jiaotong University Press.
- State Council Disaster Investigation Team. 2022. An investigation report on the “720” heavy rain disaster in Zhengzhou, Henan Province. [accessed 2022 Oct 10]. https://www.mem.gov.cn/gk/sgcc/tbzdsgdcbg/202201/P020220121639049697767.pdf.
- Torra V. 2010. Hesitant fuzzy sets. Int J Intell Syst. 25(6):529–539.
- United Nations Human Settlements Programme (UN-Habitat). 2022. World city report 2022: envisaging the future of cities. Nairobi.
- Wendling LA, Holt EE. 2020. Integrating engineered and nature-based solutions for urban stormwater management. In: O’Bannon D, editor. Women in Water Quality. Cham: Springer; p. 23–46.
- Wisner B, Blaikie P, Cannon T, Davis I. 2014. At risk: natural hazards, people’s vulnerability and disasters. UK: Routledge.
- Xu Z, Chen H, Ren M, Cheng T. 2020. Progress on disaster mechanism and risk assessment of urban flood/waterlogging disasters in China. Adv Water Sci. 31(5):713–724.
- Xu Q, Han L, Xu K. 2022. Causal analysis and prevention measures for extreme heavy rainstorms in Zhengzhou to protect human health. Behav Sci (Basel). 12(6):176.
- Yang JL, Xu YJ, Liang J, Tang Y, Liu ZL. 2022. Subcatchment division and simulation precision of rainwater pipe network model. South-to-North Water Transfers Water Sci Technol. 20(2):338–351.
- Ying X, Ni T, Lu M. 2021. Comprehensive weighted risk assessment based on GIS and SWMM in Chengdu, China. International Conference on Applied Mathematics, Modeling and Computer Simulation, AMMCS 2021, November 13–14, 2021; Virtual, Online. IOS Press BV.
- Zhang D, Shi X, Xu H, Jing Q, Pan X, Liu T, Wang H, Hou H. 2020. A GIS-based spatial multi-index model for flood risk assessment in the Yangtze River Basin, China. Environ Impact Assess Rev. 83:106397.
- Zhou Y, Li Z, Meng Y, Li Z, Zhong M. 2021. Analyzing spatio-temporal impacts of extreme rainfall events on metro ridership characteristics. Physica A. 577:126053.
- Zhou J, Shen R. 2013. Dictionary of soil science. Beijing: Science Press.
- Zhou L, Xiong Y. 2021. Chengdu yearbook. Chengdu: Chengdu Press.