
 ?Mathematical formulae have been encoded as MathML and are displayed in this HTML version using MathJax in order to improve their display. Uncheck the box to turn MathJax off. This feature requires Javascript. Click on a formula to zoom.
Abstract
This research compares the use of the SAR (Sentinel-1) and Optical (Sentinel-2) sensors in identifying and mapping burnt and unburnt scars are rising during a bushfire in southeastern Australia and Margalla Hills, Islamabad, Pakistan, in 2019 and 2020. In order to evaluate the backscatter strength along with the Polarimetric decomposition portion, the C-band dual-polarized Sentinel-1 data was investigated to determine the magnitude of the burnt areas of forest cover in the study area. We could derive texture measurements from locally-based statistics using the Grey Level Co-occurrence Matrix (GLCM) and the backscatter coefficient. This was because of how well it picked up on differences in texture between burned and unburned scars. In contrast, Sentinel-2 optical remote sensing was employed to evaluate the extent of the burnt intensity levels for both regions utilizing the differential Normalized Burnt Ratio (dNBR). A Support Vector Machine (SVM) and Markov Random Field (MRF) classifier were utilized to investigate the study’s context. The ideal smoothing parameter is the result of incorporating the image’s spectral characteristics and spatial meaning. Sentinel-2 images were used as a foundation for both the test and training datasets, which were built from images of both unburned and burned areas broken down pixel by pixel. In both types, including spectral sensitivity and sensitivity of Polarimetric for the two groups identified after classification, the experimental findings showed a clear association between them. The algorithm’s efficiency was evaluated using the kappa coefficient and F-score calculation. Except for Sentinel-1 data in Pakistan, all fire areas have more than 0.80 accuracies. The highest precision of both Sentinel-1 and Sentinel-2 was also provided by the performance of users’ and producers’ accuracy. The entropy alpha decomposition helped define the target given by the H-a plane based on its physical properties. After the burn, the entropy and alpha values diminished and formed a pattern. However, the findings in this field validate the effectiveness of SAR sensors data and optical satellite in forest applications. The related sensitivity is highly dependent on the composition of the landscape, the geographical nature of the study area, and the severity of the burn.
1. Introduction
Fire scars on surface reflectance features were observed and tracked using Remote Sensing (RS). RS has been an accurate method since the early 1980s in predicting burnt intensity levels in areas impacted by the fire at scales of local and regional (Kalogirou et al. Citation2014; Engelbrecht et al. Citation2017; Tariq et al. Citation2022). Environmental parameters were assessed before and after the fire using space and airborne sensors to determine the spectrum shifts of forest fire and to probe their impact on vegetation (Kontoes et al. Citation2009; Hirschmugl et al. Citation2020). Landsat imagery is one type of optical sensor that has been utilized for both experimental purposes and assessments of burned areas (Boschetti et al. Citation2015), MODIS (Liang et al. Citation2008), AVHRR (Salvador et al. Citation2000), SPOT (Tansey Citation2004) and recently Sentinel-2 Multispectral Instrument (MSI). The optical sensors described above have been commonly used in terms of spectral and temporal resolution due to their high accuracy (Palacios-Orueta et al. Citation2012). To study the effects of fires on greenhouse gases, particles, and aerosols, map burned regions at a spatial resolution of 10-30 meters has become increasingly important (Tansey Citation2004; Tariq et al. Citation2021). As a result of this information, post-fire measures and an approach to environmental management were developed.
Most imaging of the burning area sought to track the post-fire spectral variations (Giglio et al. Citation2006; Gitas et al. Citation2012); while they demonstrated differences in the space and time of the burn, these changes were detected using the optical wavelength bands. Two signs can be divided into the post-fire features of forest fires; the development and accumulation or modification of the plant canopies and vegetation structure (scar) (Gitas et al. Citation2012; Tariq et al. Citation2021). It was clarified that forest pre-fire satellite images typically represent high reflectance in the NIR area when post-fire reflectance decreases (Schroeder et al. Citation2016; Tariq et al. Citation2021). Manual identification and identification of burnt scars (Huang and Siegert Citation2004) and DTC involve different burnt area analysis approaches. The approach was practical and produced high thematic and high precision results but could have been more reliable when data changed. The ANN used the sensor of MODIS data to identify areas at increased fire risk in Brazil’s Amazon region (Gitas et al. Citation2012; dos Santos et al. Citation2018). The majority of the effort involved analyzing burned area mapping and fire intensity assessments by comparing pre-and post-fire images for spectral differences. To observe such variations, indices based on spectral including normalized burnt ratio, Mid-infrared Burn Index (MIRBI) (Bastarrika et al. Citation2011), Burnt Area Index (BAI) (Stroppiana et al. Citation2012), and Global Environmental Monitoring Index (GEMI) were widely used.
However, because cloud pollution makes these methods difficult to use, it can be challenging to gather sufficient pre- and post-fire images for direct study. Secondly, the burnt area shows geographical and spectral variety due to the intensity of the burning, the period gap between dates of image collection, fire dates, and current forms of vegetation (Gitas et al. Citation2012; Stroppiana et al. Citation2012; dos Santos et al. Citation2018; Arjasakusuma et al. Citation2022). Backscatter strength was used to differentiate between burnt and unburned scars, and sensitivity analysis of the GLCM characteristics revealed that homogeneity, contrast, and entropy were the most significant statistical features (Rao et al. Citation2002; Lee et al. Citation2021; Tariq et al. Citation2021; Arjasakusuma et al. Citation2022; De Luca et al. Citation2022; De Petris et al. Citation2022). After determining the optimal orientation based on the primary parameters, including the number of quantization thresholds, the frame size, and the pixel pair’s sampling distance, we reached this result. Using Sentinel-1 for burnt and unburnt scar discrimination strongly depended on the angle of local-based incidence, the geometry of acquisition, and environmental factors. The low incidence angles in hilly areas revealed a high degree of discrimination in burnt compared to the unburnt regions relative to the high incidence angles. There was a higher disparity between the percentage of unburned and burned land on front slopes in hilly locations, indicating the influence of topography (Menges et al. Citation2004; Small et al. Citation2011).
In addition, the European Space Agency (ESA) provides the public with the Sentinel application platform (SNAP) (De Luca et al. Citation2021), a free and open-source software platform that includes the toolboxes required for pre-processing and processing Sentinel data. Python is one of the most popular remote sensing and scientific analysis languages and is widely used in both operational and scientific domains (Uwe et al. Citation2013). The ESA SNAP-Python (snappy) interface allows users to access the SNAP toolboxes, originally written in Java, from within the Python programming language (Baillarin et al. Citation2012).
In addition to SAR and optical data, SAR active sensors have shown promising performance in mapping burned areas and estimating fire effects (Chuvieco et al. Citation2002; Van Tricht et al. Citation2018; Sharifi et al. Citation2022). Changes in vegetation cover, shape, size, and direction of the canopy scatterers, soil structure, and moisture content influence the Earth’s microwave backscatter, making it an ideal system for distinguishing surface alterations (Polychronaki et al. Citation2013). The SAR backscatter can be affected by several variables, including wavelength, polarization, the satellite sensor’s orbit, and the topographic properties of the Earth’s surface at the local level. Polarization is a fundamental sensor property that affects how burned vegetation scatters SAR signals (Arjasakusuma et al. Citation2022). Due to its greater sensitivity to the lower contribution of volumetric dispersion and moisture content, cross-polarized backscatter [vertical-horizontal (VH) and horizontal-vertical (HV)] reduces after a fire occurrence in a Mediterranean context, which is characterized by drier sea water.
In contrast, more soil exposure following the fire event may cause the co-polarized signal to exhibit an increase in backscatter [vertical-vertical (VV) or horizontal-horizontal (HH)] (De Luca et al. Citation2021). Even though this conclusion has been verified by several studies, the literature demonstrates how distinct backscatter behaviors can be observed for vegetation that has been impacted by fire and is influenced by local environmental variables. Some authors have used multi-polarimetric indices, such as the widely used radar vegetation index (RVI), to preserve the information offered by two different polarizations for various research goals concerning environmental monitoring.
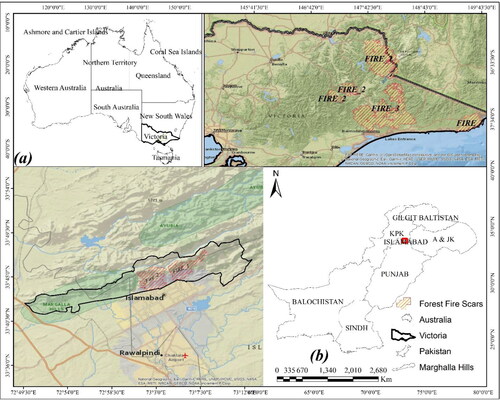
Our study focused on two specific locations: Margalla Hills, Pakistan and, Victoria, Australia. The following factors affected the choice of our research areas; first, they periodically encounter extreme wildfires that have significantly affected environmental and economic destruction and human lives. Therefore, it will also be necessary to investigate the reasons for fires and the steps to reduce potential fires and preserve forest ecology. Second, they have a forest system that quikly affects fire propagation. Third, they have several spatial patterns that will interest our study in learning how and region reacts to fire events. Fourthly, the recent outbreak of forest fires may be of concern to our study. Finally, owing to recent fire events, the availability of the newly deployed SAR and optical RS timeframe satellite missions will make datasets appropriate and usable for research regions.
Geographical location, incredibly steep areas in Pakistan and Australia due to vegetation changes, primarly determined the gathering of fire zones in both areas. For Victoria, Australia, a Victoria bushfire archive containing reported and modified bushfires were used from 1939 to 2020. The database provided details of all the burns and bushfires in the region in vector shapefile format, including their date of occurrence, intensity degree, coverage area, fireplace, method, type of fire, and season along with the precision of the method used in the resolution.
This lead to the fact that the severity of the fire and its impact on the nature of the vegetation significantly influence Radar sensor sensitvity in the study of forest structure variations during a bushfire. Optical data can also be used as a replacement in such situations, as it showed high spectral resilience to changes in the Australian heat, regardless of the fire intensity. However, the findings in this field validate the effectiveness of SAR sensor data and optical satellites in forest applications. The related sensitivity highly depends on the landscape’s composition, the study area’s geographical nature, and the burn’s severity. This research compares the use of the SAR and Optical sensors in identifying and mapping burnt and unburnt scars rising during bush fires in Australian forest, Victoria, and Margalla Hills, Islamabad, Pakistan, from 2019 and 2020.
2. Description of the study area
2.1. Australian study area
Victoria can be found in the southeastern part of Australia. Covering an area of about 240,451 km2, it is the largest single country in the world. It features a variety of climates, from hot in the northwest to semi-arid and frigid on the coast (Attiwill and Adams Citation2013). It is located at 34˚.20′ S and 39˚.00′ S and between longitudes 141˚.00′ E and 150˚.00′ E (see ). There are frequent bushfires in Victoria, Australia, which are considered a natural part of the Australian landscape. This is due to the summertime hot and dry atmosphere. Many of the bushfires have devastated a greater number of houses, human lives, and infrastructure. The thick eucalyptus forest has been ravaged by destructive bushfires, which have spread through the forest due to the presence of flammable oils in the leaves, which regenerate quickly after a fire, and which can be found in all the temperature zones of the various continents.
Figure 1. The study’s target blazes; a) from the Victoria, Australia database of forest fire from 2019–2020, b) from the Margalla Hills, Pakistan database from 2019 and 2020.
Trees in the eucalyptus family range in height from medium to high and can be found in both open and closed forests (Gütlein et al. Citation2013). Rising temperatures and severe droughts increase the occurrence and severity of fires, which depend heavily on fuel masses, storm conditions, and landscape, all of which differ significantly in south eastern Austrailia (Menges et al. Citation2004). Three extensive bushfires in 2003, 2006-2007, and 2009 seriously destroyed around 2.60 million ha of timber. It is estimated that nearly 50% of the 8.6 mh of land burnt between 1962 and 2014 mainly happened in 2003 (Jenkins et al. Citation2016).
2.2. Study area of Pakistan
Margalla Hills National Park exists in the northeastern part of the territory of Islamabad capital, Pakistan, with a total occupied area of 15,883 hectares (Abidi et al. Citation2013), as shown in . The capital boundary behind which lies the district of Haripur (KPK) is bounded to the north by the Park between 33, 043'N to 72, 055'E. A massive reforestation process in Margalla hills since 1970 has found that the dense forest has covered 45% of the land, of which the deciduous rea is 29%, coniferous is 39%, and the remaining 28% is mixed. The area’s topography is undulating and rough, consisting of steep slopes and gullies. The region ranges from steep to precipitous, primarily consisting of steep slopes and gullies ranging from 465 m to 1600 m in altitude (Abidi et al. Citation2013). The shade is mainly greenish-brown, and the substaintial calcareous is greyish-blue. The region has a sub-tropical climate with mild summers and winters. The average temperature is 34.3 °C in summer and 8.4 °C in winter. Snow is rare in winter, with an average rainfall of 1200 mm per year (Sowter et al. Citation2016). The geospatial forest fire data (i.e. extent and area, fire frequency spatial location, date of occurrence, and causes) from 2019-2020 were obtained from the Islamabad Capital Development Authority (CDA). The CDA also provided data on forest fires from November 2019 to June 2020 in the form of point and area shape files.
3. Material and methods
3.1. Datasets
In addition, four bushfires were derived from the dataset between 2019 and 2020 using the standard that they were forest fire, their date of occurrence was recent (2019/2020), and the highest burning intensity rating in the sample ().
Table 1. Explanation of fire zones in Victoria, Australia and Margalla Hills, Islamabad, Pakistan.
In Pakistan, the data was provided by Capital Development Authority, Islamabad (CDA, 2020) (Tariq et al. Citation2021). We obtained two fire zones situated in the Margalla hills, Pakistan. The data included the fire perimeter areas of the two zones, as well as a summary of the fire path, the ground cover, and the landscape of the zones. Recent fires have also occurred in 2019 and 2020, as mentioned in .
The SAR dataset included a sequence of co-polarized VV and cross-polarized VH Ground Range Detected (GRD) measurements acquired using Interferometric Wide (IW) mode on the Sentinel-1-A/B satellites. The time series spanned the months of November 2019 to July 2020, just before the November 2019 fire occurrence, and included 82 images derived from ascending (42 images) and descending (40 images) flight trajectories (). Because of its proximity to the fire incidence, this month was selected because its vegetation conditions are most likely to have been analogous to those during the disaster. These images were taken in IW mode, which records the backscattered SAR signal’s amplitude and phase.
Table 2. A description of the fire zones in the Australian and Pakistan.
The optical Sentinel-2 Level-2A (Bottom-Of-Atmosphere, BOA) multispectral time series comprised 64 images and was based on the same period as the Sentinel-1 dataset (November 2019 – July 2020). Subsequently, an average monthly value was determined for each band. During the download phase, the system semi-automatically resampled the image to a pixel size of m by defaulting to the nearest neighbor resampling procedure and setting the scale parameter (pixel resampled size = 10). The projection system used was EPSG: 32,629. There was cloud cover in every single photograph up until this point, so we have one image for each month and each band from April 2017 to August 2018. (as the final SAR dataset) ().
3.2. Methodology
3.2.1. Pre-processing of Sentinel-1 data
The software of Sentinel Application Platform (SNAP) received in the product of Single-Look Complex (SLC) comprising phase details contains the key pre-processing phases of the dual-polarized channel Sentinel-1 (Small et al. Citation1998; Schepers et al. Citation2014). The SLC image’s key pre-processing steps include the following: Radiometric calibration is the process of correcting the pixel values considering an actual reflection of the reflected surface backscatter of radar. In addition, the absolute calibration vector is used in the image produced as an annotation that enables image intensity values to be transformed into Digital Number (DN) values (Tanase et al. Citation2010). About the azimuth time, the deburst operator produces a continuous image by eliminating the duplicate lines of bursts with black lines (Yonezawa et al. Citation2012). The contribution is the Sentinel-1 TOPSAR-Deburst operator, the image of SLC-IW with several sub-swaths, its polarization strength values of VH and VV, and the SLC image deburst output. Later the debursting process on all bands, the goal product commonly has one dimension and related geocoding.
3.2.2. Pre-processing of Sentinel-2 data
The Sentinel-2A-2B images with Level 1 C. This study makes use of MSI, which was obtained directly from the ESA for use in this investigation. These images refer to items at 1 C level-1, which are not corrected TOA radiometrically and geometrically. The introduced corrections include the orthorectification process and, for subpixel precision, the process of spatial registration on the global reference scheme (projections of UTM/WGS84). Sen2cor provides the facility of pre-processing on the Top-of-Atmosphere (TOA) images with scene classification for the correction of atmosphere, landscape, and cirrus, which was used for atmospheric correction. After that, it converts the reflectance product L2A, Bottom-of-Atmosphere (BOA), to the orthoimage (Cloude and Pottier Citation1996). The spatial resolution of the L2A products ranged from 10 m to 60 m based on spectral bands, but using nearest neighbour resampling, the images were resampled to 10 m resolution. All the images were cloud-free, so deleting cloud pixels did not require a cloud mask. The top reflectance images of the atmosphere have been converted to surface reflectance images. These surface reflectance images were sub-set to the chosen fire, and pre-and post-fire images were computed with NBR accompanied by dNBR.
3.2.3. Accuracy assessment
The sites for training sampling are achieved firstly by visually reading both types of images pre and post the burn and secondly by digitizing training set in the form of the vector using ArcMap 10.8. Since there was no ground truth data, a study of Sentinel-2 images would serve as a reference dataset, even though collecting validation sets is the dNBR from the vegetation indices. The RGB post-fire images in are also included. The consistency is assessed according to the particular evaluation of the unsupervised classification. This assures the accurate recognition of a pattern of ground cover. Using a random sampling technique, the training and evaluation sets are segregated (). Two-thirds of the cumulative data were found in the instruction sets and one-third in the evaluation collection. Using a k-fold cross-validation, which use duplicated sampling to eliminate sampling biases, you may put your data to the test by utilizing the whole set of training samples (Fernández-Manso et al. Citation2016). The Sentinel-1 is used to map the areas affected by burns and unburnt areas and to access unburnt patches’ functionality and spectral properties. Reason being, it incorporates backscatter knowledge that adjusts to the tree’s structural properties. It displays precise and consistent information on the location and scale of the unburnt patches, the area of flora found in the unburnt patches, according to various reflectance properties and spatial distribution (Cloude and Pottier Citation1996).
3.3. Methods
3.3.1. Scattering matrix generation [C2]
The use of software (SNAP) was to develop the dual-Polarimetric matrix scattering. Knowledge of single co- and cross-polarization (VV and VH) is found in the coherent matrix [S] (Cloude and Pottier Citation1996). For every polarization, this Equationeq.1
(1)
(1) defines the relationship between the electromagnetic wave emitted and transmitted at the cellular resolution (Antropov et al. Citation2016).
(1)
(1)
The distributed matrix calculates each variable in the complex form in phase and amplitude. The co and cross-polarized elements are represented by the diagonal and off-diagonal elements, respectively.
3.3.2. Polarimetric decomposition
When comparing times before and after a fire, the objective decomposition theorem can be utilized to quantify a drop in back dispersion strength. Polarimetric decomposition of the destination would be dual (VV/VH) and the second intensity would be the Polarimetric decomposition.As defined in (Cloude and Pottier Citation1997), the auto composition of the covariance matrix will be carried out. The biggest benefit is that it gives a straightforward explanation of the signal processing principle and the measurement of covariance matrix noise. The H-alpha-dual decomposition is the incoherent degradation as an input for the decomposition of the Entropy/Alpha dual polarization generated by the coherence matrix in sentinel-1. It is used to differentiate between three dispersions, namely the isotropic, longitudinal, and isotropic dihedral surfaces. Three parameters are derived from the ratio of own quantities, namely Entropy H, which calculates the scatter randomness (Cloude and Pottier Citation1997). Anisotropy A provides more entropy data and allows dispersed systems to be understood. Alpha offers key mechanisms for scattering the surface
scattering of dipole
and mechanism of dihedral scattering
3.3.3. Support vector machine
These machines are classifiers based on non-parametric often used and specified for classification and the analysis of regression (Li et al. Citation2022). It is a method of statistical learning that requires less data for training in order to determine the best possible hyperplane and maximize the separation between two groups (Vapnik Citation2006). The analytical error introduced by the training data is minimized using SVM as the distance between the hyperplane and the training samples is optimized. In order to distinguish between the various educational modalities, the learning mechanism uses an iterative process to establish a threshold of judgment (Kavzoglu and Colkesen Citation2009). Using the regularization parameter, the influence of inseparable samples is achieved. A concise overview of SVM work is defined by (Lentile et al. Citation2009).
The dividing hyperplane is defined as Attempting to find the separation of maximum rate between the two nearest vectors, and Equationeq. 2
(2)
(2) is signified in the case where
= hyperplane point,
= hyperplane marginal point distance from the origin to the point on the hyperplane.
(2)
(2)
The SVM's goal is to optimize the margin amid two groups, expressed as two parallel hyperplanes passing through the nearest training sample represented in Equationeq.3(3)
(3) and Equation4
(4)
(4) along the main separating hyperplane. The better point can be assessed where
has the least weight vector.
(3)
(3)
(4)
(4)
However, a restriction is expressed in Equationeq. 5(5)
(5) in the attempt to optimize the margin between the hyperplane and the nearest samples:
(5)
(5)
Whereby is the degree of slackness that makes any mistake in misclassification, and the parameter of
regularisation influences the rate in our sample of misclassification.
3.3.4. Markov random field (MRF)
In the profound understanding of contextual knowledge, Markov Random Field (MRF) is a commonly regarded technique (Wang et al. Citation2013). This is because contextual data, in contrast to the adjacent pixels, corresponds to a functional relationship. The major application of MRF has been remote sensing image processing, textural analysis, and edge detection algorithm to improve image classification accuracy (Jackson and Landgrebe Citation2002). MRF and its formulation are illustrated in (Escuin et al. Citation2008).
At the same time, represents values of the Digital Number (DN) known as a random field. The dependency is high for
mark on potential groups identified by the consumer, including forests, agriculture, bare land, water, etc. A field on random selection is known to apply to a neighbourhood structure and is thus known as Markov Random Field as the following conditions are satisfied only by its probability density function;
Positivity: (w) > 0 means there is no label configuration with impossibility.
Markovianity:
This suggests that the pixel label’s membership is heavily contingent on its neighbourhood.
Homogeneity:
3.4. Validation
For improved interpretation and search and burning and unburning patches, the spectral index NBR is used to detect burnt and unburned areas in Sentinel-2 images (Malik and Husain Citation2003). The NBR is used to classify burned areas following woodland fires and is measured as seen in Equationeq. 8(8)
(8) . Its formulation applies to the regular vegetation gap index (NDVI). However, it is somewhat different (Won et al. Citation2014). The NIR is represented in vegetation while SWIR is low, but the SWIR represents stronger than the NIR following burn.
(8)
(8)
Due to NBR, forest regeneration with time aspect tests the relation between pre- and post-fire images.
(9)
(9)
After detecting the difference between images of the fire area before and after the burning, as seen in Equationeq. 9(9)
(9) , to develop the degree of burnt intensity, the effect is used, which would include five key groups (1) unburned areas, (2) slightly burned areas, (3) medium range burned areas, (4) deep burned areas, and (5) regrowth after the fire (Won et al. Citation2014). Validation is an important aspect of any classification since it evaluates the accuracy of the data, and the pixels in an image can be identified correctly or not properly. The validation sets are selected compared to the vegetation index (dNBR), which measures the discrepancy between two images in fire (before/after) areas in Equationeq. 9
(9)
(9) .
A random function collection of validation points and all these points were minimize data fragmentation. Validation points were used to evaluate the SVM-MRF classification ability to assign new pixels to new datasets. The final step in ensuring accuracy is checking the findings against training and test data. Accuracy measurement considers the classification data’s PA, UA, OA, and Kc and uses the wrongly graded pixel error matrix. The quality and recall assessment criteria will also be evaluated, as per Powers (Arpaci et al. Citation2014), to determine the validity of our system of SVM classification. Precision (P) is a calculation of the accuracy of the classifier, determined by using the true positive number over the true positive number adding the false positive number
(10)
(10)
Recall () is a calculation of the completeness of the classifiers and is determined by using the true positive number over true positive number
adding the false negative numbers
(11)
(11)
The score of F1 indicates the equilibrium between accuracy and recall is determined as follows;
(12)
(12)
3.5. Spatial texture analysis
Texture analysis is conducted on each backscatter during the pre-processing steps. As texture analysis reveals the spatial relationship of grey levels in a picture, it is a vital component of on-the-ground object detection (McCaw Citation2013). In many RS applications, it increases the precision of interpretation in classification. This provides critical SAR imagery knowledge (Ricotta et al. Citation2018). In this analysis, GLCM is introduced to achieve statistical texture characteristics. A second-ordered statistical texture analysis approach, the GLCM, is also used in texture classification and segmentation (McCaw Citation2013).
With relation to the particular lag interval at with an orientation of
the texture measurements represent the grey level spatial distribution value and also its homogeneity with each. At origin, 14 texture characteristics have been derived from the GLCM characteristics origin, but seven specied are very important in remote sensing image processing. The attributes, as seen in , are as follows.
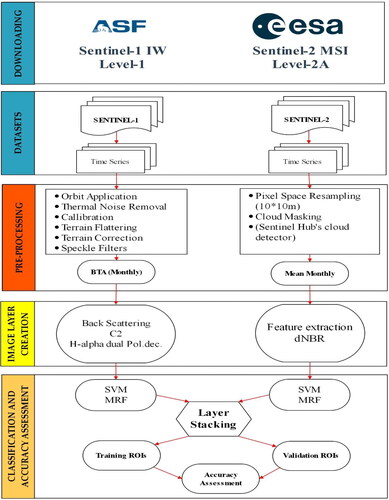
Figure 2. The process flow for the actualized procedure, using open-source software and time-lapse data from Sentinel-1 and Sentinel-2.
3.6. Comparison of dataset combinations
In addition to the integrated SAR and Optical dataset (main target of this study), the entire classification process and subsequent accuracy assessment was applied using each of the two single SAR and optical datasets, in order to compare the results and evaluate how effectively the integration of the two types of information can improve the outcomes. The optimal SVM-MRF parameter values and the feature importance were also computed for each Sentinel-1 and Sentinel-2 datasets.
4. Results
4.1. Spectral indices according to optical data
The south eastern autralian forest fire database provided a shapefile showing the fire perimeter and the degrees of intensity distribution within it, enabling quicker decision-making of the process, as seen in . Capital development authority also provided shape files that display the fire paprametrs in degree in . The images from Sentinel-1 and Sentinel-2 were taken a month before and a month after the fires were recorded in the Pakistan and Australian regions, respectively. As rapid adjustments were required, once there was distinguished fire to assess its intensity, the desired time zone of image acquisition was possible.
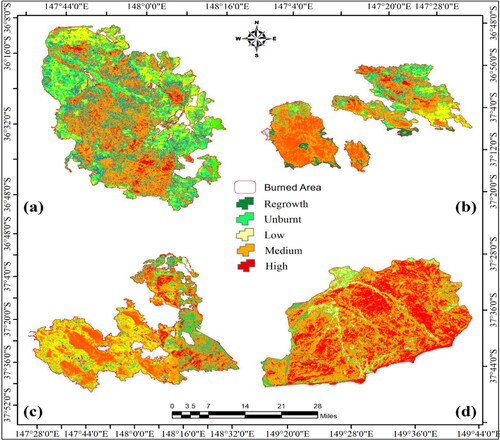
In analyzing Australian bushfire data results, fire scar distinction using optically dependent indices was achievable. The south-Australian forest fire burnt intensity estimate was correct for extremely burnt and medium burnt areas, but there was a classified mistake for lower areas and sites of unburned sites. As a methodological guide, the classification based on a threshold using dNBR was processed to achieve burned intensity maps for Australia. By contrasting pre-and post-fire satellite images, the burned intensity using Sentinel-2 data was generated as this demonstrated the ability of numerous spectral bands to detect burned areas. It was shown that places with a high degree of burnt vegetation had a higher index of burnt ratio, and that forest regeneration was slower in these areas.
According to dNBR's findings, the unburned pixels reflected ideal values very near to zero. As far as burned pixels are concerned, the optimum dNBR values show considerably high values, hitting a mean value of 0.80. The types which are part of the index were categorized, as seen in Supplementary Table 2, into five groups. A larger proportion of bushfires was indicated on the eastern side between medium and extremely burned areas, while in other areas was between medium and low burned areas, as shown in . However, in the classification process, there are some errors in the severity level of burn, specifically the areas with medium and high burn, which were complex to distinguish into two grades, including the less burned areas and areas with no burn.
Figure 3. dNBR from Sentinel-2 of fire zones: a) Aus_f_1, b) Aus_f_2, c) Aus_f_3 and d) Aus_f_4, respectively of Victoria, Australia.
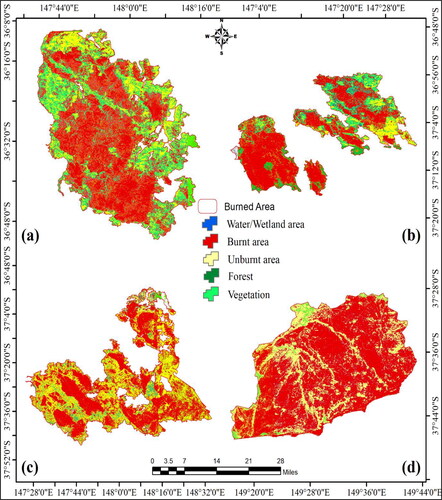
The results of vegetation indices also classify the fire zone based on land cover groups found by the nonlinear process of classification of the SVM. displays the results’ optical data organized into two classes, which were provided to facilitate comparisons between the SAR and optical ability to distinguish between burnt and unburned patches.
Figure 4. Australian fire zones a), Aus_f_1, b), Aus_f_2, and c), Aus_f_3, and d) Aus_f_4 were classified using SVM from Sentinel-2 imagery. Area created by the burnt ratio index is depicted as bushfires in .
Similarly to , a burnt-ratio index was used to compare and contrast photographs taken before and after a fire in Pakistan. Both fire zones in indicated five burned intensity levels, as shown in images of Australian bushfires. In both the Pakistani and Australian findings, it was observed that there was visual contrast within the burned zones, which hints to spatial trends and effect variation. Initial review of Pakistan results showed significant dNBR values in burned areas compared to very low values in unburned areas. Burned and unburned areas were easily distinguishable from one another, however differentiating between areas of moderate and low severity was quite challenging. In fire Pak_f_1, (a) most burns occurred in high-to-medium extreme burn regions, while most burns occurred between medium-to-low severities in fire Pak_f_2 (b). In comparison, in both fire zones (a) and (b), there was a high misclassification of low-intensity levels and unburnt areas; comparable results were observed in Australian bushfires.
Figure 5. Sentinel-2 dNBR of fire zones (a) Pak_f_1 and (b) Pak_f_2 in Pakistan, respectively. Calculated by comparing pre-and post-fire images to show improvements in the region affected by forest fires.
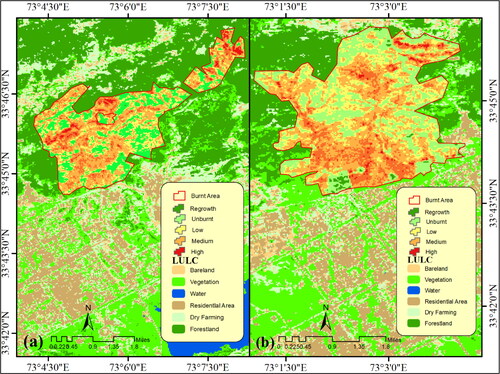
Table 3. Findings of SVM (%) and SVM_MRF(%) classification for the optical and radar kappa coefficients covering Australia and Pakistan.
4.2. Radar data analysis
The real and imaginary portions of were the Polarimetric characteristics used for classification. Burnt and unburnt areas were two groups specifically defined for the study. Using the intensity of backscatter for south eastern Austrailia, Aus_f_1 type was feasible for visually deciding burnt and unburnt patches in Sentinel-1. In the case of Aus_fire_2 type, Aus_f_3 and Aus_f_4, the variation is not very visible. In Pakistan, a similar situation was used in distinguishing burnt and unburnt patches based on Pak_f_1 and Pak_f_2. Thus, for all the fire areas, the decomposed images of H-Alpha based on the composition of RGB were used. This resulted in a kind of trend contrasting pre fire and post fire images that showed its vulnerability to changes in forest structure. Red color was allocated to entropy; green represents the alpha values for anisotropy. represent Victoria, Australia, and Margalla hills, Pakistan, respectively.
As the entropy increased by the burned severity and decreased alpha values, this was attributed to a reduced randomness effect in scattering and an improved scattering process controlled by the surface. Integrating Polarimetric decomposition and backscatter was sensitive to differentiate the burnt and unburnt patches. With burnt intensity, there was an increase in C-band Sentinel-1 co-polarized backscatter (VV), although, with burning severity, there was a decrease in cross-polarized (VH) backscatter. For the C-band backscatter, poor sensitivity to forest regrowth was found, with much of it listed as burnt areas. This is attributed to branches, charred leaves, and trunks of trees leaving dry soil in some places. Volumetric dispersion describes most of the unburnt forest and its low intensity, as foreseen in . When making maps of burned and unburned areas with Sentinel-1, the topographic effects of local indices and angles determined by the backscatter coefficient posed the biggest challenge.
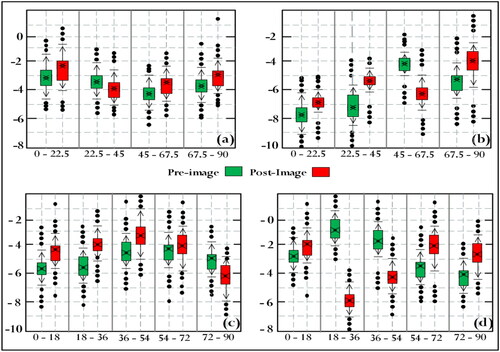
displays the results of a comparison between the average intensity of cross-polarized (VH) backscatter and the interval of marginal local incidence angles. This is due to the intensity of VH covering volume dispersion and is therefore sensitive in case of vegetation changes. So that we could test how well the backscatter analysis worked at varying incidence angles, we divided the angle of incidence into 5 or 4 intervals. The boxplot performance findings demonstrate that there is greater discrimination in burning areas at a lower incidence angle if one compares pre- and post-fire outcomes. In areas that remained unburnt, it was also noticed that the boxplot scale remained the same in both images. When one contrasts the pre and post-fire maps, the backscatter values decreased marginally, but they all ranged from −2 to −6 dB. The areas were landscape in Aus_f_2 and Aus_f_3, so steep slopes were experienced, and the angle of incidence varied from (0˚-90˚) seen in . As seen in of the post-fire images, the areas having lower angles of incidence (0˚-30˚) and also facing the sensor of radar display a VH decrease based on its strength and minor changes in box plot scale. This results from a brighter radar with the returning rate of signals for areas with lower angles of incidence, making it easier to distinguish between burnt and unburnt areas. However, steepness in shadows was seen on the surface in regions that were darker than those depicted from sections facing away from the sensor. Outliers appeared in considerable numbers in regions that were either perpendicular to the sensor or had a wide range of incidence angles (45˚-90˚), both of which might be explained by the higher levels of background noise in such regions. This may have hampered defined class prejudice and resulted in high errors in omission and commission. Finally, a comparison of the ranges of the lower angle of incidence for areas with a flat surface and also for steep areas reveals that the ranges of flat areas are high (between 0 and 30 degrees) compared with steep areas (between 0 and 18 degrees), providing insight into why the discrimination of burned areas is easy for flat areas. The sensor was better able to detect changes in the vegetation as a result of the increased backscatter signal it was receiving.
Figure 6. Boxplots showing the VH coefficient backscatter intensity predictable beside the local angle of incidence of south eastern Australia, comparing the pre and post-image of fire.
4.3. Burnt scar classification
Supplementary Table 3 shows the MRF classifier parameters, i.e. initial temperature, the lambda, and temperature reduction factor for each fire zone, after applying contextual classification and tuning. A little portion of the image was used as a test subject, and numerous values were tried out before the best one was chosen based on how well they performed in terms of accuracy.
As a result of the fire’s transitory character, it was a complex process to differentiate the burnt gravity levels using the C-band Sentinel-1. As a result, all the levels of burn severity largely overlap with one another. However, the targeted decomposition bands of H-alpha (anisotropy, alpha and entropy) and bands of backscatter intensity were combined (VH and VV) and reclassified into two burnt classes with unburnt classes. Supplementary Figure 4 shows the fire in Australia. There were steep slopes in Aus_f_ 2 & 3 that showed the results in the form of shadows, which were difficult to differentiate whether there were burns in the shadowed area, ultimately affecting the classification results. Supplementary Figure 4(a)–(d) indicate how Sentinel-1's high geometry acquisition influence and terrain capture resulted in a larger return of burnt and unburned regions compared to the optical dataset. When measuring plant density and crown closure, Sentinel-2 relies on the spectral sensitivity of predefined classes. In contrast, Sentinel-1 uses the polarimetric sensitivity of removing branches of crown leaves.
However, the optical data set al.so showed greater sensitivity to post-fire changes compared to radar data for the Australian fire zones 3 & 4. The visual evaluation of the H-alpha decomposition of Sentinel-1 in Supplementary Figure 2 proves this. The sensitivity to post-fire changes was not found as severe while analyzing both types of fire as in Supplementary Figure 5, as both study areas applied a similar approach.
4.4. Accuracy assessment
The kappa coefficient also varied significantly in for both Sentinel-1 and Sentinel-2 compared to for Southeastern Australia. At the same time, Australia had a higher kappa coefficient for Sentinel-2, while Sentinel-1 had an extremely low value. Nevertheless, the designation of Sentinel-2 resulted in a comparable match with the polygon’s fire extent, demonstrating the pixels’ spectral response to post-fire shifts. Similarly, as seen in , the outcome matched the burned index. However, outside the specified fire extent. Some unburned regions that were perkier than the burnt area boundary were incorrectly labeled as burnt using the dNBR , as illustrated in Supplementary Figure 5(c) and (d) (d). As a result, Sentinel-2's kappa coefficient in , columns 3 and 4, is inflated artificially.
Kappa coefficient and calculation of the f-score was used to determine the certainty of the findings in the separation based on burnt and unburnt areas for both SAR and optical. As seen in and , both the producer’s and users’ accuracy of the consumer has been taken into account. As seen in , through the SVM-MRF classification of Sentinel-1 and Sentinel-2, the remote sensing indices that entered burned versus unburned areas provided better overall accuracy and higher consumer and producer accuracy performance. This showed that both the electromagnetic spectrum and polarimetry of SAR could detect changes in post-fire vegetation structure. Likewise, as seen by using the accuracy, recall with f-score for the data of Pakistan and Australia evaluated in . In fire perimeter zones, we were able to accurately distinguish between burned and unburned areas with a high degree of classification accuracy.
Table 4. Results of the accuracy evaluation based on kappa statistics from the Sentinel-2 fire zone Australia and Pakistan using SVM-MRF classification.
Table 5. Results of the accuracy assessment using Sentinel-1 SVM-MRF classification covering fire zones in Australia.
Table 6. The findings of the accuracy evaluation are based on measurements of F-score from the Sentinel-2 classification of SVM MRF covering Pakistan fire.
The vector shapefile representing the fire perimeter region was found to not perfectly match the edges of the burned areas shown in the classification outcomes showed in Supplementary Figure 3(a) and after classification with SVM-MRF (b). This could be because of the use of SVM-MRF radial basis function contextual classifiers, which answer the question of spectral heterogeneity between classes and spatial changes along boundaries.One more concern may be due to the digitization time of the perimeter of vector fire that may have occurred at the early stages of the shot. In contrast, post-fire analysis was based on spectral classification analysis. As seen in Supplementary Figure 3, this may contribute to the disparity in the shapefile of the fire perimeter having real timing of ground fire. In the polygons collected from the Victoria archive, a similar finding was noted as they represented the beginning of the fire without conducting the entire fire zone. As a result, it was not possible to say with any certainty whether or not Australia had the same issue.
4.5. SAR and optical layer integration and feature importance
Based on the findings of this study, we can conclude that the use of the Sentinel-1 SAR sensor and the Sentinel-2 was effective in the classification of burnt and unburned areas because it produced results with high accuracy that could be applied to the shapefile of the fire perimeter gathered from the databases of Pakistan and Australia. Moreover, RS could be seen from our observations as an important method in broad wildfire coverage. By utilizing the dNBR index, we were able to correlate the degree of change following the fire occurred.
In order to acquire the training sets for classification on Sentinel-1 and Sentinel-2, the vegetation index was used as a reference data set. The classifier showed variations in burnt and unburnt areas’ polarimetric and spectral susceptibility. This is particularly valid in areas known to be unburnt in the Sentinel-2 classifier as regrowth in the dNBR index when burnt in Sentinel-1. We may also see the potential of sentinel-1 to demonstrate improvements in the structure of the forest, which proved to be a crucial thing using SAR through the study of polarimetric entropy and alpha decomposition. Using backscatter amplitude with limitations to the local incidence angles and the inclination of steep slopes, polarimetric decomposition integration allowed us to measure the changes that occurred immediately after a bushfire.
In addition, SAR data was effective only in Victoria, Australia; however, for Pakistan, the use of backscatter strength and a small improvement in the use of H-alpha decomposition did not detect changes after the burn. This was expected to be attributed to the severity based on the fire, which had not caused serious improvements like the forest. Nevertheless, both fields gave similar findings in the optical dataset. GLCM was also effective in measuring spatial difference on the base of texture for the burnt and unburnt areas, as it has discrimination, particularly on slopes with steep. However, the findings obtained from detecting burnt and unburnt areas using optical and SAR sensors were successful and could be applied to both datasets in the research fields.
5. Discussion
This research analyzed and integration of SAR and optical data for identifying and classifying burned and unburned scars in Australia and Pakistan after a forest fire/bish fires. By looking at the potential of spectral with the strength of backscatter in the separability for two of the specified classes, images of Sentinel-1 and Sentinel-2 were used to differentiate the two classes, which were well defined and also by using a classifier of contextual. In the Victoria fire archive, we have used the available data. In our classification findings, it was possible to use the polygons showing fire areas from these datasets as an element of guiding, showing the magnitude of zones for fire perimeter compared to the Polarimetric and spectral pattern based on burnt regions.
Further research on developments in sensor technologies and the use of drones may be carried out by looking at the varied use forest resource organization. In terms of field coverage, time and performance, drones bear several sensing equipments, including NIR, SWIR, radar sensor and visible light (Ahmad et al. Citation2021; Majeed et al. Citation2022; Tariq et al. Citation2022). Flexible monitoring of its spatio-temporal resolution, highest data collection amount and reduced operational costs having less risk to the crews of forest fire, are the advantages of a drone. Monitoring forest wildfires can be a crucial feature, particularly in favour of near real-time fire management techniques at the childhood stages before it creates a threat (Tariq and Shu Citation2020; Hussain et al. Citation2022; Khan et al. Citation2022; Wahla et al. Citation2022). In particular, several RS experiments have been used to determine how extreme wildfires depend on ecological shifts in satellite indices from analysis of spectral calculated by the satellite sensor. More emphasis should also be laid on the relation of ecological steps to find the physical change in fire induced on the surface of the ground and how it rapidly impacts forest regeneration (Key and Benson Citation2006; Allison et al. Citation2016; Tariq et al. Citation2020; Citation2022; Tariq and Mumtaz Citation2023).
Our testing approach using the SAR satellite sensor having optical data will also be of suitable value in terms of the JRC. This is how it will predict the value coming from radar showing in the study of forest structure and how it would mitigate much of the historically faced difficulties, taking into account the independence of the atmosphere, spatial resolution as well as temporal resolution and re-examination duration that is crucial to tracking improvements in the forest over time. As stated in the introduction, the primary goal of this study is to use RS techniques to characterize the distinction between burnt and unburnt scars by contrasting sentinel-1 and sentinel-2.
The first was to explore the magnitude of the fire’s intensity. This was achieved using dNBR vegetation indices in Sentinel-2, resulting in both Pakistan and Australian detection of burnt and unburnt areas. Spectral correlation was seen in the analysis of pre and post-fire reflectance values when there was a reduction in post-fire values suggesting total or partial vegetation destruction based on fire severity section 6.1. Further comparison can be made with spectral indices following forest fires associated with fire behavior for determining the danger of forest fires and implementing an avoidance and risk assessment plan (Polychronaki et al. Citation2013; Baqa et al. Citation2022; Jalayer et al. Citation2022; Sharifi et al. Citation2022)
Furthermore, the Polarimetric aspect and backscatter amplitude satellite SAR imagery was studied. As a result, it became possible to tell the difference between burned and unburned areas and to view new information about phenomena such as forest changes. Vegetation structure and topographic impacts were both modified, and the alterations were primarily connected with the degree to which the burn’s backscatter was intense (Rücker and Siegert Citation2000). Shadows were cast, however, since local incidence angles and topography were more influential. Therefore, in some cases, the backscatter did not penetrate, rendering it impossible to distinguish between burned and unburned regions, resulting in errors of commission and omission (Ricotta et al. Citation2018).
Furthermore, we did not address whether the shortcomings encountered in using SAR could be reduced by combining optical and SAR data using a method like that specified in section 4 of the report. Finally, in Australia but not Pakistan, the use of Sentinel-1 was only vulnerable to bushfires. However, considering the severity of the fire, an in-depth time series study will be useful in identifying the systemic and behavioural changes induced by the fire. In addition, the historical and current study of wildfire activity refers to the fuel consumption rate, temperature, and topography of vegetation changes. Therefore, a better understanding of how fire ignition points impact the pathof fires depending on the wind direction should be established (Burrows et al. Citation2008).
There was an evaluation of the spectral difference between the burned and unburned regions. Using the kappa coefficient and f-score, we were able to determine this. As seen in and , both the accuracy of the manufacturer and the accuracy of the consumers were taken into account. Section 6.4 provided greater average performance and consumer and manufacturer accuracy results for satellite indices that retrieved burnt and unburnt regions. This proved that changes in vegetation after fires may be tracked using electromagnetic spectroscopy. However, one must bear in mind that the sample size of one class in comparison to the other may be skewed, which may cause the average precision reached to be unreliable (Key and Benson Citation2006; Sowter et al. Citation2016).
The assessment of texture differences and separability of unburnt and burnt areas was fourth. Using backscatter intensity, this was done through GLCM textural analysis. Three metrics of texture similarity, entropy, homogeneity and contrast performed admirably in separating the two classes described in section 6.5. That may have something to do with the window size, lag distance, and quantization level, all of which are relevant GLCM characteristics. Calculating numerous orientation scales and window sizes in GLCM to accurately capture the textural distinction between the provided classes is a time-consuming process. In addition, the extent of quantization has an aggregate effect on the values of texture features. Therefore, in-depth studies should be conducted to understand better the relationship between forest structure and form and textural characteristics of GLCM as spatial and image resolution differ.
Finally, it would be interesting to mention if, depending on their preferences, our outcomes would be beneficial to different stakeholders. State forest authorities, including state divisions of government, society or landowners, firefighters, risk emergency services, and forest managers, are the key stakeholders. We may see the geographic maps of bushfire intensity and RS analysis of fire intensity used by state government agencies keen on forest management to supply emergency services in most affected areas. They will also establish restricted borders around frequent bushfire areas that could not be occupied as a human and ecological preparedness protection mechanism. The people and landowners who live in and around the fire-prone wooded zones should be made aware of the factors that contribute to the fast spread of bushfires, the locations most at risk and in need of protection, and the impact of fire on their health and wealth.
The research will support firefighters and threatened emergency services by better-incorporating fire ignition points in establishing fire evacuation areas and setting up fire emergency units. In decision-making, land management will learn how to mitigate the detrimental consequences caused by bushfires in unburnt regions that can serve as fire reignition points. They will also use radar data to understand the effects of the forest form and composition on fuel connectivity and use it to assign resources to handle fire hazards efficiently and safely adequately.
6. Conclusion
This research investigated using satellite SAR and Optical datasets to define and distinguish burnt and unburnt scars, with an overview of unburnt areas as the key objective. This was accomplished by classifying the backscatter and polarimetric sensitivity in Sentinel-1 and the spectral component of Sentinel-2. The result was also compared using the GLCM statistical test with the textural variance of the specified groups. The results suggested that the SAR system’s application to mapping burned and unburned scars improved wildfire prediction accuracy over reflectance-based directories provided by the Sentinel-2 dataset. It is important to take into account the backscatter variance due to environmental circumstances like wet or dry, and to normalize the influence of the local incidence angle, especially for tropical terrain areas. Vegetation indices that can be retrieved in the field should provide even more information on forest composition, the primary component driving variance in the SAR backscatter. This study also showed that wildfire intensity strongly depends on using satellite SAR in forest fire research. This is because of its effect on using SAR to track adjustments when comparing the severity of the backscatter pre and after the fire to assess the amount of fire-induced injury. Because of the variance in Pakistani forest fire using the same technique and form of the Australian bushfire dataset, this was inferred. Further optimizations might entail using opensource cloud computing platforms, such as the Google Earth Engine (GEE), where an extensive database of satellite imagery and computational power is accessible to all users.
Author contributions
Aqil Tariq: methodology, software, formal analysis, visualization, data curation, writing—original draft, investigation, validation, writing—review and editing, Yan Jiango: Supervision, writing—review and editing, Linlin Lu: data curation, writing—original draft, investigation, validation, writing—review and editing, Supervision, Funding. Ahsan Jamil: writing—review and editing. Ibrahim Al-ashkar: writing—review and editing. Muhammad Kamran: writing—review and editing Ayman El Sabagh: writing—review and editing. All authors have read and agreed to the published version of the manuscript.
Supplemental Material
Download MS Word (6.6 MB)Acknowledgments
The authors extend their appreciation to Researchers Supporting Project number (RSP2023R298), King Saud University, Riyadh, Saudi Arabia. This is part of the PhD research work of the first author. We would like to thank to Sentinel Scientific Data Centre of the European Space Agency (ESA) (https://scihub.copernicus.eu) for the Sentinel-2 images and the Alaska Satellite Facility (ASF) (https://search.asf.alaska.edu/#/) for the Sentinel-1 images. We are also thankful to the Capital Development Authority, Islamabad, Government of Pakistan (https://www.cda.gov.pk/), for providing us the shape files and ancillary data related forest fire in Pakistan. The authors thank the teams from Department of Agriculture, Fisheries and Forestry, Austrailian Government (https://www.agriculture.gov.au/abares/forestsaustralia/forest-data-maps-and-tools/fire-data) database service for making their datasets publicly available.
Disclosure statement
No potential conflict of interest was reported by the authors.
Data availability statement
The data presented in this study are available on request from the first or corresponding authors.
Additional information
Funding
References
- Abidi A, Ifrah S, Noor J. 2013. Economic analysis of forest management in Pakistan - A case study of changa mange and muree forest. Munich Pers RePEc Arch [Internet]. 44017:10. http://mpra.ub.uni-muenchen.de/28086/.
- Ahmad A, Ahmad SR, Gilani H, Tariq A, Zhao N, Aslam RW, Mumtaz F. 2021. A synthesis of spatial forest assessment studies using remote sensing data and techniques in Pakistan. Forests [Internet]. 12(9):1211. https://www.mdpi.com/1999-4907/12/9/1211.
- Allison RS, Johnston JM, Craig G, Jennings S. 2016. Airborne optical and thermal remote sensing for wildfire detection and monitoring. Sensors (Switzerland). 16(8):1310.
- Antropov O, Rauste Y, Vaananen A, Mutanen T, Hame T. 2016. Mapping forest disturbance using long time series of Sentinel-1 data: case studies over boreal and tropical forests. Int Geosci Remote Sens Symp. 2016-Novem:3906–3909.
- Arjasakusuma S, Kusuma SS, Vetrita Y, Prasasti I, Arief R. 2022. Monthly burned-area mapping using multi-sensor integration of Sentinel-1 and Sentinel-2 and machine learning: case Study of 2019’s fire events in South Sumatra Province, Indonesia. Remote Sens Appl Soc Environ [Internet]. 27:100790.
- Arpaci A, Malowerschnig B, Sass O, Vacik H. 2014. Using multi variate data mining techniques for estimating fire susceptibility of Tyrolean forests. Appl Geogr [Internet]. 53:258–270.
- Attiwill PM, Adams MA. 2013. Mega-fires, inquiries and politics in the eucalypt forests of Victoria, south-eastern Australia. For Ecol Manage [Internet]. 294:45–53.
- Baillarin SJ, Meygret A, Dechoz C, Petrucci B, Lacherade S, Tremas T, Isola C, Martimort P, Spoto F. 2012. Sentinel-2 level 1 products and image processing performances. In Int Geosci Remote Sens Symp. Vol. XXXIX; p. 7003–7006.
- Baqa MF, Lu L, Chen F, Nawaz-Ul-Huda S, Pan L, Tariq A, Qureshi S, Li B, Li Q. 2022. Characterizing spatiotemporal variations in the urban thermal environment related to land cover changes in Karachi, Pakistan, from 2000 to 2020. Remote Sens [Internet]. 14(9):2164. https://www.mdpi.com/2072-4292/14/9/2164.
- Bastarrika A, Chuvieco E, Martín MP. 2011. Mapping burned areas from landsat TM/ETM + data with a two-phase algorithm: balancing omission and commission errors. Remote Sens Environ [Internet]. 115(4):1003–1012.
- Boschetti L, Roy DP, Justice CO, Humber ML. 2015. MODIS-Landsat fusion for large area 30m burned area mapping. Remote Sens Environ [Internet]. 161:27–42.
- Burrows ND, Wardell-Johnson G, Ward B. 2008. Post-fire juvenile period of plants in south-west Australia forests and implications for fire management. J R Soc West Aust [Internet]. 91(2):163–174. https://www.scopus.com/inward/record.uri?eid=2-s2.0-67349240613&partnerID=40&md5=0e4dc6d6decb7322fab8a4e0fb4b7a46.
- Chuvieco E, Martín MP, Palacios A. 2002. Assessment of different spectral indices in the red-near-infrared spectral domain for burned land discrimination. Int J Remote Sens. 23(23):5103–5110.
- Cloude SR, Pottier E. 1996. A review of target decomposition theorems in radar polarimetry. IEEE Trans Geosci Remote Sensing. 34(2):498–518.
- Cloude SR, Pottier E. 1997. An entropy based classification scheme for land applications of polarimetric SAR. IEEE Trans Geosci Remote Sensing. 35(1):68–78.
- De Luca G, Silva JMN, Modica G. 2021. A workflow based on Sentinel-1 SAR data and open-source algorithms for unsupervised burned area detection in Mediterranean ecosystems. GIScience Remote Sens [Internet]. 58(4):516–541.
- De Luca G, Silva JMN, Modica G. 2022. Regional-scale burned area mapping in Mediterranean regions based on the multitemporal composite integration of Sentinel-1 and Sentinel-2 data. GIScience Remote Sens [Internet]. 59(1):1678–1705.
- De Petris S, Momo EJ, Sarvia F, Borgogno-Mondino E. 2022. Multitemporal dual-pol Sentinel-1 data to support monitoring of forest post-fire dynamics. Geocarto Int [Internet]. 37(24):1–22.
- dos Santos JFC, Romeiro JMN, de Assis JB, Torres FTP, Gleriani JM. 2018. Potentials and limitations of remote fire monitoring in protected areas. Sci Total Environ. 616–617:1347–1355.
- Engelbrecht J, Theron A, Vhengani L, Kemp J. 2017. A simple normalized difference approach to burnt area mapping using multi-polarisation C-Band SAR. Remote Sens. 9(8):9–11.
- Escuin S, Navarro R, Fernández P. 2008. Fire severity assessment by using NBR (Normalized Burn Ratio) and NDVI (Normalized Difference Vegetation Index) derived from LANDSAT TM/ETM images. Int J Remote Sens. 29(4):1053–1073.
- Fernández-Manso A, Fernández-Manso O, Pastor CQ. 2016. SENTINEL-2A red-edge spectral indices suitability for discriminating burn severity. Int J Appl Earth Obs Geoinf. 50:170–175.
- Giglio L, van der Werf GR, Randerson JT, Collatz GJ, Kasibhatla P. 2006. Global estimation of burned area using MODIS active fire observations. Atmos Chem Phys. 6(4):957–974.
- Gitas I, Mitri G, Veraverbeke S, Polychronaki A. 2012. Advances in remote sensing of post-fire vegetation recovery monitoring - A review. In Remote Sensing of Biomass - Principles and Applications. p. 143–164. https://doi.org/10.5772/20571.
- Gütlein M, Helma C, Karwath A, Kramer S. 2013. A large-scale empirical evaluation of cross-validation and external test set validation in (Q)SAR. Mol Inf. 32(5–6):516–528.
- Hirschmugl M, Deutscher J, Sobe C, Bouvet A, Mermoz S, Schardt M. 2020. Use of SAR and optical time series for tropical forest disturbance mapping. Remote Sens. 12(4):727.https://doi.org/10.3390/rs12040727
- Huang S, Siegert F. 2004. ENVISAT multisensor data for fire monitoring and impact assessment. Int J Remote Sens. 25(20):4411–4416.
- Hussain S, Qin S, Nasim W, Bukhari MA, Mubeen M, Fahad S, Raza A, Abdo HG, Tariq A, Mousa BG, et al. 2022. Monitoring the dynamic changes in vegetation cover using spatio-temporal remote sensing data from 1984 to 2020. Atmosphere (Basel) [Internet]. 13(10):1609. https://www.mdpi.com/2073-4433/13/10/1609.
- Jackson Q, Landgrebe DA. 2002. Adaptive Bayesian contextual classification based on Markov random fields. IEEE Trans Geosci Remote Sensing. 40(11):2454–2463.
- Jalayer S, Sharifi A, Abbasi-Moghadam D, Tariq A, Qin S. 2022. Modeling and predicting land use land cover spatiotemporal changes: a case study in Chalus Watershed, Iran. IEEE J Sel Top Appl Earth Observ Remote Sens. 15:5496–5513. https://ieeexplore.ieee.org/document/9822382/.
- Jenkins M, Collins L, Price O, Penman T, Zylstra P, Horsey B, Bradstock R. 2016. Environmental values and fire hazard of eucalypt plantings. Ecosphere. 7(11):1–14.
- Kalogirou V, Ferrazzoli P, Della Vecchia A, Foumelis M. 2014. On the SAR backscatter of burned forests: a model-based study in C-band, over burned pine canopies. IEEE Trans Geosci Remote Sensing. 52(10):6205–6215. http://ieeexplore.ieee.org/document/6708457/.
- Kavzoglu T, Colkesen I. 2009. A kernel functions analysis for support vector machines for land cover classification. Int J Appl Earth Obs Geoinf. 11(5):352–359.
- Key CH, Benson NC. 2006. Landscape Assessment (LA) sampling and analysis methods. USDA For Serv - Gen Tech Rep RMRS-GTR.(164 RMRS-GTR).
- Khan AM, Li Q, Saqib Z, Khan N, Habib T, Khalid N, Majeed M, Tariq A. 2022. MaxEnt modelling and impact of climate change on habitat suitability variations of economically important chilgoza pine (Pinus gerardiana Wall.) in South Asia. Forests [Internet]. 13(5):715. https://www.mdpi.com/1999-4907/13/5/715.
- Kontoes CC, Poilvé H, Florsch G, Keramitsoglou I, Paralikidis S. 2009. A comparative analysis of a fixed thresholding vs. a classification tree approach for operational burn scar detection and mapping. Int J Appl Earth Obs Geoinf. 11(5):299–316.
- Lee J, Kim W, Im J, Kwon C, Kim S. 2021. Detection of forest fire damage from Sentinel-1 SAR data through the synergistic use of principal component analysis and K-means clustering. Korean J Remote Sens. 37(5):1373–1387.
- Lentile LB, Smith AMS, Hudak AT, Morgan P, Bobbitt MJ, Lewis SA, Robichaud PR. 2009. Remote sensing for prediction of 1-year post-fire ecosystem condition. Int J Wildland Fire. 18(5):594–608.
- Li Y, Du L, Wei D. 2022. Multiscale CNN based on component analysis for SAR ATR. IEEE Trans Geosci Remote Sens [Internet]. 60:1–12. https://ieeexplore.ieee.org/document/9507558/.
- Liang TG, Huang XD, Wu CX, Liu XY, Li WL, Guo ZG, Ren JZ. 2008. An application of MODIS data to snow cover monitoring in a pastoral area: a case study in Northern Xinjiang, China. Remote Sens Environ [Internet]. 112(4):1514–1526. http://www.sciencedirect.com/science/article/pii/S0034425707002209.
- Majeed M, Lu L, Haq SM, Waheed M, Sahito HA, Fatima S, Aziz R, Bussmann RW, Tariq A, Ullah I, et al. 2022. Spatiotemporal distribution patterns of climbers along an abiotic gradient in Jhelum District, Punjab, Pakistan. Forests [Internet]. 13(8):1244. https://www.mdpi.com/1999-4907/13/8/1244.
- Malik R, Husain SZ. 2003. Evaluating deforestation using landsat TM and SPOT XS data in dry sub-tropical forest of Margalla Hills, northwest of Pakistan. Geoinf Eur Integr. (3):429–434.
- McCaw WL. 2013. Managing forest fuels using prescribed fire - A perspective from southern Australia. For Ecol Manage [Internet]. 294:217–224.
- Menges CH, Bartolo RE, Bell D, Hill GJE. 2004. The effect of savanna fires on SAR backscatter in northern Australia. Int J Remote Sens. 25(22):4857–4871.
- Palacios-Orueta A, Huesca M, Whiting ML, Litago J, Khanna S, Garcia M, Ustin SL. 2012. Derivation of phenological metrics by function fitting to time-series of Spectral Shape Indexes AS1 and AS2: mapping cotton phenological stages using MODIS time series. Remote Sens Environ [Internet]. 126:148–159.
- Polychronaki A, Gitas IZ, Veraverbeke S, Debien A. 2013. Evaluation of ALOS PALSAR imagery for burned area mapping in greece using object-based classification. Remote Sens. 5(11):5680–5701.
- Rao PVN, Sesha Sai MVR, Sreenivas K, Rao MVK, Rao BRM, Dwivedi RS, Venkataratnam L. 2002. Textural analysis of IRS-1D panchromatic data for land cover classification. Int J Remote Sens. 23(17):3327–3345.
- Ricotta C, Bajocco S, Guglietta D, Conedera M. 2018. Assessing the influence of roads on fire ignition: does land cover matter? Fire. 1(2):24.
- Rücker G, Siegert F. 2000. Burn scar mapping and fire damage assessment using Ers-2 sar images in East Kalimantan, Indonesia. Int Arch Photogramm Remote Sens. XXXIII(May 2014):1286–1293.
- Salvador R, Valeriano J, Pons X, Diaz-Delgado R. 2000. A semi-automatic methodology to detect fire scars in shrubs and evergreen forests with Landsat MSS time series. Int J Remote Sens. 21(4):655–671.
- Schepers L, Haest B, Veraverbeke S, Spanhove T, Borre JV, Goossens R. 2014. Burned area detection and burn severity assessment of a heathland fire in Belgium using airborne imaging spectroscopy (APEX). Remote Sens. 6(3):1803–1826.
- Schroeder W, Oliva P, Giglio L, Quayle B, Lorenz E, Morelli F. 2016. Active fire detection using Landsat-8/OLI data. Remote Sens Environ. 185:210–220.
- Sharifi A, Felegari S, Tariq A. 2022. Mangrove forests mapping using Sentinel-1 and Sentinel-2 satellite images. Arab J Geosci. 15(20):1593. https://link.springer.com/10.1007/s12517-022-10867-z.
- Small D, Holecz F, Meier E, Nüesch D. 1998. Radiometric normalization for multimode image comparison. Eusar. (3):191–194.
- Small D, Zuberbuhler L, Schubert A, Meier E. 2011. Terrain-flattened gamma nought Radarsat-2 backscatter. Can J Remote Sens. 37(5):493–499.
- Sowter A, Bin Che Amat M, Cigna F, Marsh S, Athab A, Alshammari L. 2016. Mexico City land subsidence in 2014–2015 with Sentinel-1 IW TOPS: results using the Intermittent SBAS (ISBAS) technique. Int J Appl Earth Obs Geoinf [Internet]. 52:230–242.
- Stroppiana D, Bordogna G, Carrara P, Boschetti M, Boschetti L, Brivio PA. 2012. A method for extracting burned areas from Landsat TM/ETM + images by soft aggregation of multiple Spectral Indices and a region growing algorithm. ISPRS J Photogramm Remote Sens [Internet]. 69:88–102.
- Tanase MA, Santoro M, de la Riva J, Prez-Cabello F, Le Toan T. 2010. Sensitivity of X-, C-, and L-band SAR backscatter to burn severity in Mediterranean pine forests. IEEE Trans Geosci Remote Sensing. 48(10):3663–3675.
- Tansey K. 2004. Vegetation burning in the year 2000: global burned area estimates from SPOT VEGETATION data. J Geophys Res [Internet]. 109(D14):D14S03. http://doi.wiley.com/10.1029/2003JD003598.
- Tariq A, Mumtaz F. 2023. Modeling spatio-temporal assessment of land use land cover of Lahore and its impact on land surface temperature using multi-spectral remote sensing data. Environ Sci Pollut Res [Internet]. 30(12): 23908–23924. https://doi.org/10.1007/s11356-022-23928-3
- Tariq A, Mumtaz F, Zeng X, Baloch MYJ, Moazzam MFU. 2022. Spatio-temporal variation of seasonal heat islands mapping of Pakistan during 2000–2019, using day-time and night-time land surface temperatures MODIS and meteorological stations data. Remote Sens Appl Soc Environ [Internet]. 27(May):100779.
- Tariq A, Riaz I, Ahmad Z, Yang B, Amin M, Kausar R, Andleeb S, Farooqi MA, Rafiq M. 2020. Land surface temperature relation with normalized satellite indices for the estimation of spatio-temporal trends in temperature among various land use land cover classes of an arid Potohar region using Landsat data. Environ Earth Sci. 79(1):40.
- Tariq A, Shu H. 2020. CA-Markov chain analysis of seasonal land surface temperature and land use landcover change using optical multi-temporal satellite data of Faisalabad. Pakistan. Remote Sens. 12(20):1–23.
- Tariq A, Shu H, Gagnon AS, Li Q, Mumtaz F, Hysa A, Siddique MA, Munir I. 2021. Assessing burned areas in wildfires and prescribed fires with spectral indices and SAR images in the Margalla Hills of Pakistan. Forests [Internet]. 12(10):18. https://www.mdpi.com/1999-4907/12/10/1371/htm.
- Tariq A, Shu H, Li Q, Altan O, Khan MR, Baqa MF, Lu L. 2021. Quantitative analysis of forest fires in Southeastern Australia using SAR data. Remote Sens. 13(12):2386.
- Tariq A, Shu H, Siddiqui S, Mousa BG, Munir I, Nasri A, Waqas H, Lu L, Baqa MF. 2021. Forest fire monitoring using spatial-statistical and Geo-spatial analysis of factors determining forest fire in Margalla Hills, Islamabad, Pakistan. Geomatics, Nat Hazards Risk [Internet]. 12(1):1212–1233. https://www.tandfonline.com/doi/full/10.1080/19475705.2021.1920477.
- Tariq A, Shu H, Siddiqui S, Munir I, Sharifi A, Li Q, Lu L. 2021. Spatio-temporal analysis of forest fire events in the Margalla Hills, Islamabad, Pakistan using socio-economic and environmental variable data with machine learning methods. J for Res [Internet]. 13:12.
- Tariq A, Yan J, Gagnon AS, Riaz Khan M, Mumtaz F. 2022. Mapping of cropland, cropping patterns and crop types by combining optical remote sensing images with decision tree classifier and random forest. Geo-Spatial Inf Sci [Internet]. 1–19.
- Tariq A, Yan J, Mumtaz F. 2022. Land change modeler and CA-Markov chain analysis for land use land cover change using satellite data of Peshawar, Pakistan. Phys Chem Earth, Parts A/B/C [Internet]. 1446(89):103286. https://doi.org/10.1016/j.jaci.2021.02.040%0A. https://linkinghub.elsevier.com/retrieve/pii/S1474706522001796
- Uwe M-W, Jerome L, Rudolf R, Ferran G, Marc N. 2013. Sentinel-2 Level 2a prototype processor: architecture, algorithms and first results. ESA Living Planet Symp 2013, Edinburgh, UK. 2013:3–10.
- Van Tricht K, Gobin A, Gilliams S, Piccard I. 2018. Synergistic use of radar sentinel-1 and optical sentinel-2 imagery for crop mapping: a case study for Belgium. Remote Sens. 10(10):1642.
- Vapnik V. 2006. Estimation of dependences based on empirical data. 2nd ed. New York: Springer-Verlag.
- Wahla SS, Kazmi JH, Sharifi A, Shirazi SA, Tariq AJ, Smith H. 2022. Assessing spatio-temporal mapping and monitoring of climatic variability using SPEI and RF machine learning models. Geocarto Int [Internet]. (37):1–20.
- Wang C, Komodakis N, Paragios N. 2013. Markov Random Field modeling, inference & learning in computer vision & image understanding: A survey. Comput Vis Image Underst. 117(11):1610–1627.
- Won M, Kim K, Lee S. 2014. Analysis of burn severity in large-fire area using SPOT5 images and field survey data. Korean J Agric for Meteorol [Internet]. 16(2):114–124. http://koreascience.or.kr/journal/view.jsp?kj=NRGSBM&py=2014&vnc=v16n2&sp=114.
- Yonezawa C, Watanabe M, Saito G. 2012. Polarimetric decomposition analysis of ALOS PALSAR observation data before and after a landslide event. Remote Sens. 4(8):2314–2328.