
 ?Mathematical formulae have been encoded as MathML and are displayed in this HTML version using MathJax in order to improve their display. Uncheck the box to turn MathJax off. This feature requires Javascript. Click on a formula to zoom.
Abstract
Landslide susceptibility mapping (LSM) comprehensively evaluates the spatial probability of landslide occurrence by using different environmental factors. However, most of the evaluation methods ignore the dynamic characteristic factors of landslides, which makes it difficult to obtain reliable prediction results. Taking the upper reaches of the Jinsha River as the study area, this article introduces the deformation data into the landslide characteristic model and proposes an improved landslide susceptibility evaluation method. Four kinds of landslide susceptibility machine learning models were constructed by collecting 20 landslide related factors. The prediction accuracy of machine learning models is compared, and the performance of different models and the improvement of model performance by deformation information are evaluated. The results show that the performance of Random Forest and XGBoost model is better than SVM and logistic regression model. The prediction accuracy of Random Forest and XGBoost model is improved obviously after InSAR deformation is introduced. 96.9 and 93.19% of landslide areas were reasonably classified as high or very high risk levels. Compared with the calculation result of traditional model, the proportion of high and very high risk pixels in landslide area is increased by 2.97 and 1.13%, respectively. In addition, the percentage of high and very high risk areas in the susceptibility evaluation area increased from 15.45 to 16.23% and 18.73 to 21.89%, respectively. The accuracy of Random Forest and XGBoost models increased from 0.793 to 0.878 and 0.776 to 0.812, respectively, and the AUC increased by 0.9 and 1.7%, respectively. The SHAP and traditional feature importance analysis reveals that rainfall, aspect, temperature and NDVI are the main influencing factors of landslide in the upper reaches of the Jinsha River.
1. Introduction
The prediction of landslide susceptibility is an important subject in landslide hazard research. Landslide susceptibility mapping (LSM) can comprehensively analyze the relationship between various geological environmental factors and landslide distribution, and finally predict the probability of landslide occurrence in space (Gao et al. Citation2023). LSM plays an important role in revealing the control factors of landslides and landslide-prone areas, and has become one of the important means of scientific pre-disaster warning (Fell et al. Citation2008; Huang et al. Citation2022). Using landslide data samples and characteristic factors to predict landslide probability, LSM is mainly based on the following assumptions: (1) Future events may occur under conditions similar to those that occurred in the past; (2) Landslide Conditioning Factor is spatially correlated and can be used for prediction functions (Stefan et al. Citation2021; Huang et al. Citation2022; Merghadi et al. Citation2020).
Currently, there are four main types of LSM methods: physical-based model, heuristic model, statistical model and machine learning (ML) model (Merghadi et al. Citation2020). However, these separate methods have advantages and limitations. Physics-based models require a large amount of detailed data to provide reliable results and have good performance in the prediction of small regions with detailed data, but are not very practical in LSM of large scale regions (Huang et al. Citation2020). Subsequently, heuristic models and statistical models were gradually adopted by LSM (Stefan et al. Citation2021). The heuristic model sorts or weights the influencing factors of landslides according to the expert knowledge and transforms them into rules that can be implemented by computers, but this method is highly subjective and the prediction results may have problems (Dou et al. Citation2020). Statistical models have been successfully implemented and applied to LSM in the last decade (Merghadi et al. Citation2020). However, the mechanism of geological disasters such as landslides is complex, and simple statistical model relationship is difficult to describe the relationship between landslides and environmental factors (Huang et al. Citation2020; Stefan et al. Citation2021), it is difficult to deal with complex nonlinear relationship problems and achieve high accuracy (Frattini et al. Citation2010). The machine learning model can effectively capture the nonlinear relationship between landslide and environmental factors, with higher flexibility and accuracy. Since 2010, machine learning methods, such as support vector machine (SVM), logistic regression (LR), random forest (RF) algorithm and XGBoost algorithm, have been widely applied in landslide susceptibility research due to high prediction accuracy (Bui et al. Citation2016; Dou et al. Citation2020; Hu et al. Citation2020; Chen and Zhang Citation2021; Zhao et al. Citation2021; Ado et al. Citation2022). Trigila (Citation2015) predicted shallow landslides susceptibility on steep slopes based on LR and RF models, and the performance evaluation results proved the excellent prediction ability of these models. Zhang (Citation2022) used XGBoost and RF model to predict the susceptibility probability of landslides in Hokkaido earthquake in 2018, and obtained accurate prediction results. Goetz (Citation2015) adopted support vector machine (SVM) to conduct tests in Austria and proved that SVM can be used to predict landslide susceptibility.
Machine modeling has advantages in LSM, but there are performance differences between different modeling tools. Some scholars have compared the performance of machine learning models (Kavzoglu et al. Citation2014; Chen et al. Citation2017; Song et al. Citation2018). Kavzoglu (Citation2014) compared the performance of decision analysis, SVM and logistic regression model in shallow landslide mapping, and the results showed that the former was better than the traditional logistic regression method. Chen (Citation2017) compared the performance of decision tree model and logistic regression model in the landslide susceptibility analysis of Taibai County, and concluded that the LR model had good balance performance in training and verification. Song (Citation2018) applied XGBoost and logistic regression model to predict landslide susceptibility in the Three Gorges Reservoir area, and compared performance parameters and found that XGBoost method performed better in LSM processing unbalanced landslide data. However, there is no consensus on which ML algorithm is best for predicting landslide susceptibility. In addition, the prediction accuracy of landslide modeling is not only affected by the basic quality of ML algorithm used, but also by landslide causative factors (Novellino et al. Citation2021; Huang et al. Citation2022).
At present, the prediction of landslide susceptibility is mostly based on static environmental factors (elevation, slope, distance to river, etc.), and the influence of dynamic characteristic factors on landslide susceptibility evaluation is often ignored, resulting in inaccurate landslide prediction and false negative error (judging unstable areas as stable areas). In recent years, InSAR technology has been widely used in displacement monitoring and disaster early identification, and is an effective method for obtaining large-scale and high-resolution surface deformation (Havenith et al. Citation2006; Othman and Gloaguen Citation2013; Zhang et al. Citation2013; Wasowski and Bovenga Citation2014; Shafique et al. Citation2016; Nishiguchi et al. Citation2017; Zhao et al. Citation2018). Moreover, there are some studies on PS-InSAR (Persistent Scatterer InSAR) and SBAS-InSAR (Small Baselines Subset InSAR) to predict the future development of landslides (Yao et al. Citation2017; Fan et al. Citation2019; Zhang et al. Citation2020; Xu et al. Citation2021). InSAR deformation reflects the motion state of landslides and can be used as a characteristic factor in the susceptibility assessment models. Deformation results can make up for the defects of the traditional LSM prediction model in analyzing the dynamic characteristics of landslides. Based on the ground deformation acquired from InSAR technology, some scholars conduct error correction for LSM or analyze the improvement of the landslide susceptibility model (Novellino et al. Citation2021; Huang et al. Citation2022; Gao et al. Citation2023). Novellino (Citation2021) proposed a combination of machine learning and InSAR technology for landslide risk analysis. This new method provides a different landslide risk prediction model that can better understand the landslide process. Taking reservoir area as an example, Gao (Citation2023) introduced deformation data as a dynamic factor and built a convolutional neural network (CNN) model, and found that the model had a good effect on identifying the landslide prone area that was in slow deformation. Huang (Citation2022) proposed an improved LSM method based on InSAR deformation results, and the fusion of stochastic forest model and InSAR method increased the sensitivity level by 2.74% compared with the original model. These studies promote the application of InSAR technology in LSM. However, InSAR works in these studies fails to consider the deformation information on a long-time scale and the deformation data missing caused by satellite observation direction (Line of Sight, LOS). Moreover, most of the existing studies conducted single model tests, and rarely considered the comparison of the performance improvement of various model methods by introducing deformation factors, which is an urgent problem to be improved in landslide susceptibility evaluation. To solve this problem, the LSM study considering InSAR deformation was carried out in this article. SVM, LR, RF and XGBoost models are representative of machine learning models, which are easy to implement in ArcGIS, Python, GEE and other environments. These machine learning models are easier to be accepted and applied by the public, so this article chooses these four models to carry out a comparative study. The purpose of this article is to compare the performance of models in the susceptibility prediction of the study area according to the evaluation parameters, and to quantitatively assess how much InSAR technology improves the performance of the model and which model is more suitable to introduce InSAR deformation characteristics.
After the machine learning model predicted the landslide susceptibility, we further explained the predicted results. Explainability has always been one of the important issues in machine learning methods, which is important for understanding how Machine-Learning models make decisions (Al-Najjar et al. Citation2022). Some recent research works have tried to use explainability methods in Machine-Learning models (Novellino et al. Citation2021; Al-Najjar et al. Citation2022; Ekmekcioğlu et al. Citation2022a), such as Shapley Additive Explanations (SHAP) or Local Interpretable Model-Agnostic Explanation (LIME). Al-Najjar (Citation2022) employed a Shapley Additive Explanations (SHAP) approach, and proposed an explainable artificial intelligence (XAI) for landslide prediction. Results show that XAI method can measures the impact, interaction and correlation of conditioning factors. Ekmekcioğlu and Koc (Citation2022b) calculated the contribution of risk conditioned factors to event outcome prediction based on SHAP algorithm, which increased the interpretability of the method. Collini (Citation2022) introduced explainable artificial intelligence technology in the study of rainfall-induced landslide LSM. Therefore, we combined SHAP and feature significance analysis methods to finally explain the influencing factors of landslide.
Under the influence of special topography, hydrology and geological structure conditions, many landslides developed in the upper reaches of the Jinsha River (Harp et al. Citation2011; Du et al. Citation2020; Liu et al. Citation2021). These landslides seriously threaten the safety of nearby residents and major hydropower projects (Yao et al. Citation2022a) and directly affect the development of society and the economy (Huang et al. Citation2022). There is an urgent need for a systematic and accurate landslide susceptibility evaluation considering landslide deformation characteristics. Therefore, this article takes the upper reaches of the Jinsha River as the study area. After comprehensively considering multiple landslide-related factors and InSAR deformation results, we comprehensively evaluated and analyzed the landslide susceptibility based on four machine-learning models.
2. Study area and datasets
2.1. Study area
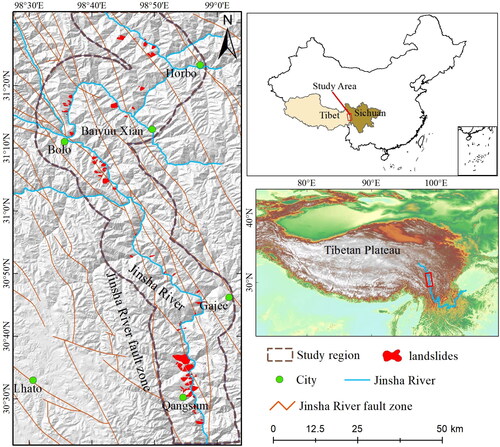
The study area is located in the southeast of the Tibetan Plateau (), at the junction of Sichuan and Tibet, and is an essential route for the Sichuan-Tibet Railway. The study area is a typical alpine valley landscape with steep topography on both sides of the river, the slope is generally between 20° and 45°, and the elevation is between 2500 and 5400 m. Under the action of plate compression and river erosion, the riverbed is relatively narrow, about 60–150 m, and the shape of the valley is V-shaped (Yao et al. Citation2022a). The temperature in the study area showed seasonal changes. Summer (June–August) has the highest temperature, with an average temperature of about 10°, while winter (December–February) has the lowest temperature of about −15°. The temperature increases gradually from north to south (upstream to downstream) in spatial distribution. Annual precipitation ranges from 500 to 800 mm, mainly in summer (Yao et al. Citation2022a). The fault zone in the study area is densely distributed along the NNW direction. Under the influence of special topography and tectonic conditions, a large number of landslides were developed on both sides of the river in the study area, and the height difference between the front and back edges of the landslide reached more than 1 km. In recent years, several landslide events have occurred in the study area (Song et al. Citation2018; Zhao et al. Citation2018; Zhang et al. Citation2020) caused losses of engineering facilities and seriously threatened the lives of nearby and downstream residents.
Figure 1. Location of the study area and distribution of landslides along the Jinsha River.
2.2. Geospatial database
2.2.1. Landslide inventory
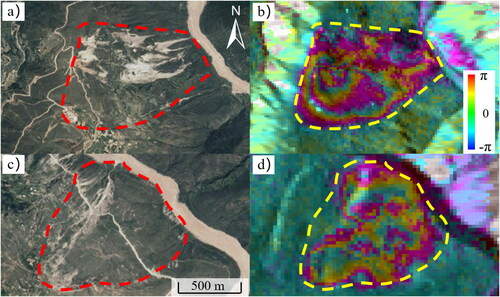
Spatial geometry data of the landslides is one of the basic data for landslide susceptibility mapping (Guzzetti et al. Citation1999). In this article, using Google Earth images and InSAR deformation results, a total of 100 landslides were interpreted by the geomorphic features and deformation characteristics of landslides (). It is worth noting that these landslides do not contain ancient landslide deposits. The total area of landslides in the study area is 57.1 km2, and the largest landslide is 8.27 km2. The types of landslides in the study area are mainly rock landslides, most of them are large and medium-sized deep-seated landslides. shows giant landslides identified by geomorphic features and InSAR deformation results. Both landslides and non-landslides are required for Machine-learning models. Therefore, 63 non-landslides were randomly selected in stratification within the buffer of the landslide 2 km range. In the subsequent machine-learning training, we input these landslides and non-landslides data as positive and negative samples, respectively.
Figure 2. Examples of landslides identified by geomorphic features and InSAR deformation results.
2.2.2. Landslide-related environmental factors
It is important to select appropriate influencing factors for landslide susceptibility assessment (Wang et al. Citation2019). The factors affecting landslides are complex. Due to the differences in geographical and geological conditions, there is no unified standard for selecting environmental factors in different regions (Huang et al. Citation2021). Some scholars have studied the causative factors of landslides (such as Xiongba landslide, Sala landslide, Baige landslide, etc.) in the upper reaches of Jinsha River (Fan et al. Citation2019; Liu et al. Citation2021; Zhang et al. Citation2020; Yao et al. Citation2022a, Citation2022b). The study area is located in the suture zone of the Jinsha River. The topographic conditions of the study area have an important effect on the occurrence of landslides (Liu et al. Citation2020). Chen and Zhang (Citation2021) believed that the spatial distribution of landslide was strongly positively correlated with the distance between the river and the fault zone, and the main influencing factors were rainfall, river, temperature change and earthquake. Liu (Citation2021) found that the slope of landslide in the upper reaches of the Jinsha River is mainly 10°–45°, and vegetation changes quickly. Human activities such as vegetation destruction, land use and road construction are also one of the inducing factors of landslide (Lissak et al. Citation2020; Novellino et al. Citation2021). Therefore, topography, geology, hydrology and human activities are collected in this article as environmental influencing factors of landslides.
In addition to the topographic factors of elevation, aspect, slope, plane curvature and profile curvature, we also introduced slope length and topographical position index (TPI) factors, which reflect the relative position relationship between a point and surrounding area. In terms of geological processes, we collected lithology, distance to historical earthquakes and distance to fault as geological influencing factors. Rainfall infiltration and river erosion can reduce slope strength and increase body weight, which are important factors affecting landslides (Sahin Citation2020a; Wang et al. Citation2022). We took distance to river, rainfall, temperature, stream power index (SPI) and topographical wetness index (TWI) as hydrological influencing factors. SPI represents the effect of runoff concentration on soil erosion, and TWI is an indicator of the effect of regional topography on runoff accumulation (Amatya et al. Citation2021). Human activities (such as road building and vegetation destruction) inevitably interfere with the slope balance. Land use/land cover (LULC), NDVI (Normalized Difference Vegetation Index) and distance to roads are considered as human activities factors.
Therefore, a total of 18 landslide-related environmental factors is selected in this article. All influencing factors data are shown in . All the above factors were calculated and inversed by ArcGIS software and open-source remote sensing data. To facilitate model calculation, we sampled all the influence factors to the same raster resolution.
Table 1. Landslide-related environmental factors categories in the study area.
2.2.3. Dynamic feature factor
The dynamic characteristics of landslides can be obtained by InSAR technology. In recent years, InSAR and its derived technologies (SBAS-InSAR, PS-InSAR, MAI, etc.) have been widely used for monitoring surface deformation and ground changes (Yao et al. Citation2022b). In this article, a total of 191 scenes of Sentinel-1 SAR data spanning 4 years were collected with a temporal resolution of 12 days (). The surface deformation velocity in the study area was obtained using the SBAS-InSAR technology (Section 3.1). Due to the limitation of the satellite observation angle, the single observation direction inevitably has invisible areas, such as shadow and overlay regions. Therefore, we integrated the multi-orbit deformation results and obtained a complete surface deformation field of 30 m spatial resolution.
Table 2. Detail parameters of SAR images.
3. Methods
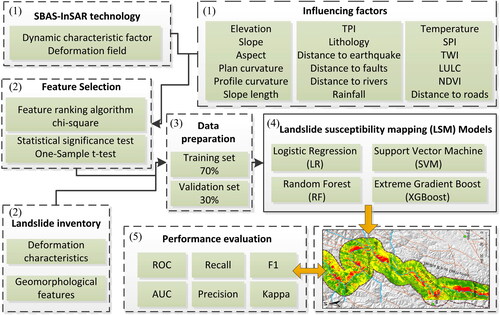
In this article, 8 km buffer zone of the upper Jinsha River was established as the study area. Firstly, the surface deformation field was introduced as the dynamic characteristic factor of landslides, and 18 environmental characteristic factors were combined to make landslide susceptibility mapping. Then, four statistical and machine learning models were used to construct susceptibility maps in the study area. Finally, the accuracy of different models in the study area was evaluated. The research flow is shown in .
Figure 3. Research methodological flow of the study.
3.1. Geospatial database prepared
3.1.1. Environmental characteristic factors
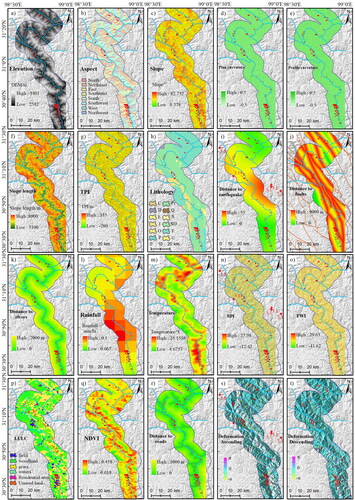
In this article, terrain-related factors are calculated based on SRTM (Shuttle Radar Topography Mission) DEM with a 30 m resolution. Several topographic analysis tools in ArcGIS software (such as slope, aspect, curvature, etc.) are adopted to calculate all topographic factors. Furthermore, the Euclidean distance tool in ArcGIS software calculates the distance between each pixel and historical earthquakes, faults, rivers and roads. LULC, NDVI, rainfall and temperature of the study area were retrieved by using Modis remote sensing images and GEE (Google Earth Engine) remote sensing big data platform. shows the various feature factors obtained in the study.
Figure 4. Landslides-influencing factors. (a) dem, (b) aspect, (c) slope, (d) plan curvature, (e) plan curvature, (f) slope length, (g) TPI, (h) lithology, (i) distance to earthquakes, (j) distance to faults, (k) distance to rivers, (l) rainfall, (m) temperature, (n) SPI, (o) TWI, (p) LULC, (q) NDVI, (r) distance to roads, (s) LOS deformation acquired from ascending images, (t) LOS deformation acquired from descending images.
3.1.2. Dynamic characteristic factors
InSAR (Interferometric Synthetic Aperture Radar) technology has been widely applied in hazards identification and early warning (Dong et al. Citation2018; Lissak et al. Citation2020; Xu et al. Citation2021; Liu et al. Citation2022). It uses the phase information of SAR backscattering and can optimally provide millimetre-level measurement accuracy along the LOS direction (Hanssen, Citation2001; Ferretti et al. Citation2007). We download the open-source Sentinel-1 SAR data covering the study area (https://scihub.copernicus.eu) with the time span of 4 years. The GAMMA software and SBAS-InSAR method were used to obtain the LOS surface deformations in ascending and descending directions (Costantini, Citation1998; Goldstein and Werner, Citation1998; Lyons and Sandwell, Citation2003). Precise orbit files are downloaded and preprocessed. To reduce the low coherence area, the thresholds of time and perpendicular baselines were set at 36 d and 200 m, respectively. records the detailed parameters of SAR images. Firstly, the adaptive filtering function is used to smooth the generated interferogram, and then the minimum cost flow (MCF) method generates the unwrapped deformation phase. Finally, singular value decomposition (SVD) method is applied to calculate time-series deformation. The landslides in the study area are mainly distributed on the right bank of the Jinsha River, and effective deformation can be better obtained by the ascending images. Therefore, to obtain the complete surface deformation in the study area, we use the ascending as the main image, and the descending images are used to fill the shadow and overlay area. Previous studies have introduced InSAR deformation characteristics into the prediction of landslide susceptibility (Lissak et al. Citation2020; Merghadi et al. Citation2020; Hu et al. Citation2021; Huang et al. Citation2022). Different from previous work, the InSAR work in this article has the following two innovations: (1) This article establishes a long series InSAR deformation field covering the study area, with a time span of 4 years. The cumulative average deformation rate of four years can effectively suppress the errors of atmosphere and noise in the Jinsha River basin, and provide reliable deformation data for landslide susceptibility prediction. Moreover, the deformation results in this article have been verified by cross-comparison method (Yao et al. Citation2022b), and the deformation results are reliable. (2) In alpine and canyon areas, due to the limitation of SAR observation direction, the application of InSAR technology has serious shadow and overlay problems, resulting in missing deformation data, which is difficult to meet the data demand. In this article, the SAR data from ascending and descending orbits was collected and processed, and the complete deformation field data is calculated based on the data fusion method.
3.2. Landslide susceptibility models
Machine learning model has more accurate and reliable performance in landslide susceptibility prediction, and can handle large and complex data sets, so it is widely used in landslide prediction. As the most commonly used machine learning models, logistic regression, decision tree (decision tree integration method) and support vector machine are simple to implement and low cost to calculate, which is suitable for predicting landslide susceptibility in the study area of this article (Kavzoglu et al. Citation2014; Chen et al. Citation2017; Song et al. Citation2018). Therefore, we used four machine learning models (Logistic Regression, Random Forest, SVM and XGBoost) for landslide susceptibility mapping in the study area. Machine learning algorithms need to build training data sets and test data sets. Training datasets are generally used to build prediction models, while test datasets are utilized to analyze predictive capability, or model performance evaluation based on specific accuracy measures (Sahin et al. Citation2020b). Therefore, we stratified and randomly divided the landslides and non-landslides datasets into two parts, 70% was training data and 30% was validation data. Finally, 75 landslide and 40 non-landslide samples constituted the training data, and the remaining 25 landslide and 24 non-landslide samples served as the validation data. The specific model methods are introduced as follows.
3.2.1. Feature selection
In landslide susceptibility mapping, selecting a good feature subset is the key to building a reliable susceptibility model (Stefan et al. Citation2021). Feature selection is a common technology used to select the optimal feature subsets for building a robust learning model. The feature selection process mainly includes three steps: feature ranking, model prediction and statistically significant analysis. Feature ranking is used to determine which features have the most impact on construction learning (Santos et al. Citation2014). In this article, filter feature ranking methods, namely chi-squared, information gain, rank correlation, and random forest feature importance were evaluated to seek the most influential landslide conditioning factors on landslide susceptibility. And the most commonly used technique of statistical significance tests namely, Wilcoxon signed-rank test, was applied to determine the best subset model. As a general practice, hypotheses are accepted only if the significance level is less than 0.05 (i.e., p-value < 0.05).
First, in the stage of feature ranking, each set of features ranking generated is used to determine the feature score. Then, the feature sorting result with the most repetition times is selected by generating the repetition times of feature sorting. Finally, with the feature ranking, logistic regression model and statistical significance test completed, we take the optimal feature subset as the feature data set for the susceptibility model.
3.2.2. Logistic regression (LR)
The logistic regression model is a multivariate statistical analysis method combined with logical functions, which is used to study the dependence of binary variables (landslide or non-landslide) and independent variables (Chen et al. Citation2019; Zhao et al. Citation2019). The logistic regression model generally takes various characteristic factors as independent variables and takes landslide and non-landslide as dependent variables. By determining the logistic regression coefficient β, the probability P (0 < P < 1) of landslide occurrence under the combination of various evaluation factors was calculated. The logistic regression equation is as follows:
(1)
(1)
(2)
(2)
P is the probability of landslide occurrence; β1, β2, …, βn are the logistic regression coefficient; β0 is a constant. The correlation between the feature factors and their contributions to the model was determined by assessing the estimated coefficient and statistical significance of the logistic regression model.
3.2.3. Random forest (RF)
Random forest is a widely used and popular integrated learning method, first proposed by Breiman (Citation2001). RF takes decision tree as the basic model and generates a series of different decision tree models by constructing different training datasets and features (Pradhan Citation2013). The prediction accuracy of RF model is improved by combining many decision trees. Unlike the general statistical model, RF does not need to worry about the problem of multivariate collinearity faced by the general regression analysis.
Through bootstrap resampling technology, N samples were randomly selected from the original training samples to generate a new training set. Each independently extracted training sample is used to train a tree, and the forest is composed of n decision trees generated based on the sample set (Breiman, Citation2001). Each decision tree votes independently. Finally, the voting results of all decision trees are integrated, and the category with the most voting times is designated as the final output (Sahin and Colkesen Citation2021). The generalization error P* of random forest is defined as:
(3)
(3)
where P* is the generalization error of random forest; ρ is the average value of the correlation of the decision tree. s is the average strength of the decision tree. In this article, we determine the hyperparameters of random forest algorithm through parameter debugging. The RF hyperparameters were set to 80 for the number of trees and the minimum size of the terminal node was set as 8 (Probst et al. Citation2019). And we set 5 as the number of variables randomly sampled as candidates at each split (about one-third of the number factors in raster stack).
3.2.4. Support vector machine (SVM)
Support vector machine (SVM) is a supervised learning method based on statistical learning theory (Huang and Zhao Citation2018; Luo et al. Citation2019). SVM uses nonlinear mapping functions to convert model input variables into high-dimensional variables so that high-dimensional variables can be accurately fitted by linear regression (Yao et al. Citation2008). SVM has many unique advantages, which can better solve nonlinear and high-dimensional pattern recognition problems in the case of a small number of samples, and has been widely used in landslide susceptibility assessment research (Yao et al. Citation2008; Xu et al. Citation2013). The detailed introduction of the model is as follows:
Based on a set of linearly separable vectors xi (i = 1,2…n), they belong to two classes namely landslide and non-landslide, n is the number of training samples. The goal of the SVM training process is to find an optimal hyperplane and divide the training data into two output classes (Luo et al. Citation2019). Its expression is:
(4)
(4)
The formula should meet the following conditions:
(5)
(5)
is the norm of the normal hyperplane; b is a constant.
Based on the Lagrange multiplier, the cost function can be expressed as:
(6)
(6)
is the Lagrange multiplier. For the non-separable case, the relaxation variable
can be introduced as a constraint.
(7)
(7)
At this point, L can be deduced as:
(8)
(8)
Previous studies have shown (Xu et al. Citation2012) that Gaussian kernel function has better results. Therefore, this article selected Gaussian kernel function, whose expression is shown in EquationEquation (9)(9)
(9) . In order to improve the training accuracy and prevent overfitting, the gamma term for radial basis function (RBF) kernel is 0.2.
(9)
(9)
3.2.5. Extreme gradient boost (XGBoost)
XGBoost is a tree-based ensemble algorithm, which is currently one of the representative integrated learning methods by integrating new functions and fitting residuals (Chen and Guestrin Citation2016). XGBoost algorithm is good at dealing with discrete independent variables and dependent variable classification problems. It takes the weak evaluators (decision trees) with preferences as the base learner, and combines them for training learning, thus getting an integrated strong evaluator (Park and Kim Citation2019). Compared with other machine learning algorithms, XGBoost algorithm uses Taylor second-order expansion to optimize the loss function and adds regularization terms to control the complexity of the model, which greatly improves its computational efficiency and generalization ability. XGBoost algorithm can be expressed as follows:
(10)
(10)
where
is the predicted landslide susceptibility,
is the classification tree, and K is the total number of trees. F is the collection of all classification trees.
is the kth tree produced by the k-round iteration.
The expression of the objective function (Obj) is as follows:
(11)
(11)
where
is the loss function, which is used to evaluate the error between the predicted susceptibility and the true landslide susceptibility;
is the regularization term that avoids over-fitting, which is shown in EquationEquation (12)
(12)
(12) . The XGBoost algorithm keeps adding the classification tree and learning a new function to fit the previously predicted error.
(12)
(12)
where
is the leaf node score, T indicates the total number of leaf nodes, and
and
are the weighting factors (Chen and Guestrin Citation2016). Through Taylor expansion of the objective function, the optimal objective function is as follows:
(13)
(13)
where
is the first-order partial derivative of the loss function, and
is the second-order. The reduction of loss after splitting is shown as follows:
(14)
(14)
Through debugging, we adjusted several hyperparameters in XGBoost. The number of trees in the ensemble (n_estimators) was set at 50. To prevent overfitting, we set the subsample and colsample_bytree to 0.6 and 0.75.
3.3. Performance evaluation
In this article, 30% of samples were selected for model verification. The prediction accuracy of the susceptibility model is usually tested by the receiver sensitivity (ROC) curve and the area under the curve (AUC; Wang et al. Citation2019). The horizontal axis of ROC curve represents the proportion of non-landslides predicted as landslides. The vertical axis represents the proportion of landslides predicted accuracy and the AUC represents the accuracy of the susceptibility model. In addition, accuracy, kappa value, precision, recall and F1 score were used to comprehensively evaluate the quality of LSM.
4. Results
4.1. Feature selection of landslide‑influencing factors
Feature ranking is used to determine which features have greater influence on the probability of landslide occurrence. In this article, the feature correlation was measured based on statistical tests. Four filtering feature ranking methods were used to comprehensively evaluate feature factors suitable for the landslide susceptibility in this study area. In this process, the importance estimation of features is started by iterative prediction. In each iteration, new features are added to the previous dataset based on their importance.
Landslide susceptibility is affected by various factors. shows the different feature weights and rankings obtained using four methods. The influence factors in represent the contribution weight of the factors to landslide susceptibility. Large factor weight is conducive to the occurrence of landslides, and zero presents invalid influence factor. The influence factors predicted by four methods show that aspect, rainfall, temperature, earthquake and deformation have the greatest influence on landslides. Curvature, slope, slope length, SPI, TPI and TWI have little contribution to landslide occurrence. We further performed significance tests using the Wilcoxon signed-rank test method to select the best subset of features. In the statistical hypothesis test, Wilcoxon signed-rank test was used to explain the correlation between the two feature factors. The larger the statistical factor, the greater the correlation between the two features. We generally believe that the greater the correlation between feature factors, the more similar the role played in machine learning. Therefore, highly correlated factors need to be removed from feature subsets to avoid data redundancy and affect data processing efficiency. shows the correlation test results for all subsets. The results show that elevation is highly correlated with other topographic feature factors (profile curvature, slope, slope length, SPI and TPI). Since this article calculates topographic feature factors based on elevation data, they are highly correlated with the terrain. The study area is relatively small and landslides are distributed along both sides of the Jinsha River. The change of elevation has little relationship with the distribution of landslides. Therefore, elevation is deleted from the feature subset in this article. In addition, the fault is highly correlated with lithology and plane curvature. The study area is located in Jinshajiang suture zone, and the special geological tectonic environment makes the fault location is often the location of lithology change, but also the area with large relief. Therefore, only lithology and plane curvature factors were retained, and faults were deleted from the feature subset. Finally, according to the feature weight and correlation analysis, ten feature factors, including slope, aspect, earthquake, river, rainfall, temperature, NDVI, road, LULC, lithology and deformation, were retained as the best susceptibility evaluation dataset.
Figure 5. Correlation coefficient of each covariate based on Wilcoxon signed-rank test.
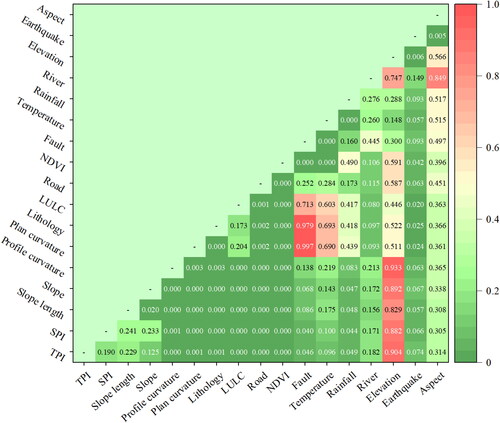
Table 3. Detail feature importance’s calculated by four ranking algorithms.
4.2. Evaluation of landslide susceptibility
In this study, four evaluation models (logistic regression, random forest, SVM, and XGBoost) were used to perform LSM. The susceptibility of landslides considering deformation characteristics and only considering environmental characteristics are calculated, respectively. shows the evaluation results of landslide susceptibility in the study area. The natural breakpoint method divided the susceptibility zones into five categories: very high, high, medium, low and very low. The susceptibility results showed that the areas with high and very high susceptibility were consistent with the landslide distribution area.
Figure 6. Landslide susceptibility mapping generated by logistic regression, random forest, SVM, and XGBoost models. (a–d) LSM without considering deformation, (e–h) LSM considering deformation.
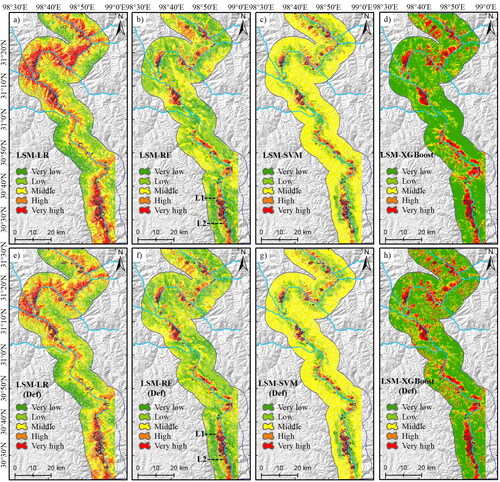
The results of susceptibility partitioning predicted by the four models are quite different. The highly prone areas of RF, SVM and XGBoost are concentrated near the landslide, while the prone areas of the LR model are more dispersed. The susceptibility distribution of RF is more consistent with the normal distribution, while SVM and XGBoost have a large concentration in the medium and very low susceptibility area. Moreover, the same susceptibility model results show similar results. But whether the deformation factor is considered is different in the landslide susceptibility assessment. With the introduction of the deformation characteristic factor, the high susceptibility area of the LR model is more concentrated in the large deformation landslide area. The deformation factor shows a higher weight in the logistic regression calculation, which leads to a greater dependence of the susceptibility on the information with deformation. However, this is not conducive to the comprehensive judgment of landslide characteristics and susceptibility prediction. After introducing the deformation feature factor, the susceptibility results of RF and SVM models changed less, and the susceptibility of a few areas decreased after considering the deformation information feature. The XGBoost results show an increase in high susceptibility areas, which have large deformation values but are not judged as high susceptibility areas based on the previous feature factors. These results indicate that for predicting landslide susceptibility in the study area, the introduction of deformation information is more favorable to the judgment than considering only static feature factor results.
shows the susceptibility classification statistics of the four models before and after the introduction of deformation factors. Statistical results show that the very high susceptibility areas in LR and SVM models decreased by 22.78 and 15.07%, respectively, and the medium and low susceptibility areas increased. In contrast, RF and XGBoost model results show that the proportion of very high and high susceptibility areas has increased by 0.23–1.65%. By comparing the distribution of landslide and high susceptibility area, it is found that the introduction of deformation information on the one hand reduces the false positive error in the high susceptibility area, on the other hand, the rapid deformation area is correctly included in the high susceptibility area, and the risk level of the large deformation area is improved. shows statistical pixel values of landslide susceptibility in landslide area before and after deformation introduction. The prediction accuracy of random forest and XGBoost model is obviously improved after InSAR deformation is introduced. 96.9 and 93.19% of landslide areas were reasonably divided into high and very high risk areas. Compared with the calculation result of traditional model, the proportion of high risk and very high risk pixels in landslide area is increased by 2.97 and 1.13%, respectively. However, after InSAR deformation was introduced into LR model, about 63% of the pixels were reclassified into high risk areas, and very high risk pixels were greatly reduced. This indicates that InSAR deformation distribution is quite different from the classification results of the original LR model and is not suitable for use in the LR model. After InSAR deformation was introduced into SVM model, the high and very high risk areas were slightly reduced, and InSAR deformation did not improve the SVM model much.
Table 4. Statistical pixel values of landslide susceptibility before and after the introduction of deformation.
Table 5. Statistical pixel values of landslide susceptibility in landslide area before and after deformation introduction.
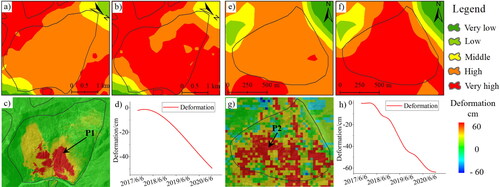
To further verify the model’s reliability, two typical landslides were selected from random forest susceptibility results for verification. shows the results of random forest susceptibility assessment and deformation information of L1 and L2 landslides (marked in ). Two landslides, L1 and L2, are located on the right bank of the Jinsha River. The time-series InSAR results () show that the cumulative deformation of these two landslides in recent 4 years reaches 50–60 cm. They are in the stage of rapid creep, with greater risk and susceptibility. However, without considering the deformation information, these two landslide areas are classified as high susceptibility areas (), whose landslide susceptibility is underestimated. In the optimized random forest susceptibility results (), landslide areas are correctly classified as very high susceptibility. Results show the importance and reliability of deformation factors in landslide susceptibility assessment.
Figure 7. Typical regional susceptibility optimization results. (a–d) the susceptibility results and deformation information of L1 landslide (marked in ), a random forest susceptibility results without considering deformation, (b) random forest susceptibility results considering deformation. (e–h) The susceptibility results and deformation information of L2 landslide (marked in random forest susceptibility results without considering deformation, (f) random forest susceptibility results considering deformation.
4.3. Model performance validation and comparison
ROC curve and evaluation parameters such as accuracy, F1 and recall were used to evaluate the model results. The ROC curves of the four susceptibility models are shown in , and the confusion matrix is shown in . The results show that all four models have good predictive performance. After introducing the deformation characteristic factor, the prediction performance of the random forest, support vector machine and XGBoost model was greatly improved, and their AUC values increased by 0.832, 0.32 and 1.535, respectively. But the AUC value of logistic regression model decreased. In addition, accuracy indexes of the confusion matrix, such as Accuracy, Kappa, Precision, Recall and F1, can display the accuracy performance of the model, and the results are shown in . The accuracy, Kappa, precision, recall and F1 of the Random Forest, SVM and XGboost models are improved after the introduction of the deformation factor, and the random forest and XGboost models have the best performance. The accuracy and accuracy of random forest and XGBoost were 0.878, 0.746 and 0.812, 0.94, respectively. In contrast, the predictive performance of logistic regression model is poor, and the introduction of deformation factor decreases the predictive performance. Therefore, based on ROC curve and accuracy evaluation, Random Forest and XGBoost model have better prediction accuracy. The introduction of deformation factor increases the predictive performance of the model, which can better predict the landslide susceptibility and has higher rationality.
Figure 8. ROC curves of four susceptibility models. (a) ROC test without considering deformation characteristic factors, (b) ROC test considering deformation characteristic factors.

Table 6. Statistical confusion matrix of the four susceptibility models.
According to the results of susceptibility evaluation and model performance comparison, we compared the results with previous studies based on historical literature. In terms of landslide susceptibility prediction in the study area, we effectively identified Xiongba landslide (), Sala landslide () and other high-risk areas, which is similar to the study on landslide or susceptibility in this area (Liu et al. Citation2021; Wang et al. Citation2022). In addition, Wang (Citation2022) adopted two deep learning (DL) algorithms, convolutional neural network (CNN) and deep neural network (DNN), to predict the landslide susceptibility in Jinsha River region. It is found that rainfall, NDVI and topography are closely related to landslide distribution in this region, which is similar to the conclusion of this article. In terms of Machine-Learning model performance, Zheng (Citation2021) has demonstrated the superiority of InSAR method in LSM using InSAR deformation data in the Jinsha River Basin. By comparing different machine learning methods, he believes that RF and SVM methods have better recognition accuracy. Merghadi (Citation2020) provides an extensive analysis and comparison of different ML technologies based on case studies. The results show that compared with other machine learning algorithms, the tree-based integrated algorithm achieves excellent results, and the random forest algorithm can provide more robust performance for accurate landslide susceptibility. Sahin (Citation2020a) uses a tree-based ensemble learning algorithm to predict the potential distribution of landslide susceptibility. The results show that the gradient enhancement algorithm such as XGBoost and RF have strong performance in landslide susceptibility prediction. In conclusion, in the assessment of landslide susceptibility in Jinsha River area, the prediction results of landslide susceptibility in this article are similar to those of previous studies. In terms of model performance, random forest and XGBoost are more reliable and have better performance in predicting susceptibility in the study area.
5. Discussion
Landslide susceptibility mapping is very important for landslide prediction and disaster reduction policies. How to use high-quality sample datasets and adopt reasonable evaluation models is the focus of current landslide susceptibility research (Huang et al. Citation2021; Zhao et al. Citation2023). However, due to the lack of landslide dynamic characteristic factors, it is impossible to characterize the state of landslide movement. Therefore, the traditional machine learning model is difficult to obtain reliable susceptibility results (Huang et al. Citation2022). SBAS-InSAR technology is used to obtain the surface deformation field of the study area, which is introduced into the susceptibility evaluation dataset as the dynamic characteristic factor. Yao et al. (2022) identified the long-term deformation process of landslides in the upper reaches of the Jinsha River by combining SBAS-InSAR technology and remote sensing images. It is found that InSAR technology can provide important data support for early identification and susceptibility assessment of landslides, making the prediction model more reliable. Selection of the landslide susceptibility prediction model has a great influence on the landslide susceptibility evaluation results. For different study areas and data sets, it is necessary to find appropriate evaluation models (Bui et al. Citation2016).
5.1. Performance comparison of LSM models
In this article, four susceptibility models, including logistic regression, random forest, support vector machine and XGBoost, are used for LSM of the study area. ROC curve, F1, Recall, precision, accuracy and other indicators were used to validate the accuracy of the model prediction results. The results show that the AUC of Random Forest, XGBoost and SVM models are greatly improved after the introduction of landslide dynamic characteristic factors, and the prediction accuracy is 90.767, 90.24 and 80.136, respectively. The confusion matrix also shows that the precision of the random forest and XGBoost model is improved. The random forest and XGBoost models have good prediction ability and can obtain high-quality LSM. Based on the case study in this article, we analyze the reasons why Random Forest and XGBoost model are superior to SVM and logistic regression. (1) We adopted many landslide-related factors, and the relationship between these variables is complex. Random Forest and XGBoost are based on the decision tree model to capture complex interactions between variables and better handle nonlinear relationships. Logistic regression is a generalized linear model. When the number of feature samples is large, the logistic regression model is easy to underfit, resulting in the reduction of the accuracy after the introduction of deformation factor. Although kernel function mechanism is introduced in SVM to solve nonlinear problems, its relative performance is poor when the data dimension is large. (2) Ensemble methods: Random Forest and XGBoost are ensemble methods, which combine multiple weak learners to create a strong learner. This allows them to reduce overfitting and improve generalization performance. Compared with SVM and Logistic regression, they are more robust to outliers, and stronger anti-interference, anti-overfitting and generalization capabilities can obtain more reliable prediction results in this study area. The outliers will have a great impact on the linear model. (3) Random Forest and XGBoost provide feature importance scores, which can help filter data sets suitable for LSM in the study area. At the same time, the model can be further optimized by adjusting the hyperparameters in the testing process, and then the spatial distribution of landslide susceptibility can be reasonably predicted.
5.2. Limitations and improvements
Based on four machine learning methods, this article introduces deformation information as a dynamic characteristic factor to evaluate landslide susceptibility. The research focuses on the improvement of model performance and comparison between models after the introduction of dynamic deformation factor. However, this study still has the following limitations and improvements. Although machine learning models such as random forest, SVM, logistic regression and XGBoost have been widely used in studies on landslide susceptibility, these machine learning models have inevitable limitations: (1) overfitting. Overfitting will occur when the model is too close to the training data, which will lead to poor generalization ability of the model. (2) Explainability. When machine learning models make predictions, we cannot clearly explain or identify the logic behind them. (3) Sensitivity to outliers. SVM and logistic regression can be sensitive to outliers in the training data, leading to poor performance. (4) Data requirements. Machine learning models require high quality data for effective training. If the data is not representative or contains errors, the model may perform poorly. We try to adjust the hyperparameters of the machine learning model, optimize the data set, and interpret the analysis to solve the limitations of the machine learning model as much as possible. In addition, the deformation characteristic adopted in this article is the average deformation rate on a long-time period, and the deformation on a three-dimensional time scale is difficult to be integrated into the machine learning model. Therefore, the model only reflects the general trend in recent years. Future research may consider incorporating the acceleration of deformation information into the model. When improving the susceptibility model, we suggest that not only the optimization of the model structure should be considered, but the model data is also important for the accuracy and reliability of the results.
5.3. Landslide-related environmental factors
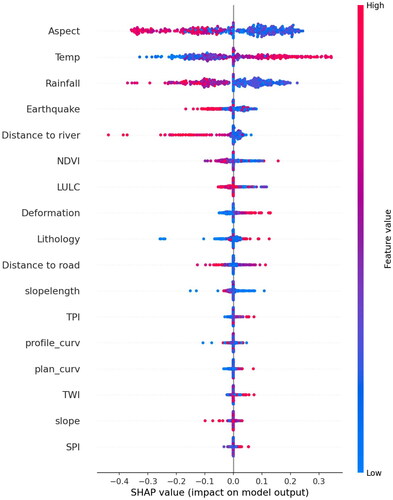
The comparison results of accuracy and reliability show that the random forest and XGBoost models have higher performance. Based on the landslide susceptibility results of random forest and XGBoost model, the landslide-related environmental factors in the study area are revealed. shows the importance ranking of landslide-related environmental factors predicted by XGBoost and Random Forest models. We find that rainfall, aspect, temperature, earthquake and NDVI are the main influencing factors of landslides. Secondly, roads and LULC in human activities, rivers and lithology in natural factors play a secondary role in landslide occurrence. Other characteristic factors have little effect on landslides. The deformation is the external manifestation of the dynamic change of landslides, which can be used to analyze the susceptibility of landslide, but it does not belong to the cause of disaster. SHAP feature importance can be considered as a substitute for traditional feature importance with higher reliability in comparison (Al-Najjar et al. Citation2022). SHAP shows the numerical value of the influence of each feature in the model, which can explain the importance of landslide features. RF model is the optimal predictive performance model of this article, so we choose this model to carry out SHAP analysis. shows the SHAP values from the RF model. In the figure, the feature variables are arranged from high to low. The horizontal points reveal the correlation between the feature and the landslide, as well as the positive and negative relationship. The color of the points indicates whether the feature value is high or low. According to SHAP results, aspect, temperature and rainfall have the greatest influence on landslide, followed by earthquake, NDVI, river, etc., which is consistent with the results of feature importance analysis in this article.
Figure 9. Significance of landslide-related environmental factors of the study area predicted by XGBoost and random forest models.
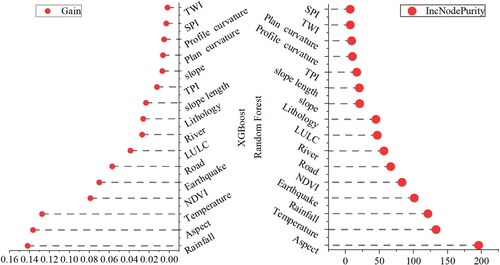
Figure 10. Summary plot of SHAP values derived from RF model.
6. Conclusion
In this article, a landslide susceptibility evaluation method based on machine learning model considering landslide deformation factors is proposed. Based on the traditional landslide characteristic data set, surface deformation is introduced as the dynamic characteristic factor of landslide. The advantage of this method in LSM is that it not only extracts the spatial characteristics of landslides, but also synthesizes the dynamic changes of landslides from the deformation factors. Firstly, based on the SBAS-InSAR technology, we obtained a complete surface deformation velocity field of four years in the study area by using the ascending and descending orbit observation images. Then, four machine learning methods, Logistic regression, random forest, support vector machine and XGBoost, were used to predict the landslide susceptibility in the upper reaches of Jinsha River. Finally, the performance of the machine learning model and the improvement of the machine learning model performance by InSAR method were evaluated by comparing the prediction results with the model performance evaluation indexes.
The results show that the random forest, XGBoost and SVM models have good performance. The predictive performance of random forest and XGBoost is improved greatly after the introduction of deformation characteristic factor. 96.9 and 93.19% of landslide areas are reasonably divided into high and very high risk areas. Compared with the calculation result of traditional model, the proportion of high risk and very high risk pixels in landslide areas is increased by 2.97 and 1.13%, respectively. The results of susceptibility evaluation of the whole study area showed that the prediction proportions of high risk area and very high risk area of random forest and XGBoost model increased from 15.45 to 16.23% and 18.73 to 21.89%, respectively. The accuracy of the prediction model increased from 0.793 to 0.878 and 0.776 to 0.812, respectively, and the AUC increased by 0.9 and 1.7%. The SHAP and the feature significance analysis of random forest and XGBoost reveals the influencing factors of landslide. The results show that rainfall, slope aspect, temperature, earthquake and NDVI are important factors affecting landslide, while road, land use, river and lithology are secondary factors. This study can provide scientific reference for the study of LSM in Jinsha River Basin.
Authors’ Contributions
J.Y. conceived the manuscript; X.Y. provided funding support and helped improve the manuscript; Z.Z. and X.L. provided methods and data.
Acknowledgments
We are very grateful for the Sentinel-1A data provided by European Space Agency (ESA).
Disclosure Statement
The authors declare no conflict of interest.
Data Availability Statement
Sentinel-1A data used in this study were provided by European. Space Agency (ESA) through the Sentinel-1 Scientific Data Hub.
Additional information
Funding
References
- Ado M, Amitab K, Maji AK, Jasińska E, Gono R, Leonowicz Z, Jasiński M. 2022. Landslide susceptibility mapping using machine learning: a literature survey. Remote Sens. 14(13):3029.
- Al-Najjar HA, Pradhan B, Beydoun G, Sarkar R, Park H-J, Alamri A., 2022. A novel method using explainable artificial intelligence (XAI)-based Shapley Additive Explanations for spatial landslide prediction using Time-Series SAR dataset. Gondwana Res. doi:10.1016/j.gr.2022.08.004.
- Amatya P, Kirschbaum D, Stanley T, Tanyas H. 2021. Landslide mapping using object-based image analysis and open source tools. Eng Geol. 282:106000.
- Breiman L. 2001. Random forests. Mach Learn. 45(1):5–32.
- Bui DT, Tuan TA, Klempe H, Pradhan B, Revhaug I. 2016. Spatial prediction models for shallow landslide hazards: a comparative assessment of the efficacy of support vector machines, artificial neural networks, kernel logistic regression, and logistic model tree. Landslides. 13(2):361–378.
- Chen TQ, Guestrin C. 2016. XGBoost: a scalable tree boosting system. In Proceedings of the 22nd ACM SIGKDD International Conference on Knowledge Discovery and Data Mining. New York, USA: ACM; p. 785–794.
- Chen W, Xie X, Peng J, Wang J, Duan Z, Hong H. 2017. GIS-based landslide susceptibility modelling: a comparative assessment of kernel logistic regression, Naïve-Bayes tree, and alternating decision tree models. Geomat Nat Hazard Risk. 8(2):950–973.
- Chen W, Yan XS, Zhao Z, Hong HY, Bui DT, Pradhan B. 2019. Spatial prediction of landslide susceptibility using data mining-based kernel logistic regression, naïve Bayes and RBFNetwork models for the Long County area. Bull Eng Geol Environ. 78(1):247–266.
- Chen WW, Zhang S. 2021. GIS-based comparative study of Bayes network, Hoeffding tree and logistic model tree for landslide susceptibility modeling. Catena. 203:105344.
- Collini E, Palesi L, Nesi P, Pantaleo G, Nocentini N, Rosi A. 2022. Predicting and understanding landslide events with explainable AI. IEEE Access. 10:31175–31189.
- Costantini M. 1998. A novel phase unwrapping method based on network programming. IEEE Trans Geosci Remote Sens. 36(3):813–821.
- Dong J, Liao MS, Xu Q, Zhang L, Tang MG, Gong JY. 2018. Detection and displacement characterization of landslides using multi-temporal satellite SAR interferometry: a case study of Danba County in the Dadu River Basin. Eng Geol. 240:95–109.
- Dou J, Yunus AP, Bui DT, Merghadi A, Sahana M, Zhu ZF, Chen CW, Han Z, Pham BT. 2020. Improved landslide assessment using support vector machine with bagging, boosting, and stacking ensemble machine learning framework in a mountainous watershed, Japan. Landslides. 17(3):641–658.
- Du J, Glade T, Woldai T, Chai B, Zeng B. 2020. Landslide susceptibility assessment based on an incomplete landslide inventory in the Jilong Valley, Tibet, Chinese Himalayas. Eng Geol. 270:105572.
- Ekmekcioğlu Ö, Başakın EE, Özger M., 2022a. Developing meta-heuristic optimization based ensemble machine learning algorithms for hydraulic efficiency assessment of storm water grate inlets. Urban Water J. 19(10):1093–1108.
- Ekmekcioğlu Ö, Koc K., 2022b. Explainable step-wise binary classification for the susceptibility assessment of geo-hydrological hazards. Catena. 216:106379.
- Fan XM, Xu Q, Alonso-Rodriguez A, Subramanian SS, Li WL, Zheng G, Dong XJ, Huang RQ. 2019. Successive landsliding and damming of the Jinsha River in eastern Tibet, China: prime investigation, early warning, and emergency response. Landslides. 16(5):1003–1020.
- Fell R, Corominas J, Bonnard C, Cascini L, Leroi E, Savage WZ. 2008. Guidelines for landslide susceptibility, hazard and risk-zoning for land use planning. Eng Geol. 102(3–4):85–98.
- Ferretti A, Savio G, Barzaghi R, Borghi A, Musazzi S, Novali F, Prati C, Rocca F. 2007. Submillimeter accuracy of InSAR time series: experimental validation. IEEE Trans Geosci Remote Sens. 45(5):1142–1153.
- Frattini P, Crosta G, Carrara A. 2010. Techniques for evaluating the performance of landslide susceptibility models. Eng Geol. 111(1–4):62–72.
- Gao BH, He Y, Zhang LF, Yao S, Yang W, Chen Y, He X, Zhao ZA, Chen HS. 2023. Dynamic evaluation of landslide susceptibility by CNN considering InSAR deformation: a case study of Liujiaxia reservoir. Chin J Rock Mech Eng. 42(2):450–465.
- Goetz JN, Brenning A, Petschko H, Leopold P. 2015. Evaluating machine learning and statistical prediction techniques for landslide susceptibility modeling. Comput Geosci. 81:1–11.
- Goldstein RM, Werner CL. 1998. Radar interferogram filtering for geophysical applications. Geophys Res Lett. 25(21):4035–4038.
- Guzzetti F, Carrara A, Cardinali M, Reichenbach P. 1999. Landslide hazard evaluation: a review of current techniques and their application in a multi-scale study, Central Italy. Geomorphology. 31(1–4):181–216.
- Hanssen RF. 2001. Radar interferometry: data interpretation and error analysis (remote sensing and digital image processing). Netherlands: Springer.
- Harp EL, Keefer DK, Sato HP, Yagi H. 2011. Landslide inventories: the essential part of seismic landslide hazard analyses. Eng Geol. 122(1–2):9–21.
- Havenith HB, Torgoev I, Meleshko A, Alioshin Y, Torgoev A, Danneels G. 2006. Landslides in the Mailuu-Suu Valley, Kyrgyzstan-Hazards and impacts. Landslides. 3(2):137–147.
- Hu GS, Tian SF, Chen NS, Liu M, Somos-Valenzuela M. 2020. An effectiveness evaluation method for debris flow control engineering for cascading hydropower stations along the Jinsha River, China. Eng Geol. 266:105472.
- Hu J, Liu JH, Li ZW, Zhu JJ, Wu LX, Sun Q, Wu WQ. 2021. Estimating three-dimensional coseismic deformations with the SM-VCE method based on heterogeneous SAR observations: selection of homogeneous points and analysis of observation combinations. Remote Sens Environ. 255:112298.
- Huang FM, Cao ZS, Guo JF, Jiang SH, Li S, Guo ZZ. 2020. Comparisons of heuristic, general statistical and machine learning models for landslide susceptibility prediction and mapping. Catena. 191:104580.
- Huang FM, Chen JW, Tang ZP, Fan XM, Huang JS, Zhou CB, Chang ZL. 2021. Uncertainties of landslide susceptibility prediction due to different spatial resolutions and different proportions of training and testing datasets. Chin J Rock Mech Eng. 40(6):1155–1169.
- Huang L, Sun Q, Hu J. 2022. Landslide sensitivity assessment and error correction based on InSAR and random forest method. Bull Surv Mapp. 10:13–20.
- Huang Y, Zhao L. 2018. Review on landslide susceptibility mapping using support vector machines. Catena. 165:520–529.
- Kavzoglu T, Sahin EK, Colkesen I. 2014. Landslide susceptibility mapping using GIS based multi-criteria decision analysis, support vector machines, and logistic regression. Landslides. 11(3):425–439.
- Lissak C, Bartsch A, De Michele M, Gomez C, Maquaire O, Raucoules D, Roulland T. 2020. Remote sensing for assessing landslides and associated hazards. Surv Geophys. 41(6):1391–1435.
- Liu P, Wei YM, Wang QJ, Chen Y, Xie JJ. 2020. Research on post-earthquake landslide extraction algorithm based on improved U-Net model. Remote Sens. 12(5):894.
- Liu XH, Yao X, Yao JM. 2022. Accelerated movements of Xiaomojiu landslide observed with SBAS-InSAR and three-dimensional measurements, Upper Jinsha River, Eastern Tibet. Appl Sci-Basel. 12(19):9758.
- Liu XJ, Zhao CY, Zhang Q, Lu Z, Li ZH, Yang CS, Zhu W, Liu-Zeng J, Chen LQ, Liu CJ. 2021. Integration of Sentinel-1 and ALOS/PALSAR-2 SAR datasets for mapping active landslides along the Jinsha River corridor, China. Eng Geol. 284:106033.
- Luo XG, Lin FK, Zhu S, Yu ML, Zhang Z, Meng LS, Peng J. 2019. Mine landslide susceptibility assessment using IVM, ANN and SVM models considering the contribution of affecting factors. PLoS One. 14(4):e0215134.
- Lyons S, Sandwell D. 2003. Fault creep along the southern San Andreas from interferometric synthetic aperture radar, permanent scatterers, and stacking. J Geophys Res Solid Earth. 108(B1):2047.
- Merghadi A, Yunus AP, Dou J, Whiteley J, ThaiPham B, Bui DT, Avtar R, Abderrahmane B. 2020. Machine learning methods for landslide susceptibility studies: a comparative overview of algorithm performance. Earth Sci Rev. 207:103225.
- Nishiguchi T, Tsuchiya S, Imaizumi F. 2017. Detection and accuracy of landslide movement by InSAR analysis using PALSAR-2 data. Landslides. 14(4):1483–1490.
- Novellino A, Cesarano M, Cappelletti P, Di Martire D, Di Napoli M, Ramondini M, Sowter A, Calcaterra D., 2021. Slow-moving landslide risk assessment combining machine learning and InSAR techniques. Catena. 203:105317.
- Othman AA, Gloaguen R. 2013. River courses affected by landslides and implications for hazard assessment: a high resolution remote sensing case study in NE Iraq-W Iran. Remote Sens. 5(3):1024–1044.
- Park S, Kim J. 2019. Landslide susceptibility mapping based on random forest and boosted regression tree models, and a comparison of their performance. Appl. Sci. 9(5):942.
- Pradhan B. 2013. A comparative study on the predictive ability of the decision tree, support vector machine and neuro-fuzzy models in landslide susceptibility mapping using GIS. Comput Geosci. 51:350–365.
- Probst P, Wright MN, Boulesteix AL. 2019. Hyperparameters and tuning strategies for random forest. WIREs Data Mining Knowl Discov. 9:e1301.
- Sahin EK, Colkesen I, Acmali SS, Akgun A, Aydinoglu AC. 2020b. Developing comprehensive geocomputation tools for landslide susceptibility mapping: LSM tool pack. Comput Geosci. 144:104592.
- Sahin EK, Colkesen I. 2021. Performance analysis of advanced decision tree-based ensemble learning algorithms for landslide susceptibility mapping. Geocarto Int. 36(11):1253–1275.
- Sahin EK. 2020a. Comparative analysis of gradient boosting algorithms for landslide susceptibility mapping. Geocarto Int. 37(9):2441–2465.
- Santos V, Datia N, Pato MPM. 2014. Ensemble feature ranking applied to medical data. In Conference on Electronics, Telecommunications and Computers-Cetc. vol.17, p. 223–230.
- Shafique M, van der Meijde M, Khan MA. 2016. A review of the 2005 Kashmir earthquake-induced landslides; from a remote sensing perspective. J Asian Earth Sci. 118:68–80.
- Song DQ, Che AL, Chen Z, Ge XR. 2018. Seismic stability of a rock slope with discontinuities under rapid water drawdown and earthquakes in large-scale shaking table tests. Eng Geol. 245:153–168.
- Song Y, Niu R, Xu S, Ye R, Peng L, Guo T, Li S, Chen T. 2018. Landslide susceptibility Mapping based on Weighted Gradient Boosting Decision Tree in Wanzhou Section of the Three Gorges Reservoir Area (China). IJGI. 8(1):4.
- Stefan S, Volkmar M, Christian K, Massimiliano P, Marc Z, Stefan S. 2021. Correlation does not imply geomorphic causation in data-driven landslide susceptibility modelling-Benefits of exploring landslide data collection effects. Sci Total Environ. 776:145935.
- Trigila A, Iadanza C, Esposito C, Scarascia-Mugnozza G. 2015. Comparison of Logistic Regression and Random Forests techniques for shallow landslide susceptibility assessment in Giampilieri (NE Sicily, Italy). Geomorphology. 249:119–136.
- Wang SB, Zhuang JQ, Mu JQ, Zheng J, Zhan JW, Wang J, Fu YT. 2022. Evaluation of landslide susceptibility of the Ya’an-Linzhi section of the Sichuan-Tibet Railway based on deep learning. Environ Earth Sci. 81(9):250.
- Wang Y, Fang ZC, Hong HY. 2019. Comparison of convolutional neural networks for landslide susceptibility mapping in Yanshan County, China. Sci Total Environ. 666:975–993.
- Wasowski J, Bovenga F. 2014. Investigating landslides and unstable slopes with satellite Multi Temporal Interferometry: current issues and future perspectives. Eng Geol. 174:103–138.
- Xu C, Dai FC, Xu XW, Lee YH. 2012. GIS-based support vector machine modelling of earthquake-triggered landslide susceptibility in the Jianjiang River watershed, China. Geomorphology. 145–146:70–80.
- Xu WY, Zhang Q, Zhang JC, Wang RB, Wang RK. 2013. Deformation and control engineering related to huge landslide on left bank of Xiluodu reservoir, south-west China. Eur J Environ Civil Eng. 17(sup1):S249–S268.
- Xu YK, George DL, Kim J, Lu Z, Riley M, Griffin T, de la Fuente J. 2021. Landslide monitoring and runout hazard assessment by integrating multi-source remote sensing and numerical models: an application to the Gold Basin landslide complex, northern Washington. Landslides. 18(3):1131–1141.
- Yao JM, Lan HX, Li LP, Cao YM, Wu YM, Zhang YX, Zhou CD. 2022a. Characteristics of a rapid landsliding area along Jinsha River revealed by multi-temporal remote sensing and its risks to Sichuan-Tibet railway. Landslides. 19(3):703–718.
- Yao JM, Yao X, Liu XH. 2022b. Landslide detection and mapping based on SBAS-InSAR and PS-InSAR: A case study in Gongjue county, Tibet, China. Remote Sens. 14(19):4728.
- Yao X, Li LJ, Zhang YS, Zhou ZK, Liu XH. 2017. Types and characteristics of slow-moving slope geo-hazards recognized by TS-InSAR along Xianshuihe active fault in the eastern Tibet Plateau. Nat Hazards. 88(3):1727–1740.
- Yao X, Tham LG, Dai FC. 2008. Landslide susceptibility mapping based on support vector machine: A case study on natural slopes of Hong Kong, China. Geomorphology. 101(4):572–582.
- Zhang SH, Wang YW, Wu G. 2022. Earthquake-induced landslide susceptibility assessment using a novel model based on gradient boosting machine learning and class balancing methods. Remote Sens. 14(23):5945.
- Zhang W, Chen JP, Wang Q, An YK, Qian X, Xiang LJ, He LX. 2013. Susceptibility analysis of large-scale debris flows based on combination weighting and extension methods. Nat Hazards. 66(2):1073–1100.
- Zhang Y, Meng XM, Dijkstra TA, Jordan CJ, Chen G, Zeng RQ, Novellino A. 2020. Forecasting the magnitude of potential landslides based on InSAR techniques. Remote Sens Environ. 241:111738.
- Zhao CY, Kang Y, Zhang Q, Lu Z, Li B. 2018. Landslide Identification and Monitoring along the Jinsha River Catchment (Wudongde Reservoir Area), China, Using the InSAR Method. Remote Sens. 10(7):993.
- Zhao Y, Wang R, Jiang YJ, Liu HJ, Wei ZL. 2019. GIS-based logistic regression for rainfall-induced landslide susceptibility mapping under different grid sizes in Yueqing, Southeastern China. Eng. Geol. 259:105147.
- Zhao Z, Chen JH, Xu KH, Xie HW, Gan XX, Xu H. 2021. A spatial case-based reasoning method for regional landslide risk assessment. Int J Appl Earth Obs Geoinf. 102:102381.
- Zhao Z, Chen JH, Yao JM, Xu KH, Liao YY, Xie HW, Gan XX. 2023. An improved spatial case-based reasoning considering multiple spatial drivers of geographic events and its application in landslide susceptibility mapping. Catena. 223:106940.
- Zheng XX, He GJ, Wang SS, Wang Y, Wang GZ, Yang ZY, Yu JC, Wang N. 2021. Comparison of machine learning methods for potential active landslide hazards identification with multi-source data. IJGI. 10(4):253.