
 ?Mathematical formulae have been encoded as MathML and are displayed in this HTML version using MathJax in order to improve their display. Uncheck the box to turn MathJax off. This feature requires Javascript. Click on a formula to zoom.
Abstract
This study determined the optimum number of water spray particles and the angle of the inner angle of the nozzle, simulated and studied the suppression effect of the water curtain system on roadway belt fires and toxic and harmful gases, and analysed the barrier effect of heat and smoke under the water curtain system using the flow field. The results show that the number of water curtain rows has a suppressive effect on the temperature and that increasing the number of rows has a better barrier effect on the hot smoke downstream of the roadway. From the velocity and temperature fields, it is clear that there is significant upward movement between the water mists of the water curtain system, which is caused by the water mists colliding with each other on the roadway floor. These jets are entrained into the water mists and merge to form an area of upward movement that acts as a 'barrier’ to prevent the fumes from spreading downstream of the water curtain. When the water curtain system is activated, it increases the concentration of component gases in the downstream space of the roadway and rapidly restores visibility to meet the requirements for safe evacuation.
1. Introduction
With the increasing development and utilization of underground areas, more and more underground disasters (gas, fire, dust, roof and water damage) have occurred in recent years (Dong et al. Citation2012; Li et al. Citation2013; Liu et al. Citation2015; Fan et al. Citation2020; Lian et al. Citation2021), and there has been a high frequency of underground disaster accidents in China. In recent years, underground fire accidents have had a severe impact, with tunnel belt conveyor fire accidents accounting for approximately one-fifth of all underground fire accidents. Belt conveyor fires have become a major hazard affecting the lives of underground personnel due to their susceptibility, secondary nature and severity, mainly because belt fires generate high temperatures and toxic and hazardous fumes and cause dust/gas explosion shock waves during the process, which are three extremely hazardous factors. On the one hand, high temperatures can cause thermal damage to underground personnel and production and transport facilities through heat radiation and heat transfer media, and fire wind pressure and throttling effects generated by high gas temperature can also lead to wind flow disturbances and a series of secondary disasters. On the other hand, toxic smoke spreads widely, reducing visibility near the source of the fire, and the toxic and harmful components in the smoke cause toxicological damage to the human body, making it more difficult for underground personnel to avoid disasters and rescue work. Therefore, effective prevention of fires in the conveyor belt of the tunnel and quick and timely measures to put out the fire are key to reducing thermal exposure, protecting the lives of underground personnel and reducing the losses, as well as responding to the national ‘Reduce carbon dioxide emissions’ work plan deployment. To completely deal with fires and eliminate the danger in underground disaster areas, the focus of disaster management must be on the elimination of ignition sources. Water mist has the advantages of being efficient, green and cost effective and has been widely studied and applied by scholars in underground engineering fires. In terms of fire thermal radiation absorption, Dombrovsky et al. (Citation2016) optimised the spectral radiation properties of water droplets based on radiation absorption and transmission in scattering fog to investigate the barrier effect of water mist on thermal radiation, and the simplified method was also found to be applicable to cases of real fire. Emilio et al. (Citation2008) based their research on the smoke barrier mechanism of water mist on a reduced scale physical model to simulate the problem and obtain absorption and dilution efficiencies of fluid barriers and found that a smoke barrier formed by water mist could separate the fire source from the protected area. Blanchard et al. (Citation2014) discussed the interaction between the water mist and hot smoke and ventilation in tunnels. In the tests, approximately half of the heat released from the fire was absorbed by the water droplets, and the water mist was found to have a strong heat absorption capacity. Dembele et al. (Citation2001) performed a study to analyse water spray mitigation experiments to investigate the key parameters affecting its attenuation capability, and the results showed that parameters such as nozzle flow and pressure affect the water mist transmission rate. Vaari et al. (Citation2012) found that FDS(fire dynamics simulation) fire simulation software could be applied to fine water mist spraying and associated radiative heat transfer calculations by simulating the high-pressure fine water mist properties and the small-scale experimental attenuation of thermal radiation properties. In terms of smoke movement and smoke control, Tajadura et al. (Citation2006) investigated the effect of the slope on smoke movement in semitransformed ventilated urban tunnels through numerical calculations. Yuan et al. (Citation2014) studied the results of conveyor belt fire in large tunnels through numerical and experimental studies, and found that the simulated maximum heat release rate and maximum smoke temperature were in good agreement with the results of large tunnel fire tests. The calibrated CFD model can be used to predict the flame spread on the conveyor belt at the mine entrance under different physical conditions and ventilation parameters. K. Teacoacha et al. (Citation2011) summarized the results of 12 full-size conveyor belt fire extinguishing experiments conducted by NIOSH Lake Lynn Laboratory (LLL) fire extinguishing facility (FSF) under ventilation conditions. The results showed that compared with typical sprinkler systems, the three new fire extinguishing systems could not more effectively suppress the identified conveyor belt fire located in the drive area. Lin et al. (Citation2014) studied the effect of the slope on semitransverse smoke exhaust and found that the smoke exhaust rate in inclined tunnels was higher than that in horizontal tunnels. Zhou et al. (Citation2020) studied the effect of the slope on the smoke exhaust in semitransverse ventilated tunnels through 1:20 small-scale model tunnels and numerical simulations of the critical velocity in the transverse passage of a semitransverse ventilated tunnel rescue station and found that the critical velocity in the transverse passage was influenced by the power fire source, fire location, smoke extraction rate and blockage rate. Zhou et al. (Citation2019) studied the variation in temperature and smoke distribution in a semitransverse ventilated rescue station by numerical simulation; the results showed that when the smoke extraction rate was 3 m/s, the smoke was completely controlled between shaft 2 and shaft 4. Sun et al. (Citation2016) found that the addition of a specific pro-solvent to the water mist could improve the adsorption and blockage of insoluble smoke particles. Liang et al. (Citation2017) designed a small-scale confined space fire extinguishing experiment and verified through simulation calculations that fine water mist could rapidly extinguish fires and was effective in suppressing the production of toxic and hazardous gases while also effectively abating fire smoke and improving visibility within the subsurface.
Most of the above studies have focused on the factors influencing thermal radiation and smoke movement in underground engineering fires. Fewer studies have investigated the effect of water curtain systems on underground belt transport tunnel fires, ignoring the effect of water curtain systems on the suppression of underground temperatures and toxic and hazardous gases. Therefore, in this paper, a 1:1 underground roadway model is established by FDS software, and the sensitivity analysis is carried out on the calculation grid, the number of spray particles and the inner angle of the nozzle of the water curtain system, and the optimal calculation grid density, the number of spray particles and the inner angle of the nozzle are determined. Before the simulation of the inner angle of the nozzle head, a bucket test was carried out to determine the distribution of the spray intensity in the tunnel, and then the FDS replication simulation was carried out on the experimental simulation results to determine the feasibility of the simulation. Finally, the changes of temperature, velocity field and toxic and harmful gases in the tunnel belt fire under natural ventilation are simulated after the activation of the water curtain system. By analyzing the temperature distribution and component gas distribution, it provides a theoretical basis for the heat and smoke insulation characteristics of the coal mine water curtain system, and provides a theoretical basis for the coal mine underground water curtain system. Provide guidance on personnel disaster avoidance and rescue.
2. Fire model establishment and parameter setting
2.1. Physical model
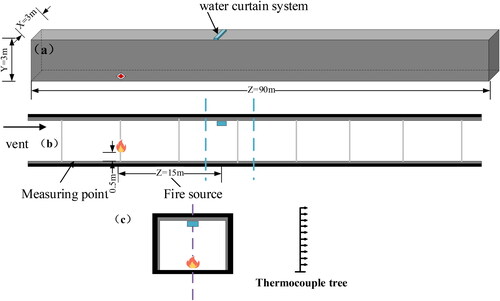
is a geometric diagram of the underground belt tunnel. Due to the complex on-site layout of the coal transportation belt tunnel, including the belt conveyor, cable and wire, fire water pipe, belt humanoid ladder and other equipment, it is difficult to establish a model that is exactly the same as the real setup and simplifying assumptions are used for secondary factors in belt transport tunnels. According to the actual production situation of the coal transportation belt tunnels in coal mines, the tunnel size is 90 m long, 3 m high and 3 m wide. The left and right surfaces of the model are set as open, in which the left surface is set as the vent, and the other surface materials are made of concrete with a thickness of 0.5 m and a thermal conductivity of 1.8 w/(M•K). The source uses PVC material to simulate HRR = 2400kW tunnel belt fire, which is calculated from the model scaling law of Froude’s criterion (Yu et al. Citation2017).The fire source centre is 25 m away from the left surface, and a row of thermocouples are set above the fire source centre. A column of gas concentration measurement points and thermocouple measurement points are set up every 10 m on the upper and lower sides of the fire source, which coincide and are located in the centre of the tunnel, in this picture is marked with orange lines. The changes in temperature and component gas concentrations after the water curtain system is opened under different parameters are measured to show the heat and smoke insulation ability of the water curtain system. The water curtain system is composed of three drainage curtains, each row of which has an interval of 1 m. Each row of water curtain includes three water mist sprinklers, each with an interval of 0.8 m and a height of 2.8 m. The center of the water curtain system is 15 m from the center of the fire source. In order to facilitate the observation, the blue box is used to represent the whole water curtain system.
Figure 1. Model overview: (a) schematic diagram, (b) front view, and (c) side view.
This paper mainly studies the influence of the water curtain system on the temperature and gas concentration in the fire source area of the underground belt transport tunnel. The specific simulation parameters are shown in .
Table 1. Simulation parameter settings.
2.2. PVC combustion response
The structure of flame-retardant conveyor belts currently used in coal mines in is mainly divided into two categories: fabric fiber core and steel wire rope core. The material wrapping and covering the core is mainly polyvinyl chloride plastic (PVC). Therefore, in this study, the ignition source is set as PVC material, and its combustion reaction equation is as follows:
(1)
(1)
According to EquationEquation (1)(1)
(1) , the reactants and products are defined in FDS, and the relevant parameters are set to simulate.
3. Sensitivity analysis
3.1. Meshing
The FDS of a tunnel fire involves a buoyancy plume, and the degree of flow field simulation depends on the dimensionless constant where
is the grid size, and
is the characteristic diameter of the fire source, which is obtained from EquationEquation (2)
(2)
(2)
(2)
(2)
From EquationEquation (2)(2)
(2) , seeing Nomenclature for parameter explanation,
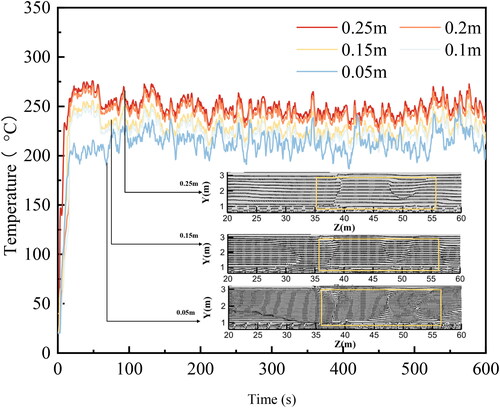
is approximately 0.10 m ∼ 0.42 m. Generally, a larger mesh size will lead to faster convergence, but this will reduce the quality of the model testing to a certain extent, while a smaller mesh size will lead to slower convergence but higher prediction quality (Wang et al. Citation2018; Jiao et al. Citation2019). Therefore, grid element sizes of 0.05 m, 0.1 m, 0.15 m, 0.2 m and 0.25 m are established for the simulation calculation. Under the condition that the water curtain is not opened, the grid sensitivity analysis is carried out based on the calculation results of the minimum grid size. As shown in , it can be seen that the larger the grid size is, the greater the temperature is calculated, and the grid diagram in the lower right corner is observed. The denser the grid, the more obvious the temperature field eddy current. It can be seen that different grid precisions have no effect on the temperature. The spatial distribution of the field has a significant effect. Under the requirements of obtaining accurate simulation results and reducing the time consumption, this paper selects a 0.15 m grid size for simulation.
Figure 2. Network sensitivity analysis.
3.2. Number of spray particles
Beji found that the number of droplet particles per second sprayed by the nozzle affects the accuracy of the FDS results, so a sensitivity analysis of the number of droplet particles per second sprayed is needed. The default number of droplets per second sprayed by the nozzle in the FDS is generally 5000, and in this paper, three values of 5000, 10000 and 50000 were used for the simulation. The results are shown in .
Figure 3. The number of particles ejected per second by the nozzle in the FDS.
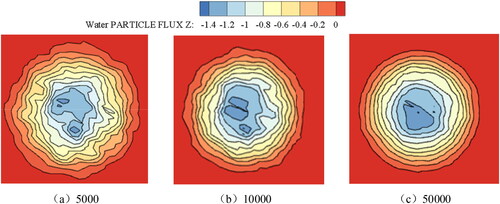
shows that when the number of particles sprayed by the nozzle increases in multiples, the spray edge will tend to be smooth, but the spray intensity distribution at the ground does not change significantly. As the number of particles sprayed by the nozzle increases, there is an increase in the computational complexity of the FDS, thereby lengthening the time required for the FDS.
3.3. Nozzle inner angle
Studies (Tang et al. Citation2013) have shown that the setting of the nozzle inner angle has a large impact on the flue gas settling effect and can affect the accuracy of the simulated scenario. However, due to the limitation of observation equipment, it is actually difficult to measure the inner angle of the nozzle accurately, so it needs to be judged by other means.
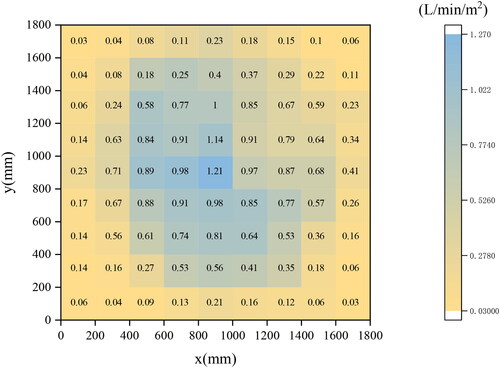
First, a bucket test is performed to measure the spray intensity distribution of a single nozzle at the tunnel floor. The schematic diagram of the experimental process and experimental setup is shown in . Arrange 9 displacement buckets under the nozzle, 9 in each row, the measuring buckets are made of 3 mm thick PMMA, the size is 20 cm × 20 cm, the vertical distance from the nozzle to the ground is the same as in , and the height is 2.0 m. First, use a kitchen balance with an accuracy of 0.01 g to weigh the dry tank, then turn on the nozzle, measure the mass of water collected at each position for 15 min and 30 min, and calculate the concentration of water collected in the middle of each measuring point for 15 min. Water quality, and then calculate the spray intensity of each measuring point. Arrange the data of each point into a ground spray intensity distribution map, as shown in .
Figure 4. Schematic diagram of the bucket experimental setup: (a) side view; (b) top view.
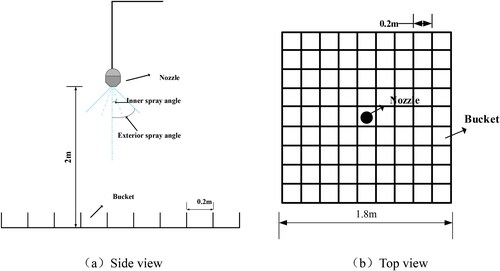
Figure 5. Average distribution of spray intensity of a single nozzle on the tunnel floor measured in three experiments.
Then adjust the size of the inner angle of the nozzle in the simulation, and sort out the spray intensity distribution of a single nozzle at the tunnel floor. Compare the spray intensity in the experiment to determine the inner angle of the simulated nozzle. The simulation results are shown in .
Figure 6. Four nozzle inner angles in the FDS.
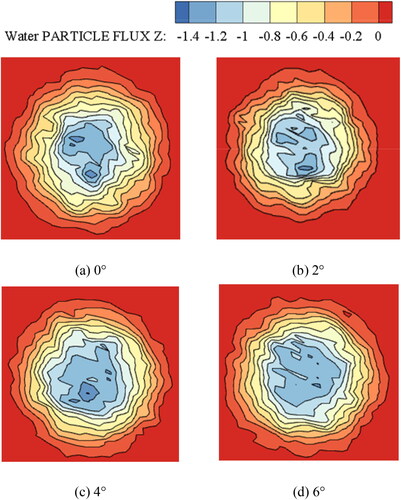
As seen in , as the nozzle inner angle increases from 0°to 2°, the centre of the spray intensity is significantly reduced, indicating that changes in the nozzle inner angle lead to the ground at the nozzle spray intensity quickly becoming larger. When the nozzle inner angle increases to 4°∼ 6°, the centre of the spray intensity of the maximum reduction slowly increases in the centre of the obvious ‘hollow’ phenomenon, and as the spray angle increases in the hollow area, it will affect the effect of the spray nozzle spray water mist.
Based on the above sensitivity analysis, the FDS simulation results of water curtain system isolating and preventing smoke in underground tunnel fire are closer to the actual fire scenario. Therefore, in the following simulation analysis, the number of particles sprayed by the nozzle per second is set as the default value of 5000, and the internal angle of spraying is 2°.
4. Results and discussion
4.1. Validation of FDS on predicting in belt fires
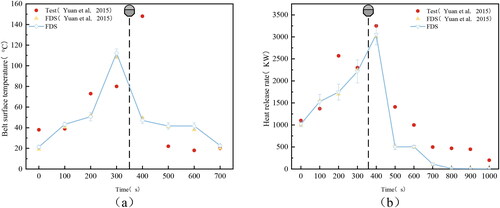
In a previous paper, conducted water mist suppression experiments. To study the effects of nozzle location, water flow rate and nozzle activation temperature on suppression of conveyor belt fires, the effects of nozzle location and activation temperature on belt fire suppression were found. In this paper, the experiments presented were used to validate key parameters in the simulation with FDS. The key parameters of the experiment do not include the number of droplets and the inner angle of the nozzle. The sensitivity analysis in this paper is used to obtain the best parameters. The FDS simulation data is compared with the Yuan experiment and FDS results to verify the feasibility of the simulation.
shows the comparison with Yuan’s experimental and simulated data. It can be first noticed that the three sets of data follow a similar growth trend, and the temperature predictions are achieved with good agreement (maximum relative error of 20%). In addition, the FDS simulation data are more similar because the FDS measurement modeling the nozzle with a full conical pattern causes a slight deviation from the experimental results, but does not affect the overall trend. The comparison with the belt fire prediction data shows that the method adopted in this paper is reasonable and the prediction effect is close to the actual situation.
Figure 7. The belt fire results observed by Yuan et al. (2015) vs. the results reproduced by FDS.
4.2. Influence of the water curtain system on the temperature field in the tunnel
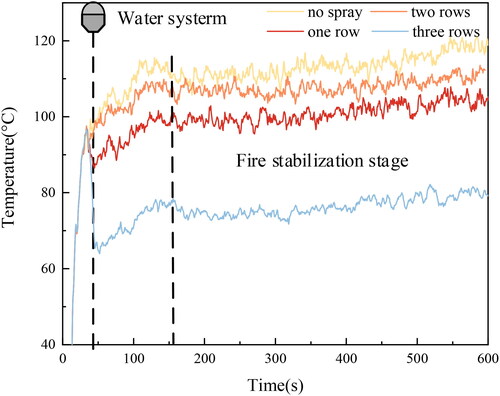
shows the variation in the temperature in the tunnel under different conditions. After ignition, there is a delay in the temperature rise over time as the measurement point is located 20 m upstream of the fire source. When the water curtain system is activated at approximately 50 s, the temperature starts to decrease and does not change dramatically from 150-600s after ignition, i.e. after entering the quasi-steady state phase. Next the quasi-steady state stage at t = 300 s was analysed
Figure 8. Variation curve of temperature in tunnel under different conditions 20 m below the fire source.
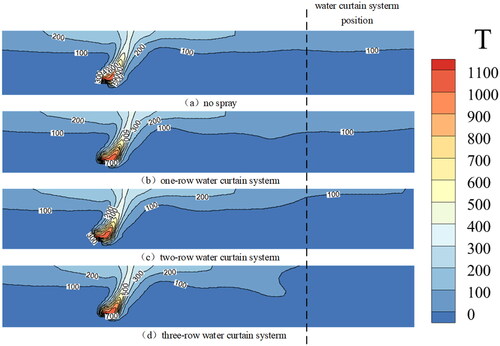
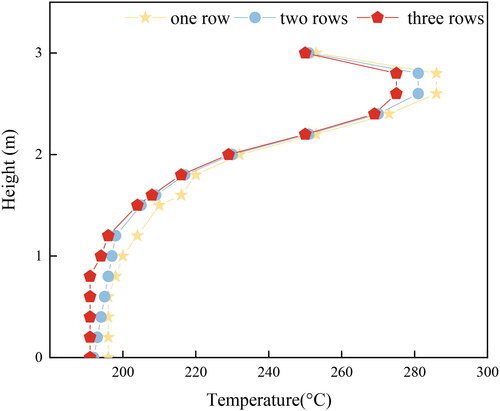
shows the temperature distribution along the centreline of the tunnel (X = 1.5 m) under different conditions. After the scenario obtain steady state for 300 s, it can be seen that when the water curtain system is switched on, the temperature downstream of the aisle gradually decreases as the number of water curtain rows increases. This is because the increase in the number of water curtain rows increases the total amount of water droplets, resulting in a significant thermal radiation attenuation effect. The temperature reduction is compared with that in working condition (a), where the high temperature zone is limited to the area between the water curtain system and the air inlet. The effect of the water curtain spray is very clear, and the ceiling jet (through the increase in temperature) is effectively blocked in this plane. In practice, the performance of the fire insulation can be improved by installing a multidrain mist type water curtain while keeping the total water mist consumption consistent.
Figure 9. Variation of temperature in tunnel at 300s.
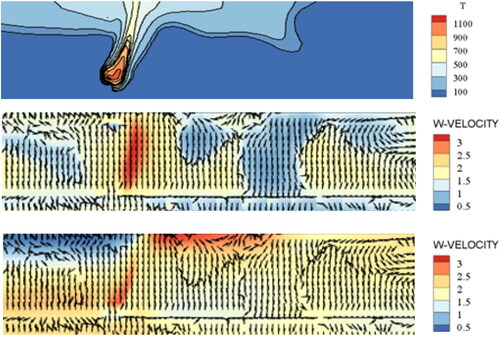
shows the effect of the water curtain system on the temperature and velocity fields (t = 300 s). The top diagram shows the blockage of the smoke by the water curtain. The temperature drops significantly as the hot smoke layer flows from left to right in the diagram to under the roof of the tunnel to reach the water curtain. The middle diagram clearly shows that there is significant upward movement in the water curtain area due to the jets between spray rows in the water curtain system impacting each other and colliding with each other, resulting in upward flow. These jets are entrained into the spray and merge to form an area of upward movement. The bottom diagram clearly shows that the longitudinal velocity component as the hot smoke enters the spray alternates between red and blue near the floor of the aisle, indicating alternating flow from left to right, and in the bottom diagram, the impact on the floor is also very clear. The process is on the left side of the water curtain, and the air flows from left to right horizontally along the top plate, then vertically downward (due to the dragging force and blocking effect of the spray) to horizontally along the bottom plate from left to right (due to the spray and smoke impinging on the floor).
Figure 10. Temperature field (top) for 300 s (X = 1.5 m), vertical velocity component (middle) and longitudinal velocity component (bottom).
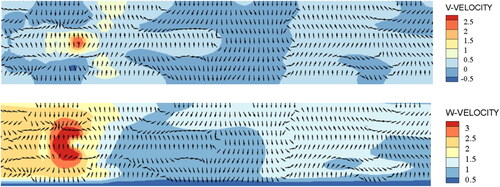
shows the velocity distribution at the middle height of 300 s (Y = 1.5 m). In the upper panel, the entrainment with air and hot flue gases into the water curtain is shown. The tendency for the vertical midplane flow to the right at Y = 1.5 m in the spray area is due to the 'pushing’ effect of the hot flue gases (the air flows from left to right). A clear combination of entrainment and impingement in the spray due to the upward flow between the sprays of the water curtain system is more clearly shown in the longitudinal velocity component of the graph below, indicating that the impact effect of the spray between the upward flows helps to hold back the flue gases. This is then superimposed on the pushing effect of the smoke from left to right, resulting in an asymmetrical pattern in the graph below.
Figure 11. 300 s (Y = 1.5 m) vertical velocity component (top) and longitudinal velocity.
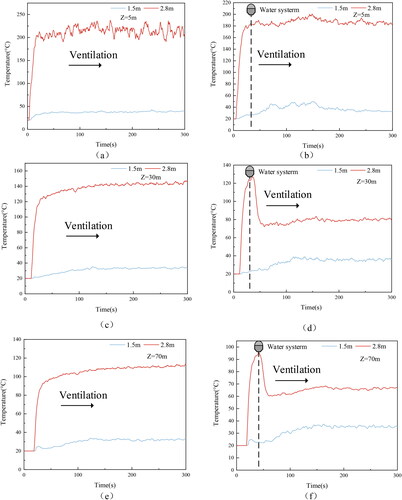
shows a quantitative comparison of the simulation results for the tunnel belt fire in the case no spray (left) and in the case with a three-row water curtain system (right). The water curtain system is activated after 40 s and figures represent the temperature evolution with the time at the location Z = 5 m upstream of the fire source and water curtain system, Z = 30 m downstream of the fire source and upstream of the water curtain system, and Z = 70 m downstream of the fire source and water curtain system (locations shown in ). The temperature profiles for Z = 5 m show that the activation of the water curtain system under natural ventilation has little effect upstream of the fire source. The activation of the water curtain system at Z = 30 m and Z = 70 m downstream from the fire source has some effect. As seen in (d) and (f), the effect of water spraying is greater at position Z = 30 m than at position Z = 70 m due to the greater effect of water spraying on the flame flow field at close range. It can also be observed that the temperature at Y = 2.8 m near the roof of the tunnel is much higher than that at Y = 1.5 m in the middle of the lane and that the water curtain system barely affects the smoke stratification upstream.
Figure 12. Temperature distribution in the vertical midplane.
4.3. Influence of the water curtain on the CO in the tunnel
shows the change curve of CO concentration in the tunnel. (left) shows the distribution of CO concentration in a 1.5 m-high horizontal section of the tunnel 300 s after the fire point. Under four working conditions, it is found that the area behind the fire source (50 ∼ 100 m) increases with the distance from the fire. When the water curtain system is added, the CO content decreases to a certain extent, which is less than the CO concentration in condition 4 with only ventilation, which indicates that the water curtain system can also effectively prevent toxic gases. (right) shows the CO concentration change curve at Z = 50m. It can be seen that the CO concentration has been showing a slow rising trend throughout the simulation process. This is because when the water curtain system is activated, the water vapor generated by the vaporization of the water mist droplets and the C generated by the pyrolysis of PVC react with water gas near the rubber surface, producing a large amount of co, resulting in a slow rise in the content, but its concentration in the downstream of the tunnel is far below the evacuation standard 5 × 10⁻⁶, that is, 5 ppm.
(3)
(3)
Figure 13. Upstream of the fire source Z = 5 m, between the fire source and water mist Z = 30 m, downstream of fire source Z = 70 m for no spray (left) and three-row water curtain system (right).
4.4. Influence of the water curtain system on visibility in the tunnel
Visibility is also one of the important parameters used to judge the safety of the fire site. Human eyelevel is usually between 1.2 m and 1.8 m. Wang et al. (Citation2021) used human eye heights of 1.5 m and 1.8 m to study visibility in the tunnel, so this study evaluated a horizontal slice at Y = 1.5 m to study the temporal visibility of people in the tunnel while avoiding disasters.
shows the visibility change curve downstream of the tunnel (Y = 1.5 m) underwater curtain systems with different numbers of rows. When there is no water spray, the visibility decreases rapidly after the smoke spreads, and the visibility in the channel decreases to less than 2 m. After the water curtain system is opened, the visibility of the space downstream of the water curtain rises due to the deflection of the flue gas flow path. This is because the main factor affecting the visibility is the carbon black particles in the flue gas. After the water mist is sprayed, the water droplet particles condense with the carbon black particles, and the water mist effectively washes the carbon black particles in the flue gas, so the visibility is effectively improved. The change process of the visibility curve confirms the conclusions from the literature that state that water mist washes out smoke particles and reflects the smoke suppression effect of the water curtain systerm.
Figure 14. Numerical visibility distributions.
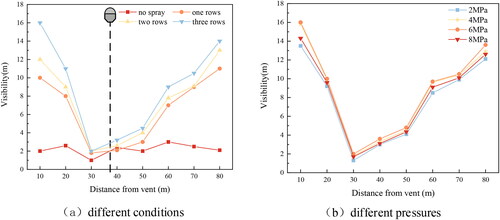
shows the visibility distribution under different spray pressures. It can be observed that when the spray pressure is 6 MPa, the visibility in the tunnel rises from the lowest 2 m to 13.6 m. At 4 MPa, the visibility in the tunnel is at least 1.8 m and rises to 12.9 m. At 2 MPa, it rises from 1.3 m to 12.6 m and at 8 MPa, it rises from 1.7 m to 12.1 m.
In the whole process, the visibility downstream of the water mist system is the largest at 6 MPa and the lowest at 4 MPa. Due to the large droplet size and small fog flux at 4 MPa, the smoke suppression effect is poor, and the least effective visibility improvement. Under other working conditions, due to the improvement of the efficiency of the water mist scouring the smoke particles, the smoke suppression effect is obvious. However, when the pressure exceeds 6 MPa, due to the increase in the momentum of the mixed smoke water flow, the rebound of the airflow after hitting the ground is obvious, resulting in a reduction in the visibility recovery rate. The visibility first increased and then decreased with increasing spray pressure. This shows that the greater the spray pressure is, the better. With increasing pressure, the change in the fog characteristic parameters gradually decreases. At the same time, there is an optimal value for smoke suppression. In this study, 6 MPa has the best smoke suppression effect. Therefore, in practical applications, the spray pressure should be reasonably selected according to the actual height of the channel and the requirements of personnel evacuation to prevent the air from mixing with smoke and water and maintain a high momentum when it is close to the ground to impact the ground and rebound.
5. Conclusions
In this paper, CFD simulations (FDS) have been used to study the temperature, velocity field and toxic and hazardous gas changes of an alleyway belt fire under natural ventilation after activation of a water curtain system. A sensitivity analysis was first performed on the computational grid (for flow), with default settings already applied for turbulence, combustion and radiation. Then, the sensitivity analysis of the spray particles in the nozzle of the water curtain system and the inner angle of the nozzle is carried out, and the bucket test is carried out to observe the spray intensity, and the optimal number of spray particles is 5000, and the inner angle of the nozzle is 2°. Finally, a simulation study was carried out, which led to the following conclusions.
After the tunnel belt fire, the water curtain system is activated at 50 s, and the temperature begins to decrease significantly, entering a quasi-steady-state phase in the 150 s-600 s range after ignition. The greater the number of water curtain rows, the better the control effect on the temperature of the lane. Downstream of the tunnel, increasing the number of water curtain rows has a better the effect on the obstruction of the hot flue gases.
In the vicinity of the fire source, the flames obstruct the natural ventilation airflow, which tends to bend outwards, pushing the hot flue gases towards the sidewalls of the tunnel. When the hot smoke passes through the water curtain system, the flow obstruction caused by the water spray system at Y = 1.5 m downstream of the tunnel, the flow field around the fire source undergoes a significant push change.
Before and after the water curtain system is started, the CO concentration is in a steady growth state, and the increase of CO concentration is effectively controlled after the water curtain system is activated. At the same time, the visibility of the downstream rises from 2m, indicating that the water mist had a good flushing effect on carbon black particles. This optically explained the smoke-stopping effect of the water mist-type of water curtain. For the smoke barrier effect, a higher spray pressure is not better as the visibility increases with the increase of spray pressure and then decreases. There is an optimal value of spray pressure, and in this study, the best smoke barrier effect was found at 6 MPa.
| Nomenclature | ||
| u | = | velocity vector, m/s |
| ρ | = | gas density, kg/m3 |
| Yi | = | mass fraction of substance L |
| D | = | diffusion coefficient, m2/s |
| d | = | diameter of the particles, m |
| g | = | acceleration of gravity, m/s2 |
| qr | = | radiant heat flux, kW/m2 |
| h | = | Enthalpy, kJ |
| Ta | = | ambient temperature, K |
| f | = | external force vector (excluding gravity), kg/s2/m. |
| k | = | thermal conductivity, W/m/K |
| = | heat release rate per unit volume, kW/m3 | |
| = | production rate per unit volume of substance L, kg/s/m3 | |
| = | empirical parameter | |
| = | fire source intensity, kW | |
| = | gas density at ambient temperature, kg/m3 | |
| τ | = | viscous pressure vector, kg/s2/m |
| = | specific heat capacity of air at constant pressure, | |
Disclosure statement
We declare that we have no financial and personal relationships with other people or organizations that can inappropriately influence our work, there is no professional or other personal interest of any nature or kind in any product, service and/or company that could be construed as influencing the position presented in, or the review of, the manuscript entitled author.
Data availability statement
The datasets generated and analyzed during the current study are available from the corresponding author on reasonable request.
Additional information
Funding
References
- Blanchard E, Boulet P, Fromy P, Desanghere S, Carlotti P, Vantelon JP, Garo JP. 2014. Experimental and numerical study of the interaction between water mist and fire in an intermediate test tunnel. Fire Technol. 50(3):565–587. doi:10.1007/s10694-013-0323-z.
- Dembele S, Wen JX, Sacadura J-F. 2001. Experimental study of water spray for the attenuation of fire thermal radiation. J Heat Transf. 123(3):534–543. doi:10.1115/1.1371921.
- Dombrovsky LA, Dembele S, Wen JX. 2016. A simplified model for the shielding of fire thermal radiation by water mists. Int J Heat Mass Transf. 96:199–209. doi:10.1016/j.ijheatmasstransfer.2016.01.028.
- Dong FU, Gang XU, Mao DB. 2012. Application of roof disaster monitoring system in mining face. Coal Mining Technol. 10:127–186.
- Emilio P, Fabio C, Bruno F. 2008. From laboratory simulation to scale-up and design of spray barriers mitigating toxic gaseous release. Process Saf Environ Protect. 87(1):26–34.
- Fan YJ, Zhao YY, Hu XM, Wu MY, Xue D. 2020. A novel fire prevention and control plastogel to inhibit spontaneous combustion of coal: its characteristics and engineering applications. Fuel. 263:116693. doi:10.1016/j.fuel.2019.116693.
- Jiao Z, Yuan S, Ji C, Mannan MS, Wang Q. 2019. Optimization of dilution ventilation layout design in confined environments using Computational Fluid Dynamics (CFD). J Loss Prev Process Ind. 60:195–202. doi:10.1016/j.jlp.2019.05.002.
- Li Q, Lin B, Zhao S, Dai H. 2013. Surface physical properties and its effects on the wetting behaviors of respirable coal mine dust. Powder Technol. 233:137–145. doi:10.1016/j.powtec.2012.08.023.
- Lian H, Yi H, Yang Y, Wu B, Wang R. 2021. Impact of coal mining on the moisture movement in a vadose zone in open-pit mine areas. Sustainability. 13(8):4125. doi:10.3390/su13084125.
- Liang Q, Li Y, Li J, Xu H, Li K. 2017. Numerical studies on the smoke control bywater mist screens with transverse ventilation in tunnel fires. Tunn Undergr SpaceTechnol. 64:177–183. doi:10.1016/j.tust.2017.01.017.
- Lin P, Lo SM, Li T. 2014. Numerical study on the impact of gradient on semi- transverse smoke control system in tunnel. Tunn Undergr Space Technol. 44:68–79. doi:10.1016/j.tust.2014.07.011.
- Liu Q, Zhang Y, Niu F, Li L. 2015. Study on the flame propagation and gas explosion in propane/air mixtures. Fuel. 140:677–684. doi:10.1016/j.fuel.2014.09.123.
- Sun J, Fang Z, Tang Z, Beji T, Merci B. 2016. Experimental study of the effectiveness of a water system in blocking fire-induced smoke and heat in reduced-scale tunnel tests. Tunn Undergr Space Technol. 56:34–44. doi:10.1016/j.tust.2016.02.005.
- Tajadura RB, Morros CS, Marigorta EB. 2006. Influence of the slope in the ventilation semi-transversal system of an urban tunnel. Tunn Undergr Space Technol. 21:21–28.
- Tang Z, Vierendeels J, Fang Z, Merci B. 2013. Description and application of an analytical model to quantify downward smoke displacement caused by a water spray. Fire Saf J. 55:50–60. doi:10.1016/j.firesaf.2012.10.012.
- Teacoach KA, Rowland JH, Smith AC. 2011. Improvements in conveyor belt fire suppression systems for U.S. coal mines.Trans. Soc Min Metall Explor. 328:502–506.
- Vaari J, Hostikka S, Sikanen T. 2012. Numerical Simulations on the Performance of Waterbased Fire Suppression Systems Fire Safety J. 08:67–91.
- Wang W, He T, Huang W, Shen R, Wang Q. 2018. Optimization of switch modes of fully enclosed platform screen doors during emergency platform fires in underground metro station. Tunn Undergr Space Technol. 81:277–288. doi:10.1016/j.tust.2018.07.015.
- Wang WH, Zhu ZX, Jiao ZR, Mi HF, Wang QS. 2021. Characteristics of fire and smoke in the natural gas cabin of urban underground utility tunnels based on CFD simulations. Tunn Undergr Space Technol. 109:103748. doi:10.1016/j.tust.2020.103748.
- Yu H-Z, Zhou X, Carpenter J. 2017. Physical scaling of water mist fire extinguishment in industrial machinery enclosures. Fire Saf. J. 91:596–605. doi:10.1016/j.firesaf.2017.03.033.
- Yuan L, Mainiero RJ, Rowland JH, Thomas RA, Smith AC. 2014. Numerical and experimental study on flame spread over conveyor belts in a large-scale tunnel. J Loss Prev Process Ind. 30:55–62. doi:10.1016/j.jlp.2014.05.001.
- Zhou Y, Bi H, Wang H, Lei B. 2019. Critical velocity in the transverse passages of a railway tunnel rescue station with semi-transverse ventilation. Tunn Undergr Space Technol. 92:103064. doi:10.1016/j.tust.2019.103064.
- Zhou Y, Bi H, Wang H, Lei B. 2020. Fire characteristics of rescue station inside railway tunnel with semi-transverse ventilation. Tunn Undergr Space Technol. 98:103303.1–103303.13. doi:10.1016/j.tust.2020.103303.