
 ?Mathematical formulae have been encoded as MathML and are displayed in this HTML version using MathJax in order to improve their display. Uncheck the box to turn MathJax off. This feature requires Javascript. Click on a formula to zoom.
Abstract
In this study, a total of 34,893 landslides collected from the Sichuan Province of China are used to reveal their spatial distribution. Correlations between the spatial distribution of landslides and five main factors [i.e. topography, rainfall, lithology, peak ground acceleration (PGA), and human activity] are analyzed based on the Geographical Information System (GIS) platform. Topographic factors exert a significant influence on landslide occurrence, and other factors also sensitive to landslides include lithology (Classes 3 and 4), PGA (≤0.15 g), rainfall (90–140 mm), and road density (≤0.6 km/km2). The geographical detector model is used to detect the relative importance of individual influencing factors and the factor interaction effects on the landslide distribution. The results show that the interacting factors between rainfall and PGA, lithology, river density, and road density are more closely related to the spatial distribution of landslides than every single factor. The results of this study can provide a foundation and insights for hazard reduction schemes in the future.
1. Introduction
Landslides are one of the widespread geological hazards around the world and can cause numerous casualties, serious economic losses, and substantial environmental damage (Li et al. Citation2021; Zhao et al. Citation2021; Franceschini et al. Citation2022; Tanyaş et al. Citation2022). Landslides are often accompanied by a series of major hazards in the influenced areas. Examples include transportation disruptions, destruction of agricultural land and factories, river blockages, and even buries villages and people. It is a major constraint on the economic construction and development of local areas (Chen et al. Citation2021; Zhou et al. Citation2022). Under the influence of strong tectonic activities, frequent climate changes, and human activities, the losses caused by landslides have an increasing trend, especially in mountainous areas (Huang et al. Citation2021). With the continuous increase in population and the development of the social economy in mountainous areas, the exploitation of the environment by human beings is increasing, which seriously destroys the geological environment and increases the probability of landslide occurrences (Jiang et al. Citation2022).
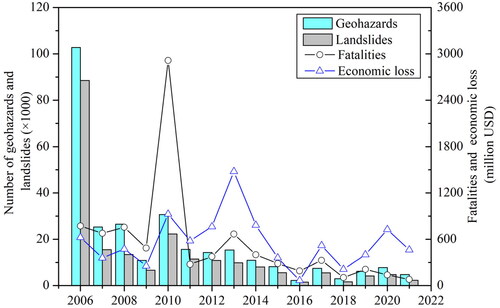
Approximately two-thirds of China’s territory is located in mountainous areas, making it one of the countries with the highest frequency of geological disasters in the world (Lin and Wang Citation2018). The statistics from the China Geological Environment Monitoring Institute show that the number of geological disasters in China is recorded at 292,290, which resulted in 8672 total deaths, with ∼542 fatalities per year during 2006–2021 (). The direct economic loss was ∼9.004 billion US$. In particular, landslides are considered to be the most common type of geological hazard in China’s mountain areas, accounting for 72.67% of all events. Sichuan Province in China is highly exposed to landslide hazards because of its unique geomorphological, geological, and climatic characteristics (Cui et al. Citation2021; Sun et al. Citation2021; Yi et al. Citation2021; Xia et al. Citation2022). In recent years, many disastrous landslides have occurred in Sichuan Province. For example, on 10 July 1989, a catastrophic landslide occurred in the Huaying Mountains in Guang’an City, Sichuan Province, that had a volume of 0.2 million m3, destroyed four villages, and killed 221 people (Tang et al. Citation2021). The direct economic loss was ∼0.75 million US$. On 5 September 2004, a large-scale landslide was triggered by heavy rainfall in Tiantai Town of Xuanhan County, Sichuan Province (Huang Citation2009). The landslide destroyed 2983 houses, making 1255 people homeless and causing a direct economic loss of more than 14.5 million US$. In 2017, a large catastrophic landslide with a volume of >18 million m3 occurred in Xinmo village, Sichuan Province, which claimed 83 human lives (Chang et al. Citation2022). On 14 August 2019, the Ganluo landslide in the Chengkun Aidai railway station, Ganluo County, Sichuan Province, killed 17 people with an accumulation volume of ∼0.05 million m3 (Zhu et al. Citation2020). On 21 August 2020, a disastrous landslide with a volume of >5 million m3 occurred in Hanyuan County, Sichuan Province, destroyed eight houses, and caused nine fatalities (He et al. Citation2021).
Figure 1. Graph showing the number of recorded geohazards, landslides, the amount of economic loss, and the number of fatalities for the period 2006–2021.
The spatial distribution of previous landslides can indicate the likelihood of future landslides within a specific area (Zhuang et al. Citation2018; Xu et al. Citation2020; Shao et al. Citation2023). A considerable number of studies on landslide distribution have been reported in the scientific literature. For example, Peng et al. (Citation2019) investigated the regularity of the regional distributions of loess landslides and the governing factors of their occurrences and found that the Chinese Loess Plateau can be split into eight zones with high potential for landslides that are classified into six genetic categories. In the Bailong River Basin of the NE Qinghai-Tibet Plateau, Qi, Meng, et al. (Citation2021) carried out a systematic analysis of large landslides. They discovered that fault zones control the spatial distribution and geomorphic characteristics of large landslides. Qi, Zhao, et al. (Citation2021) studied the correlation between landslide geographical distribution and causative factors. The results showed that the landslide distribution on various scales was closely correlated with the annual precipitation index, average slope, and vegetation coverage index. Wang, Clague, et al. (Citation2021) discussed the association between landslides and the strength of rock masses. The results revealed that rock mass strength controls the stability of slopes, but the major failure causes are rock uplift and river incision, rather than a decrease in rock strength, as has been suggested in some tectonically passive areas. Understanding the spatial distribution of landslide occurrence is a prerequisite for landslide risk mapping and susceptibility assessment. However, it is challenging to evaluate the spatial distribution of landslides since, based on current landslide classifications, the spatial characteristics of historical landslides are poorly understood. Furthermore, the factors that affect the distribution of landslides in different regions may vary substantially, and thus, scientific and technical efforts are required to bridge the gap.
Over the years, the landslides distributed in Sichuan Province have been extensively explored by several scholars. Research works have mainly focused on the triggering mechanisms, characteristics, susceptibility assessments, and stability analysis of landslides (Cao et al. Citation2019; Yang et al. Citation2019; Li et al. Citation2020; Wang et al. Citation2020; Wu et al. Citation2021; Hou et al. Citation2022; Ji et al. Citation2022; Peng et al. Citation2022; Yao et al. Citation2022). However, these findings are difficult to apply to other landslide disasters in Sichuan Province. Environmental conditions influencing landslide occurrence include topography, geomorphology, lithology, geologic structure, tectonic activity, rainfall, earthquakes, and anthropogenic activity, many of which are specific to a particular area (Pudasaini and Krautblatter Citation2021; Wang, Schweizer, et al. Citation2021; Troncone et al. Citation2022). Identifying the various factors influencing landslide distribution and occurrence not only facilitates a comprehensive understanding of landslide mechanisms but also provides a scientific basis for landslide vulnerability, hazard, and risk assessment. However, there is a lack of systematic research on the statistical relationships between geoenvironmental factors and the spatial occurrence of landslides in the entire Sichuan Province. Geographical information systems (GISs) are excellent at managing and analyzing landslide data from a wide range of sources. GIS in landslide research has the potential to enhance our ability to quantitatively and spatially evaluate landslide disasters.
Characterization of the spatial distribution of landslides and their influential factors is not only meaningful but also fundamental for geomorphological studies and natural hazard evaluation. Documenting landslide occurrence in Sichuan Province and deducing the factors that are related to mass wasting are prerequisites for the assessment of regional hazards and risks in Sichuan Province. In this study, we attempt to analyze the spatial distribution of landslides in the Sichuan Province, with the aim of understanding the relationships between possible influencing factors and the distribution and development of landslides. The results of this study can provide more fundamental information for forecasting potential risks in landslide regions.
2. Regional setting
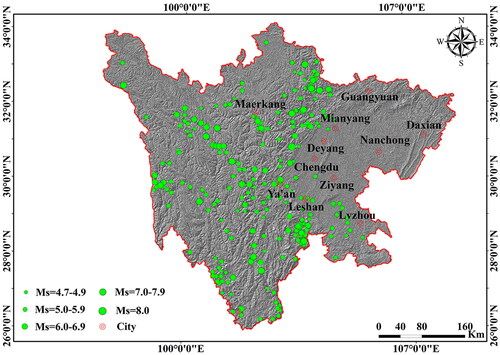
Sichuan Province, located in southwest China, occupies an area of 486,100 km2 and lies between longitudes of 97°21′ to 108°31′ E and latitudes of 26°03′ to 34°19′ N (). The Yangtze River and its tributaries (such as the Jinsha River, Yalong River, and Minjiang River) run through Sichuan Province. The geomorphology and topography of the study area are highly diversified and are composed of basins, hills, mountains, and plateaus (Yang et al. Citation2020). The study area is bordered by the Tibetan Plateau in the west, the Daba Mountains, Min Mountains, and Bayankala Mountains in the north, and the Yunnan-Guizhou Plateau in the south. The altitude of the study area varies from 88 to 7845 m above sea level, with an average altitude of 3750 m. The slope angles in the area range between 0 and 89°, with an average of 44°. The study area is strongly influenced by the Southeast Pacific Ocean monsoon and the Southwest Indian Ocean monsoon. Sichuan Province can be divided into three major climates, including the mid-subtropical humid climate of the Sichuan Basin, the subtropical and semihumid climate of southwestern Sichuan, and the alpine climate of the northwestern Sichuan Plateau. The study area belongs to a temperate continental monsoon climate, being warm in summer and cool in winter. The average temperature in the region ranges from 5 (January) to 27 °C (July). According to the Sichuan Provincial Meteorological Service (http://sc.cma.gov.cn/), the average annual rainfall ranges from 900 to 1200 mm, decreasing from east to west. The major fault zones in the study area include the Longmenshan fault zone, the Jinsha River fault zone, and Daliangshan fault zone, and the Minjiang fault zone. The seismic activity of the study area is relatively strong, and 186 large earthquakes of Ms ≥ 5.0 (such as the 1973 Ms 7.6 Luhuo earthquake, the 2008 Ms 8.0 Wenchuan earthquake, the 2013 Ms 7.0 Lushan earthquake, and the 2017 Ms 7.0 Jiuzhaigou earthquake) have been recorded in this area ().
Figure 2. Location map of the study area.
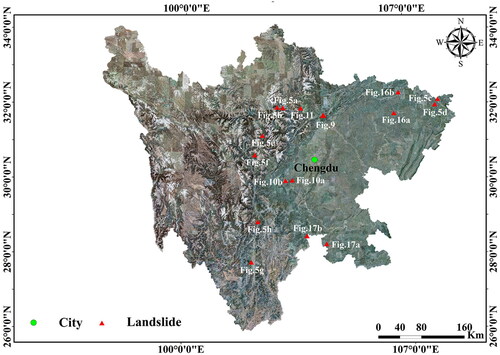
Figure 3. Distribution of large historical earthquakes in Sichuan Province.
3. Data and methods
3.1. Data
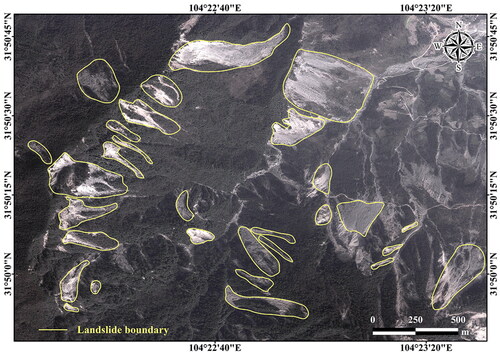
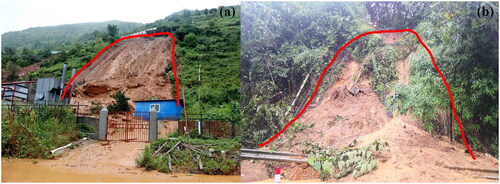
The landslide distribution data in Sichuan Province were acquired from the Department of Natural Resources of Sichuan Province, a government institution primarily responsible for the monitoring and investigation of geologic hazards. A total of 34,893 landslides were identified, including occurrence times, latitude and longitude coordinates, landslide names, and areas and volumes (). shows eight typical landslides in the study area. Actual landslide occurrence is controlled by a variety of environmental variables, such as topography, lithology, rainfall, earthquakes, and human activity. To analyze the effects of these variables on the spatial distribution of landslides, fourteen factors (), including slope angle, elevation, slope aspect, cutting depth, river density, relief amplitude, surface roughness, stream power index (SPI), plan curvature, profile curvature, road density, rainfall, PGA, and lithology (), were considered for the statistical analysis. These factors can be divided into five categories: topography (slope angle, aspect, elevation, relief amplitude, cutting depth, SPI, plan curvature, profile curvature, river density, and surface roughness), climate (rainfall), geology (lithology), seismic factor (PGA), and human activity (road density). The details of the available data are listed in . The topography data were acquired by processing the digital elevation model (DEM) from ALOS PALSAR with a 12.5-m resolution. Rainfall data can be provided by the Sichuan Provincial Meteorological Service. Google Earth© images were used to obtain information on roads. The lithology data were extracted by vectorizing geological maps at a scale of 1:200,000.
Figure 4. The spatial distribution of landslides in Sichuan Province.
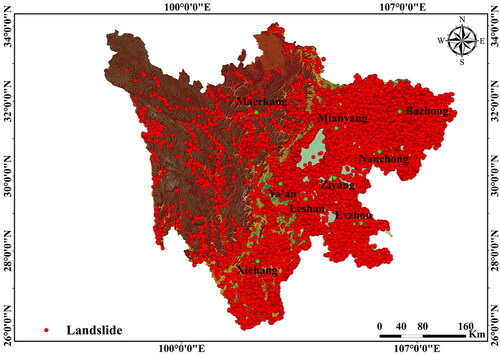
Figure 5. Photographs of landslides in the study area.
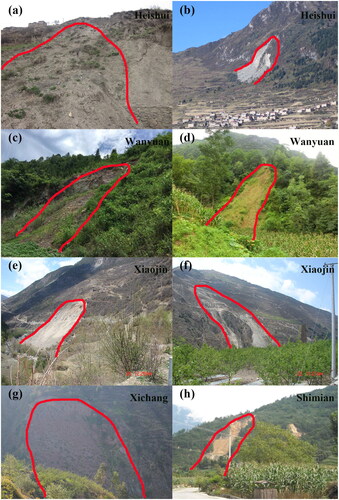
Figure 6. Landslide influencing factor maps: (a) elevation, (b) slope angle, (c) slope aspect, (d) relief amplitude, (e) cutting depth, (f) river density, (g) plan curvature, (h) surface roughness, (i) profile curvature, (j) SPI, (k) rainfall, (l) lithology, (m) PGA, and (n) road density.
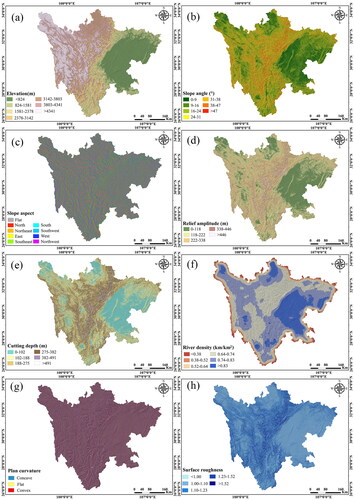
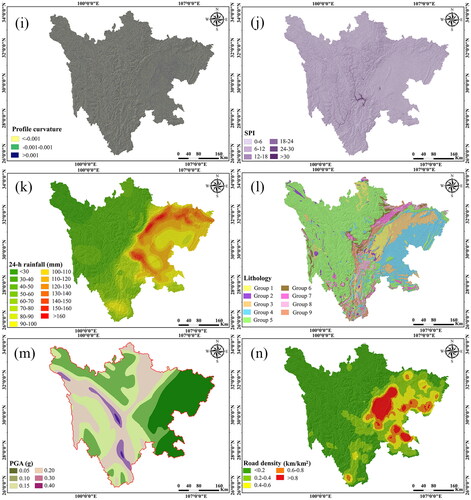
Table 1. Description of geological units of the study area.
Table 2. Details of the dataset used in the study.
3.2. Methods
To explore how environmental variables influence the spatial distributions of landslides, the landslide concentration index (LCI) is introduced here (Qi et al. Citation2010; Zhan et al. Citation2018). The LCI is calculated according to the following equation (Zhan et al. Citation2018):
(1)
(1)
where Li is the number of landslide cells of class i, L is the total number of landslide cells in the study area, Fi is the number of cells of class i, and F is the number of total pixels in the study region.
The geographical detector model (GDM), first proposed by Wang et al. (Citation2010), is a statistical method developed to measure the spatially stratified heterogeneity of an event and assess the association between the event and potential influencing factors. The general assumption of GDM is the following: if an independent variable (X) controls or contributes to a dependent variable (Y), then the spatial distribution of Y should be similar to that of X (Luo et al. Citation2016). The GDM was first applied to medical geography (Wang et al. Citation2010) and then to studies of the socioeconomy (Kim et al. Citation2018), eco-environment (Liang and Yang Citation2016), and landslide susceptibility assessment (Luo and Liu Citation2018). One of the advantages of GDM is that both quantitative and qualitative data can be analyzed. The calculation is as follows (Wang et al. Citation2010):
(2)
(2)
where q is the power of the determinant, N is the number of sample units (grids) in the entire study region, Ni is the number of samples in zone i, σ2 is the variance of the entire study region, and σi2 represents the variance within stratum i. The q-value ranges from 0 to 1, and the larger the q-value is, the stronger the explanatory power of the determinant. When q = 1, Y is completely determined by X. In contrast, when q = 0, Y is completely unrelated to X.
Another advantage of the GDM is the ability to uncover the interaction effect between any two independent variables. The interactive detector describes whether two influencing factors together weaken or enhance each other or whether they affect the dependent variable independently. More detailed descriptions can be found in these studies (Wang et al. Citation2010; Ju et al. Citation2016). In this paper, the dependent variable Y can be quantified by the landslide density of Sichuan Province (), which can be calculated with the point density tool in ESRI ArcGIS® 10.2.
Figure 7. Landslide density map of Sichuan Province: (a) seismic landslides and (b) rainfall landslides.
4. Spatial analysis of landslides with possible influencing factors
4.1. Correlation with topography
Plan curvature represents the shapes of the slopes and influences the concentration of soil moisture. The correlation between plan curvature and landslide distribution is displayed in . As the plan curvature gets closer to zero, the values of landslide abundance proxies (frequency and LCI) decrease. These results indicate that landslides occur more frequently in concave and convex areas. It was not possible to determine a clear effect of plan curvature on the occurrence of landslides for this case, as both convex and concave terrain were similarly influenced by slope failures. Concave slopes, commonly covered by thick layers of loose weathered materials, are prone to instability under the influence of rainfall. The horizontal compressive stress of the convex slopes along the slope surface is weak, and sometimes even tensile stress occurs. The topographic amplification effect of the convex slope is obvious under earthquake action, which is not conducive to the stability of the slope. Profile curvature can determine the driving and resistance forces in the direction of a potential slide. Fifty percent of all landslides occurred at a profile curvature of >0.001, which covered an area of 50.43% (). The LCI value is the largest (1.0036) in the < −0.001 class, followed by >0.001 (1.0007) and −0.001–0.001 (0.6968). For the values of frequency and LCI, profile curvature and plan curvature have similar trends.
Figure 8. The relationship between possible influencing factors and landslide abundance proxies (frequency and LCI).
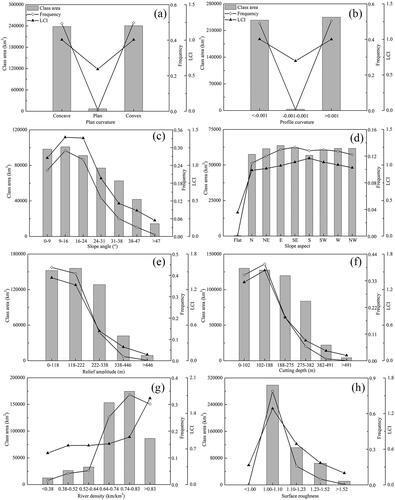
Gentle and medium terrain gradients dominate Sichuan Province, as 75.57% of the study area has slope gradients <31°. A total of 77.25% of the landslides lie in the slope gradient range <24°, which accounts for 59.73% of the gradients in the area. The tendencies of frequency and LCI with slope gradient are similar. The landslide abundance proxies increase with increasing gradient until the maximum appears in the 9–16° category and then decrease with increasing slope gradient (). The minimum frequency and LCI occurred at slope angles higher than 47°, and their values were 0.007 and 0.226, respectively. The low frequency of landslides in steeper slopes is mainly because of the small number of such cells. In addition, the steep natural slopes in the study area are mainly composed of bedrock with strong weathering resistance and thus are not prone to landslides.
shows the correlation of landslide distribution with the slope aspect. The area of each class occupies a similar area except for the flat class. The two landslide abundance proxies show similar correlations with the slope aspect. Our analysis indicates that nearly 51.81% of all landslides occurred on the slope aspects of the southeast, south, southwest, and west directions. The values of LCI for these directions are >1.0, indicating a higher probability of landslides. Conversely, the LCI values of the remaining slope aspect are <1, indicating a low probability of landslide occurrences. Particularly, for the slope aspect flat, this value is as low as 0.33. Some landslides occurred in the flat area because the centres of the landslide polygons were used for analysis. The pixel size of the DEM may also be partially responsible for this phenomenon.
Variations in relief amplitude are relatively smaller in the eastern part, generally <118 m, where many landslides are seen ( and ). As shown in , the two landslide abundance proxies decrease rapidly with increasing terrain relief. Values of LCI are >1 when relief amplitudes are <222 m, indicating a higher probability of landslides. When relief amplitudes are >222 m, LCI values are below 1.0, meaning a weak control of terrain on landslide distribution. 84.58% of the landslides are distributed in the relief amplitude range <222 m, which accounts for 63.21% of gradients in the area. The reason why the landslides are mainly concentrated in areas with lower relief amplitudes is that these areas are relatively flat and suitable for human habitation, and the destruction of human activities on the slope is more serious.
Landslides are preferentially distributed on the cutting depth of <275 m, occupying 93.26% of the total landslide number. The cutting depth of 275–382 m has a larger area: 83,820.7 km2, amounting to ∼17.20% of the entire study area (). However, only ∼5.90% of the landslides occurred in this area. When the cutting depth increases, the number of landslides increases first and then decreases (). On cutting depths >0 m and smaller than 188 m, the LCI values are >1, indicating that landslides are more likely to occur on these slopes. For other cutting depth ranges, the LCI values are <1, indicating that areas in these classes were less prone to landslides. Under the cutting effect of flowing water, the slope in the study area becomes higher and steeper, and the stability becomes worse. However, it is not that landslides are more likely to occur when the cutting depth is greater. The increase in cutting depth promotes the continuous increase in slope gradient, which limits the development of landslides to a certain extent because when the slope exceeds a certain slope, the landslide may transform into other disasters. In addition, hillslopes that are excessively steep hinder runoff accumulation and contrarily restrain landsliding by rainstorms.
The correlation between landslide distribution and river density is shown in . Rivers drive the presence of landslides in the study area, and the occurrence frequency of landslides increases with increasing river density, except for densities >0.83 km/km2. A large number of landslides are mainly concentrated at river densities >0.64 km/km2, accounting for 89.05% of the total. The maximum LCI value (1.70) occurs at a river density of >0.83 km/km2, and the minimum value (0.62) occurs in the <0.38 km/km2 range. The direct proportionality between river density and landslide occurrence observed in the study area is a consequence of the terrain’s susceptibility to undercutting of slopes by river erosion. River incisions and bank erosion changed the three-dimensional stress state of slopes, increased the gravitational potential energies of slopes, and finally led to slope instability near the rivers.
The surface roughness of most of the study area is <1.23. Due to the largest areal coverage (410,128.8 km2, 84.43%), 94.64% of the landslides fall in the surface roughness of <1.23 (). The values of frequency and LCI show an increasing trend with increasing surface roughness and reach their maximum values in the range of 1.0–1.1 and then decrease rapidly in the range of more than 1.1. The LCI values are >1 within surface roughness categories of 1.0–1.1, indicating a higher probability of landslides. The LCI values of the remaining surface roughness are <1, indicating that such slopes are not prone to landslides. Landslides tend to be concentrated in locations with lower surface roughness because the slopes in these areas have weak weathering resistance and the damage caused by human activities to the slope is relatively serious.
shows the variation between the concentration of landslides and elevation. The values of frequency and LCI decrease with increasing elevation. The landslides are mostly distributed in the lower and middle elevation areas. The slopes falling in elevation classes of <824 m have the largest landslide abundances, which are 0.6687 in frequency and 2.57 in LCI. Nearly 92.54% of the landslides occurred at elevations of <2378 m. Human activities (such as mining, highway construction, and hydraulic engineering) are mainly concentrated in the lower and middle elevations and have a significant impact on the aforementioned landslide distribution pattern. Less than 0.29% of all landslides occurred at elevations >3803 m. The minimum LCI value (0.001) appears at elevations >4341 m. The landslide concentration drops abruptly at higher elevations. The high-elevation region meets the terrain conditions for the occurrence of landslides, but slippery material is lacking.
The total area with a stream power index (SPI) <6 is ∼398,132.8 km2, accounting for 81.96% of the entire area. Approximately 82.79% of the landslides occurred at SPI values of <6. As the SPI increases, the number of landslides decreases (). Assessment of SPI showed that the classes <6 and >30 have a high correlation with landslide occurrence. The minimum LCI value appears in the 12–18 range, indicating that landslides are less likely to occur on these slopes. The maximum LCI value (1.02) is a product of the low frequency of occurrence of the high SPI in the region coupled with the high frequency of occurrence of landslides in this area.
4.2. Correlation with lithology
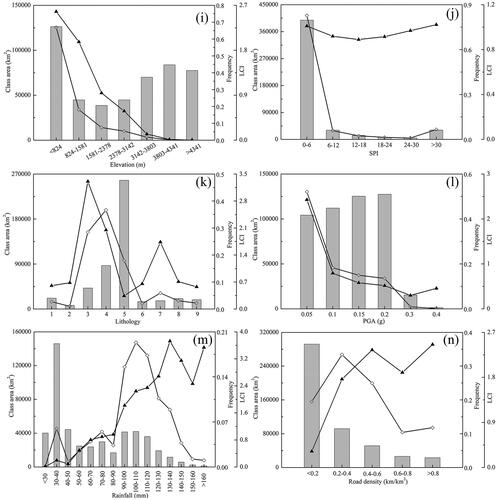
The lithological unit exerts an important influence on landslide occurrence. There are nine lithological units on the geological map (). Among the different lithological classes, Class 5 covers the largest area: 257,377.3 km2, amounting to ∼52.99% of the study area. However, only ∼19% of the landslides occurred in this area. A total of 65.15% of all landslides occurred in Classes 3 and 4, which covered only 26.51% of the study area (). Landslide concentration sharply fluctuates in all lithological classes because each class has distinct physical properties that assist or resist slope failures. The highest LCI with a value of 3.31 appeared in Class 3 lithologies, followed by Class 4 and 7 lithologies with LCI values of 2.05 and 1.73, respectively. The LCI values of the remaining lithology classes are <1, indicating that these classes are not prone to landslides.
4.3. Correlation with seismic factor
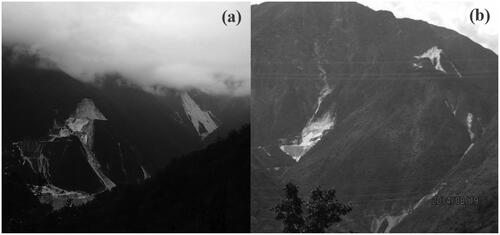
The curve in does not show a positive correlation between peak ground acceleration (PGA) values and the landslides, and the landslide frequency in classes of PGA ≤ 0.15 g is much higher than those in higher PGA classes. The total area of the PGA classes of ≤0.15 g covers 341,617.0 km2, accounting for ∼70.32% of the total. The total number of landslides in this area is 29,776, amounting to 85.34% of the total landslides. The highest landslide frequency (52.07%) occurred in the PGA 0.05 g class, which covered only 21.46% of the study area. Overall, the values of frequency and LCI decrease with increasing PGA values. The minimum frequency (0.13%) occurs in the PGA 0.4 g class. In fact, the area of PGA 0.4 g only covers 1370.6 km2 or ∼0.28% of the total study area. The area is too small to obtain objective statistical results. Sichuan Province is one of the regions with the highest frequency of earthquakes and has suffered some of the deadliest earthquakes (such as the 2008 CE Wenchuan earthquake, the 2017 CE Jiuzhaigou earthquake, and the 2022 CE Luding earthquake). The 2008 Wenchuan earthquake (Ms 8.0), which occurred in Sichuan Province, China, generated more than 60,000 landslides and caused many casualties. Seismic and its additional stress can result in the group occurrence of landslides (), especially on slopes composed of sandstones and mudstones. The above results show that the occurrence of landslides does not increase with increasing PGA values, as expected. This indicates that the impact of PGA on landslide occurrence is perhaps controlled by other conditioning factors, such as elevation, lithology, and rainfall.
Figure 9. Examples of historical seismic landslides in the study area.
4.4. Correlation with rainfall
shows the landslide distribution in different rainfall classes. Landslide frequency is not a simple function of rainfall; for example, the 24-h rainfall class of >160 mm is not characterized by the highest landslide frequency. The area of the rainfall class of 30–40 mm is ∼145,979.5 km2, accounting for 30.05% of the entire area. However, only ∼5.98% of the landslides occurred in this area. Landslides are preferentially distributed in the rainfall class of 90–140 mm, occupying 71.75% of the total landslide number. The number of landslides begins to increase with the increase in rainfall and gradually decreases after the rainfall exceeds 110 mm. This indicates that 110 mm of rainfall may be critical for the development of landslides in the region. Areas with rainfall of more than 110 mm have good physical and mechanical properties of slope components and high vegetation coverage, resulting in fewer landslides. Some studies have elucidated the general relationship between landslides and rainfall, and various mechanisms of rainfall-induced landslides have been proposed (Alvioli et al. Citation2014). Long-term rains will enhance surface seepage and lower the suction of the soil on the slope, which may lead to a considerable reduction in the strength of the slope and structural surfaces, thereby causing landslides (). Nevertheless, copious rainwater will create favourable conditions for vegetation development, reducing the likelihood of landslides. It should be noted that short-term heavy rainfall generates transient surface currents and hinders surface seepage. Therefore, there is a threshold for the incidence of rainfall-induced landslides, which is uncertain. The LCI values generally fluctuate throughout the entire area. When the rainfall class is 130–140 mm, the LCI value reaches the maximum (3.72), followed by >160 (3.53), 140–150 (3.15), 120–130 (2.69), 150–160 (2.46), 110–120 (2.34), 100–110 (2.23), and 90–100 mm (1.82). Other rainfall ranges result in LCI values <1 and thus a lower probability of landslides occurring.
Figure 10. Photos of the rainfall-triggered landslides in the study area.
4.5. Correlation with anthropogenic factors
Landslides can be easily induced by unreasonable excavations on the toes of slopes. The engineering construction associated with road networks has greatly changed local landforms and the hydrogeological conditions of slopes, which have weakened slope stability. The relationship between landslide distribution and road density is shown in . A large number of landslides are observed in the road density of ≤0.6 km/km2, accounting for 77.81% of the total. The classes 0.6–0.8 and >0.8 km/km2 generated 10.39 and 11.80% of the landslides, which covered 5.48 and 4.80% of the area, respectively. The landslide frequency abruptly decreases at higher road densities. This finding can be attributed to the small area of these higher road densities. The classes 0.6–0.8 and >0.8 km/km2 exhibit the lowest landslide frequencies, but higher LCI values (1.90 and 2.46, respectively) can be observed. Overall, the LCI values increase with increasing road density and increase rapidly for road density >0.2 km/km2. The minimum LCI value (0.32) occurs in the class <0.2 km/km2, although this class covers the largest area.
5. Discussion
Identifying the factors controlling landslide occurrence is difficult because the relationship between landslides and the influencing factors varies spatially and temporally. However, a full understanding of these factors is crucial for elucidating potential risks in landslide regions. Therefore, GDM is used to detect the relative importance of control factors. shows the q statistic of the possible influencing factors, which is based on the GDM. For the role of a single influencing factor, the q statistics for each factor range from 0.000 to 0.347. The q statistical values range from 0. 000 to 0.022 for five factors, including plan curvature, slope aspect, profile curvature, SPI, and surface roughness. This value range implied that these factors alone are related to the spatial distribution of landslides, but their effects are limited. Except for the above five factors, the q statistics of other single factors are >0.026. In Sichuan Province, lithology is identified as the dominant single factor (0.347), followed by rainfall (0.345), road density (0.204), elevation (0.198), and PGA (0.188).
Table 3. The q statistic of possible influencing factors.
The occurrence of landslides is controlled by the interaction of internal factors and external factors. Different combinations of these geoenvironmental factors lead to differences in the spatial distribution of landslides. shows the factor interaction effects on the landslide distribution. The explanatory powers of the factor interactions are much higher than those of individual factors. The interactions between rainfall and PGA have the greatest impact on the spatial distribution of landslides (q = 0.502), which can explain ∼50.2% of the spatial variation in landslide density. This indicates that in specific rainfall ranges (such as 100–110 and 110–120 mm), PGA is more closely related to landslide occurrence. For example, the 1933 Ms 7.5 Diexi earthquake caused tensile cracks in the mountain where the Xinmo landslide was located (Fan et al. Citation2017). Several major earthquakes (such as the 1976 Ms 7.2 Pingwu earthquake and the 2008 Ms 8.0 Wenchuan earthquake) since then, and the long-term effects of gravity and rainfall, finally led to the occurrence of catastrophic landslides (). The interaction between rainfall and river density and road density was also significant, and the q statistic value was more than 0.47. Although the q values of an individual factor are small, the interaction between the above two factors and rainfall accounts for ∼47% of the spatial variation of the landslides. The interaction between lithology and rainfall, river density, PGA, road density, and elevation ranges from 0.417 to 0.499, which suggests that these interactions also play an important role in the spatial distribution of landslides in Sichuan Province. In addition, the interaction between river density and PGA can also explain over 40.7% of the variations in landslide densities, which is higher than all individual factors.
Figure 11. Overview of the 24 June 2017 Xinmo landslide.
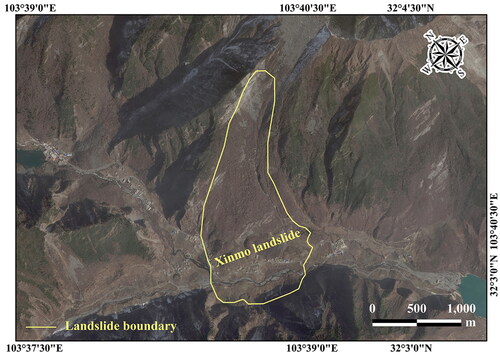
Table 4. The interaction relationships between pairs of possible influencing factors.
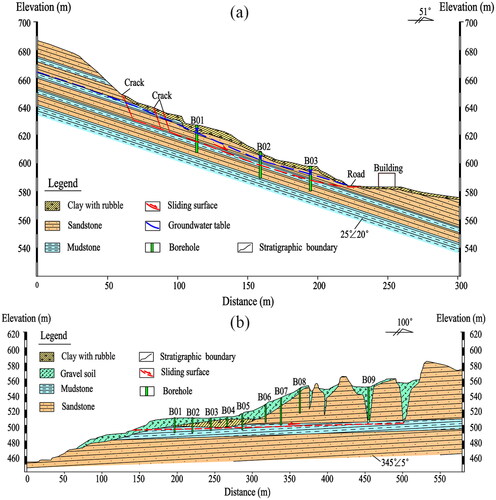
Many landslides in Sichuan Province occurred in the Jurassic and Cretaceous strata that are composed of a hard rock lithology (sandstone) intercalated with a high percentage of soft and weak layers (e.g. mudstone). Mudstone belongs to the impermeable layer, and it is generally difficult for groundwater to enter. However, under the influence of tectonic stress or gravity, shear stress concentration is likely to occur at the contact surface of mudstone and sandstone, which leads to the destruction of the mudstone structure and the increase in pores at the contact surface. As a result, groundwater enters it and forms a muddy interlayer. The interlayer tends to swell and weaken under saturated conditions due to the high content of clay minerals, including montmorillonite, illite, and kaolinite, which show expansion, disintegration, and softening under periodic dry and wet conditions. The muddy interlayer has low shear strength and is heavily fractured, as observed in the field, leading to higher concentrated landslide activity on slopes consisting of these weak and fragmented rocks ().
Figure 12. Longitudinal profiles of slope characteristics for the (a) Zhaoerping and (b) Kualiangzi landslides.
The continuous uplift of the Qinghai-Tibet Plateau led to crustal uplift and deep cutting of rivers in the study area. This process shaped the current alpine gorge geomorphology in the study area. During the process of downcutting by rivers, with the lateral constraint of the slope being removed, the slope is subjected to rebound deformation, and stress redistribution occurs at a certain depth of the slope (Huang Citation2008). As shown in , the stress redistribution of the slope has similar characteristics to the stress distribution of the surrounding rock of the tunnel, including the stress-reduction zone (σ < σ0), the stress-increase zone (σ > σ0), and the initial rock stress zone (σ = σ0) (Huang Citation2008). The stress redistribution of the slope is referred to as the ‘hump stress distribution’, and the stress-reduction and stress-increase zones (i.e. ‘hump zone’) correspond to the range of the unloading deformation of the slope. The stress-reduction zone is close to the bank slope of the river valley. Due to the stress release of the valley slope, the stress (σ) in this zone is less than the initial rock stress (σ0). The stress in the stress-increase zone is higher than the initial rock stress due to the adjustment of the stress field. The initial rock stress region remains in its original state due to being unaffected by river downcutting. The stress at the valley bottom is mainly characterized by shear relaxation unloading and high geostress zones.
Figure 13. Stress distribution of valley slopes (modified after Huang Citation2008).
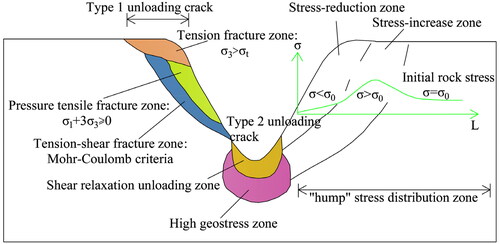
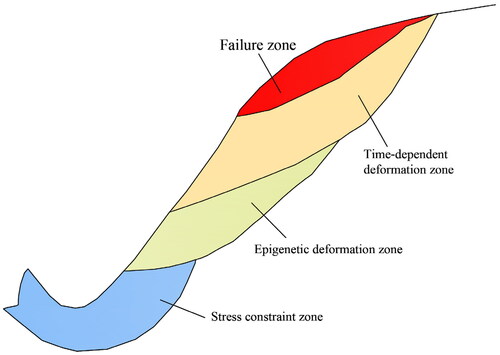
Compared with the stress-increase zone, the influence of the stress-reduction zone on the slope rock mass close to the river is more significant because both the strong unloading zone and the weak unloading zone often appear in this zone. The strong unloading zone () is commonly related to the tension fracture zone and pressure-induced tension fracture zone, while the weak unloading zone () is generally related to the shear fracture zone. In general, the damage evolution process of the slope close to the river can be divided into three stages: first epigenetic deformation, then time-dependent deformation, and finally failure (). Epigenetic deformation is the deformation and rupture of the slope rock mass driven by lateral unloading and stress release during the process of river incision. The structural planes formed by epigenetic deformation include two types: vertical fractures (i.e. Type 1 unloading cracks) and horizontal fractures (i.e. Type 2 unloading cracks). Epigenetic deformation can release the slope stress, form the unloading relaxation zone, and provide favourable boundary conditions for subsequent deformation of the slope. When the epigenetic deformation is completed, the slope stress field will be transformed into a state dominated by the self-weight stress field. At this time, the slope will form a new stable structure and be in equilibrium. Of course, if there are adverse geological conditions, the slope would also undergo creep deformation (i.e. ‘time-dependent deformation’) under the action of the self-weight stress field. The continuous development of the time-dependent deformation is also the gradual formation of the potential slide surface. When the slide surface develops to a certain stage, the slope will enter the final failure stage.
Figure 14. Unloading zone exposed by exploratory adits.
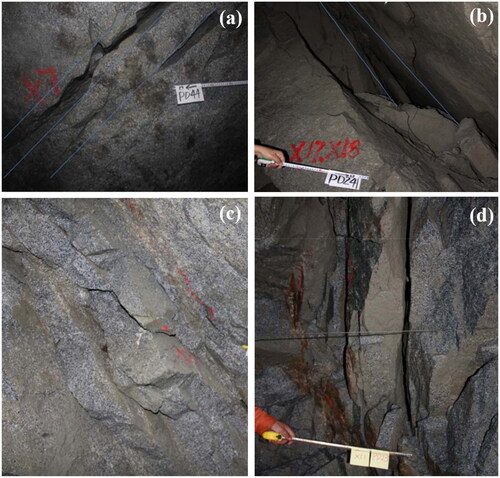
Figure 15. Sketch of three-stage mode of high slope evolution (modified after Huang Citation2008).
Since the implementation of the Western Development Policy, especially in the past two decades, the number of lifeline projects (such as railways, highways, and oil and gas pipelines) has increased rapidly, and a large number of factories and energy mining industries have been developed. With the acceleration of urbanization, more people are settling in cities, and people are urged to improve their living conditions. Therefore, to retain arable land and obtain more usable land in the surrounding mountains and deeply cut gullies, human beings have to alter the land through excavation, landfills, and irrigation, which further damages the environment of the study area. The improper selection of location and construction methods can easily lead to landslides (Chen et al. Citation2022). A large number of railways, highways, and other infrastructures in the study area are being planned or have been built, such as the Sichuan–Tibet Railway, Baoji-Chengdu Railway, Chengdu-Kunming Railway, Sichuan-Gansu Highway, and Sichuan-Shaanxi Highway. During the construction of these projects, many artificial slopes (i.e. cut slopes) were formed in this area. The improper excavation of the slope toe disturbs the equilibrium of natural slopes, changes the local landforms and the hydrogeological structure of slopes, and accelerates the formation of landslides (). Mining activities produce a large amount of waste slag, and a considerable concentration of overloading is acting on the slope. At the same time, the structure of these waste slags is relatively loose, and rainwater tends to infiltrate along the existing cracks to form a weak layer, which markedly destabilizes the slope and increases the frequency of landslides (). Overall, the area of mining-induced landslides is larger than that of road-related landslides, and their regional distribution is slightly consistent with the characteristics of deep-seated landslides, which is logical because mining activities are related to the lithologic characteristics of the landscape.
Figure 16. Photos of the road-related landslides in the study area.
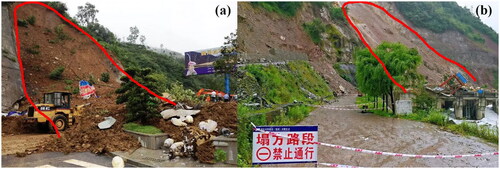
Figure 17. Photos of the mining-induced landslides in the study area.
6. Conclusions
Sichuan Province is a fragile area prone to landslides, which are controlled by complex geo-environmental factors. In this study, a total of 34,893 landslides collected from the Department of Natural Resources of Sichuan Province are used to analyze the relationships between influencing factors and the spatial distribution of landslides. Topographic factors, such as plan curvature (concave and convex areas), profile curvature (the classes < −0.001 and >0.001), slope angle (<24°), slope aspect (southeast, south, southwest, and west), relief amplitude (<222 m), cutting depth (<275 m), river density (>0.64 km/km2), surface roughness (<1.23), elevation (<2378 m), and SPI (<6) play important roles in landslide occurrences. In addition, other factors also sensitive to landslides in the study area include lithology (Classes 3 and 4), PGA (≤0.15 g), rainfall (90–140 mm), and road density (≤0.6 km/km2).
Geographical detector analysis reveals that the role of individual influencing factors is related to the spatial distribution of landslides, but their effects are limited. The factor interaction between rainfall and PGA, lithology, river density, and road density has a greater impact on the spatial distribution of landslides in Sichuan Province. The completeness of the landslide inventory influences the reliability of the spatial distribution analysis of landslides. Landslide mapping is vulnerable to uncertainties and inaccuracies that are dependent on surveyors’ knowledge backgrounds and skills. The uncertainty produced during the landslide mapping process propagates to the study area’s landslide distribution analysis. As a result, the analysis results of this study could be enhanced if supported by a more comprehensive inventory in a further study. Overall, the results of the present study can assist future hazard zonation, prediction, and prevention of landslides in Sichuan Province.
Additional information
Funding
References
- Alvioli M, Guzzetti F, Rossi M. 2014. Scaling properties of rainfall induced landslides predicted by a physically based model. Geomorphology. 213:38–47. doi: 10.1016/j.geomorph.2013.12.039.
- Cao J, Zhang Z, Wang C, Liu J, Zhang L. 2019. Susceptibility assessment of landslides triggered by earthquakes in the Western Sichuan Plateau. Catena. 175:63–76. doi: 10.1016/j.catena.2018.12.013.
- Chang W, Xu Q, Dong X, Zhuang Y, Xing A, Wang Q, Kong X. 2022. Dynamic process analysis of the Xinmo landslide via seismic signal and numerical simulation. Landslides. 19(6):1463–1478. doi: 10.1007/s10346-022-01876-w.
- Chen B, Li Z, Zhang C, Ding M, Zhu W, Zhang S, Han B, Du J, Cao Y, Zhang C, et al. 2022. Wide area detection and distribution characteristics of landslides along Sichuan Expressways. Remote Sens. 14(14):3431. doi: 10.3390/rs14143431.
- Chen Z, Zhou H, Ye F, Liu B, Fu W. 2021. The characteristics, induced factors, and formation mechanism of the 2018 Baige landslide in Jinsha River, Southwest China. Catena. 203:105337. doi: 10.1016/j.catena.2021.105337.
- Cui Y, Deng J, Hu W, Xu C, Ge H, Wei J, Zheng J. 2021. 36Cl exposure dating of the Mahu Giant landslide (Sichuan Province, China). Eng Geol. 285:106039. doi: 10.1016/j.enggeo.2021.106039.
- Fan X, Xu Q, Scaringi G, Dai L, Li W, Dong X, Zhu X, Pei X, Dai K, Havenith HB. 2017. Failure mechanism and kinematics of the deadly June 24th 2017 Xinmo landslide, Maoxian, Sichuan, China. Landslides. 14(6):2129–2146. doi: 10.1007/s10346-017-0907-7.
- Franceschini R, Rosi A, Catani F, Casagli N. 2022. Exploring a landslide inventory created by automated web data mining: the case of Italy. Landslides. 19(4):841–853. doi: 10.1007/s10346-021-01799-y.
- He K, Liu B, Hu X. 2021. Preliminary reports of a catastrophic landslide occurred on August 21, 2020, in Hanyuan County, Sichuan Province, China. Landslides. 18(1):503–507. doi: 10.1007/s10346-020-01566-5.
- Hou R, Chen N, Hu G, Han Z, Liu E. 2022. Characteristics, mechanisms, and post-disaster lessons of the delayed semi-diagenetic landslide in Hanyuan, Sichuan, China. Landslides. 19(2):437–449. doi: 10.1007/s10346-021-01751-0.
- Huang F, Tao S, Chang Z, Huang J, Fan X, Jiang SH, Li W. 2021. Efficient and automatic extraction of slope units based on multi-scale segmentation method for landslide assessments. Landslides. 18(11):3715–3731. doi: 10.1007/s10346-021-01756-9.
- Huang RQ. 2008. Geodynamical process and stability control of high rock slope development (In Chinese), China. Chinese J Rock Mech Eng. 27(8):1525–1544.
- Huang R. 2009. Some catastrophic landslides since the twentieth century in the southwest of China. Landslides. 6(1):69–81.
- Ji J, Cui H, Zhang T, Song J, Gao Y. 2022. A GIS-based tool for probabilistic physical modelling and prediction of landslides: GIS-FORM landslide susceptibility analysis in seismic areas. Landslides. 19(9):2213–2231. doi: 10.1007/s10346-022-01885-9.
- Jiang W, Chen G, Meng X, Jin J, Zhao Y, Lin L, Li Y, Zhang Y. 2022. Probabilistic rainfall threshold of landslides in data-scarce mountainous areas: a case study of the Bailong River Basin, China. Catena. 213:106190. doi: 10.1016/j.catena.2022.106190.
- Ju H, Zhang Z, Zuo L, Wang J, Zhang S, Wang X, Zhao X. 2016. Driving forces and their interactions of built-up land expansion based on the geographical detector–a case study of Beijing, China. Int J Geogr Inf Sci. 30(11):2188–2207. doi: 10.1080/13658816.2016.1165228.
- Kim Y, Tanaka K, Ge C. 2018. Estimating the provincial environmental Kuznets curve in China: a geographically weighted regression approach. Stoch Environ Res Risk Assess. 32(7):2147–2163. doi: 10.1007/s00477-017-1503-z.
- Li C, Criss RE, Fu Z, Long J, Tan Q. 2021. Evolution characteristics and displacement forecasting model of landslides with stair-step sliding surface along the Xiangxi River, three Gorges Reservoir region, China. Eng Geol. 283:105961. doi: 10.1016/j.enggeo.2020.105961.
- Li W, Zhao B, Xu Q, Yang F, Fu H, Dai C, Wu X. 2020. Deformation characteristics and failure mechanism of a reactivated landslide in Leidashi, Sichuan, China, on August 6, 2019: an emergency investigation report. Landslides. 17(6):1405–1413. doi: 10.1007/s10346-020-01367-w.
- Liang P, Yang X. 2016. Landscape spatial patterns in the Maowusu (Mu Us) Sandy Land, northern China and their impact factors. Catena. 145:321–333. doi: 10.1016/j.catena.2016.06.023.
- Lin Q, Wang Y. 2018. Spatial and temporal analysis of a fatal landslide inventory in China from 1950 to 2016. Landslides. 15(12):2357–2372. doi: 10.1007/s10346-018-1037-6.
- Luo W, Jasiewicz J, Stepinski T, Wang J, Xu C, Cang X. 2016. Spatial association between dissection density and environmental factors over the entire conterminous United States. Geophys Res Lett. 43(2):692–700. doi: 10.1002/2015GL066941.
- Luo W, Liu CC. 2018. Innovative landslide susceptibility mapping supported by geomorphon and geographical detector methods. Landslides. 15(3):465–474. doi: 10.1007/s10346-017-0893-9.
- Peng J, Wang S, Wang Q, Zhuang J, Huang W, Zhu X, Leng Y, Ma P. 2019. Distribution and genetic types of loess landslides in China. J Asian Earth Sci. 170:329–350. doi: 10.1016/j.jseaes.2018.11.015.
- Peng T, Chen N, Hu G, Tian S, Ni H, Huang L, Yang X, Zhao A. 2022. Failure mechanism of Dege landslide in western China, March, 2021: the loess interlayer and multiple water resources. Landslides. 19(9):2189–2197. doi: 10.1007/s10346-022-01910-x.
- Pudasaini SP, Krautblatter M. 2021. The mechanics of landslide mobility with erosion. Nat Commun. 12(1):1–15. doi: 10.1038/s41467-021-26959-5.
- Qi S, Xu Q, Lan H, Zhang B, Liu J. 2010. Spatial distribution analysis of landslides triggered by 2008.5. 12 Wenchuan earthquake, China. Eng Geol. 116(1–2):95–108. doi: 10.1016/j.enggeo.2010.07.011.
- Qi T, Meng X, Qing F, Zhao Y, Shi W, Chen G, Zhang Y, Li Y, Yue D, Su X, et al. 2021. Distribution and characteristics of large landslides in a fault zone: a case study of the NE Qinghai-Tibet Plateau. Geomorphology. 379:107592. doi: 10.1016/j.geomorph.2021.107592.
- Qi T, Zhao Y, Meng X, Shi W, Qing F, Chen G, Zhang Y, Yue D, Guo F. 2021. Distribution modeling and factor correlation analysis of landslides in the large fault zone of the Western Qinling Mountains: a machine learning algorithm. Rem Sens. 13(24):4990. doi: 10.3390/rs13244990.
- Shao X, Ma S, Xu C. 2023. Distribution and characteristics of shallow landslides triggered by the 2018 Mw 7.5 Palu earthquake, Indonesia. Landslides. 20(1):157–175. doi: 10.1007/s10346-022-01972-x.
- Sun C, Ling S, Wu X, Li X, Chen J, Jiang W. 2021. Oxidation of black shale and its deterioration mechanism in the slip zone of the Xujiaping landslide in Sichuan Province, Southwestern China. Catena. 200:105139. doi: 10.1016/j.catena.2020.105139.
- Tang Y, Lin H, Wang Y, Zhao Y. 2021. Rock slope stability analysis considering the effect of locked section. Bull Eng Geol Environ. 80(9):7241–7251. doi: 10.1007/s10064-021-02366-4.
- Tanyaş H, Hill K, Mahoney L, Fadel I, Lombardo L. 2022. The world’s second-largest, recorded landslide event: lessons learnt from the landslides triggered during and after the 2018 Mw 7.5 Papua New Guinea earthquake. Eng Geol. 297:106504. doi: 10.1016/j.enggeo.2021.106504.
- Troncone A, Pugliese L, Conte E. 2022. Analysis of an excavation-induced landslide in stiff clay using the material point method. Eng Geol. 296:106479. doi: 10.1016/j.enggeo.2021.106479.
- Wang D, Wang Z, Li Y, Fan T, Ouyang C, Ji F. 2020. Characteristics and dynamic process analysis of the 2018 Mabian consequent landslide in Sichuan Province, China. Bull Eng Geol Environ. 79(7):3337–3359. doi: 10.1007/s10064-020-01784-0.
- Wang JF, Li XH, Christakos G, Liao YL, Zhang T, Gu X, Zheng XY. 2010. Geographical detectors‐based health risk assessment and its application in the neural tube defects study of the Heshun Region, China. Int J Geogr Inf Sci. 24(1):107–127. doi: 10.1080/13658810802443457.
- Wang J, Schweizer D, Liu Q, Su A, Hu X, Blum P. 2021. Three-dimensional landslide evolution model at the Yangtze River. Eng Geol. 292:106275. doi: 10.1016/j.enggeo.2021.106275.
- Wang X, Clague JJ, Crosta GB, Sun J, Stead D, Qi S, Zhang L. 2021. Relationship between the spatial distribution of landslides and rock mass strength, and implications for the driving mechanism of landslides in tectonically active mountain ranges. Eng Geol. 292:106281. doi: 10.1016/j.enggeo.2021.106281.
- Wu K, Chen N, Hu G, Han Z, Ni H, Rahman M. 2021. Failure mechanism of the Yaoba loess landslide on March 5, 2020: the early-spring dry spell in Southwest China. Landslides. 18(9):3183–3195. doi: 10.1007/s10346-021-01703-8.
- Xia Z, Motagh M, Li T, Roessner S. 2022. The June 2020 Aniangzhai landslide in Sichuan Province, Southwest China: slope instability analysis from radar and optical satellite remote sensing data. Landslides. 19(2):313–329. doi: 10.1007/s10346-021-01777-4.
- Xu Y, Allen MB, Zhang W, Li W, He H. 2020. Landslide characteristics in the Loess Plateau, northern China. Geomorphology. 359:107150. doi: 10.1016/j.geomorph.2020.107150.
- Yang J, Song C, Yang Y, Xu C, Guo F, Xie L. 2019. New method for landslide susceptibility mapping supported by spatial logistic regression and GeoDetector: a case study of Duwen Highway Basin, Sichuan Province, China. Geomorphology. 324:62–71. doi: 10.1016/j.geomorph.2018.09.019.
- Yang M, Liu G, Chen T, Chen Y, Xia C. 2020. Evaluation of GPM IMERG precipitation products with the point rain gauge records over Sichuan, China. Atmos Res. 246:105101. doi: 10.1016/j.atmosres.2020.105101.
- Yao J, Lan H, Li L, Cao Y, Wu Y, Zhang Y, Zhou C. 2022. Characteristics of a rapid landsliding area along Jinsha River revealed by multi-temporal remote sensing and its risks to Sichuan–Tibet railway. Landslides. 19(3):703–718. doi: 10.1007/s10346-021-01790-7.
- Yi X, Feng W, Bai H, Shen H, Li H. 2021. Catastrophic landslide triggered by persistent rainfall in Sichuan, China: August 21, 2020, Zhonghaicun landslide. Landslides. 18(8):2907–2921. doi: 10.1007/s10346-021-01701-w.
- Zhan J, Chen J, Zhang W, Han X, Sun X, Bao Y. 2018. Mass movements along a rapidly uplifting river valley: an example from the upper Jinsha River, southeast margin of the Tibetan Plateau. Environ Earth Sci. 77(18):1–18. doi: 10.1007/s12665-018-7825-4.
- Zhao B, Liao H, Su L. 2021. Landslides triggered by the 2018 Lombok earthquake sequence, Indonesia. Catena. 207:105676. doi: 10.1016/j.catena.2021.105676.
- Zhou C, Huang W, Ai D, Xu H, Yuan J, Kou L, Luo X. 2022. Catastrophic landslide triggered by extreme rainfall in Chongqing, China: July 13, 2020, Niuerwan landslide. Landslides. 19(10):2397–2407. doi: 10.1007/s10346-022-01911-w.
- Zhu L, Liang H, He S, Liu W, Zhang Q, Li G. 2020. Failure mechanism and dynamic processes of rock avalanche occurrence in Chengkun railway, China, on August 14, 2019. Landslides. 17(4):943–957. doi: 10.1007/s10346-019-01343-z.
- Zhuang J, Peng J, Wang G, Javed I, Wang Y, Li W. 2018. Distribution and characteristics of landslide in Loess Plateau: a case study in Shaanxi province. Eng Geol. 236:89–96. doi: 10.1016/j.enggeo.2017.03.001.