
 ?Mathematical formulae have been encoded as MathML and are displayed in this HTML version using MathJax in order to improve their display. Uncheck the box to turn MathJax off. This feature requires Javascript. Click on a formula to zoom.
Abstract
Ethiopia’s forest fires are causing biodiversity loss and ecosystem destruction, highlighting the need for preventative measures. However, there is limited knowledge regarding the future impact of climate on forest fires in Ethiopia. Hence, this study primarily examines the past and future climate patterns and their potential impact on occurrence of wildfires. Climate data from the baseline (1980–2020) were projected for the future period (2021–2099) under RCP4.5 and RCP8.5 scenarios using R-software. The trends in climate were analysed using Anclim and Weather-Datatool software. To estimate the occurrence of fire, Keetch-Byram-Drought-Index was calculated using climate data and antecedent soil moisture. The result of the study indicates a projected increase in temperature, with variation in precipitation. A moderate fire risk is projected in 2021–2039 that increases to moderate-to-high probability in 2040–2069 and 2070–2099. In the future, the annual severity of fires will be 27.2–27.8% moderate and 3.3–7.8% high. The highest risk of fire will be experienced in the dry season, more in the 2070–2099 under RCP8.5 scenario. Based on the analysis this study concludes that climate change is expected to have an impact on the occurrence of wildfires. The study emphasizes the importance of taking proactive measures for effective fire management.
1. Introduction
Forest fire is a major disturbance factor that is on the increase across the globe (Mouillot and Field Citation2005; McDowell et al. Citation2020). It has a strong influence on natural ecosystem dynamics (Pausas et al. Citation2008; Viljur et al. Citation2022). It increases carbon emission, significantly causes climate change (Holsten et al. Citation2013; Healey et al. Citation2014; Clarke et al. Citation2022). It is estimated that 20% carbon dioxide (CO2) estimated emission was contributed from forest fires (Faramarzi et al. Citation2021). The global average surface temperature revealed a warming of 0.85–1.3 °C during the period 1880–2019 (Masson-Delmotte et al. Citation2021). Rising temperatures increase frequency and intensity of extreme weather events such as floods, fire, and droughts (FAO Citation2016; Haile et al. Citation2019). Prolonged dry seasons would enhance aridity, sensitive to wildfires (Hansen et al. Citation2003).
Forests are an important natural capital in Ethiopia (Demissie et al. Citation2019). The important resource is threatened by human activities and fires. In 1984, wildfires affected more than 300,000 ha, mostly high forests (Lemessa and Perault Citation2001). In addition, in 2000, over 150,000 ha of forest were damaged (FFE Citation2009, Bekele and Mengesha Citation2001). MoA (Citation2000) described the emergence of wildfires in Ethiopia that occurred. Considering that Ethiopia has approximately 1,343,800 ha of natural forest area, the 15,000 ha burned in 2000 represents over 11% of the total forest economic potential. Ethiopia’s forests contribute about 2.5% of its GDP (George and Mutch Citation2001). The number of wildfire occurrences in Ethiopia increased by 60% between 2001 and 2017 (Harris et al. Citation2023). Forest fires have a long history in Ethiopia (Gil-Romera et al. Citation2019). However, the country was unprepared for the fires posing a serious threat to natural resources due to inadequate fire awareness and lack of necessary firefighting equipment (Lemessa and Perault Citation2001). This calls for an understanding of how forest fires are likely to evolve in the country under climate change to support preparedness efforts.
IPCC (2021) projects an increase in global temperatures that will be characterized by more intense and frequent extreme temperature events such as heatwaves. Studies (e.g. Jolly et al. Citation2015; Seidl and Turner Citation2022) have reported the possible influence of the warming on natural disturbance regimes as well as changing the post-disturbance forest development paths. According to Jolly et al. (Citation2015), the warming influences aridity that consequently drive changing forest fire patterns. This is likely to pose a threat to forests as well as reducing ecosystem carbon storage in countries like Ethiopia that are less prepared to handle fire and related disasters.
Accordingly, fire modelling is important for Ethiopia to increase fire preparedness as observed by Harris et al. (Citation2023). The use of fire modelling is an effective tool for predicting wildfire risks and guiding decision-making (FAO Citation2020). To predict forest fires, several probabilistic models and methodologies have been developed and applied (Miller et al. Citation2017; Sakr et al. Citation2010). While some models are used after climate-based forest fires have occurred, others only utilize meteorological data. For instance, Maxent is a model employed when wildfire occurrence points are available. When applied to wildfire modelling, MaxEnt uses presence data and pseudo absence data (Massada et al. Citation2013, Tariq et al. Citation2022). Another method is satellite image fire detection, which utilizes satellite imagery to detect and monitor wildfires (Tariq et al. Citation2021,Citation2023). The impact of climatic conditions on fire occurrence is stronger than other factors such as elevation (Kandya et al. Citation1998; Piñol et al. Citation1998). Since there was no past climate-based occurrence of fire in the forest under study, meteorological-based software is utilized in this study to predict the baseline and future occurrence of forest fires.
Keetch-Byram Drought Index (KBDI) is an example of meteorological forest fire index used to determine fire danger. The index uses net effect of evapotranspiration and precipitation to determine forest fire potential, hence, its importance is likely to increase further as climate change persists (Tariq et al. Citation2021). In this study, KBDI is utilized with data from 20 general circulation models (GCMs) under two representative concentration pathways (RCPs) emission scenarios (Riahi et al. Citation2007; van Vuuren et al. Citation2011). The RCP scenarios play a crucial role in specifying greenhouse gas (GHG) concentrations and corresponding emissions. They were adopted by the IPCC's Fifth Assessment Report (AR5) and include short-lived gasses and land use changes. This study utilized two RCP scenarios, namely RCP 4.5 and RCP 8.5, which represent medium and high emission scenarios, respectively.
This study builds on recommendations of previous research (Lemessa and Perault Citation2001; Szerszynski and Urry Citation2010; Mubiru et al. Citation2012; Belayneh et al. Citation2013) on understanding the impact of climate variability on forest fires. The objective of the study is to address gaps in identifying climate patterns, assessing fire severity through analysis of climate data and antecedent soil moisture, and evaluating the impact of seasonal variations on fire severity. The findings have practical implications for planners and forest managers in decision-making for successful fire suppression in the context of climate change.
2. Material and methods
2.1. Study area
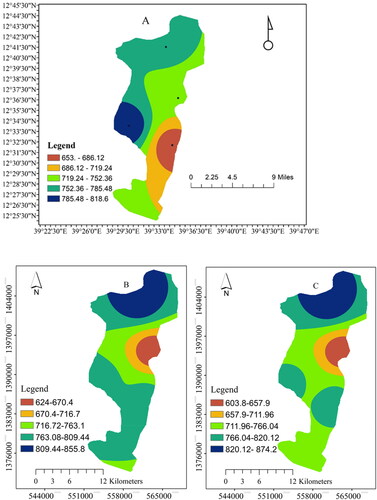
The study area is located in the southern zone of Tigray, about 160 km south of Mekelle, the capital of Tigray region, North-eastern Ethiopia. It lies between latitude 12° 25′−12° 45'N and longitude 39° 23′−39° 45′ E. Its altitude ranges from 1501 to 3683 m above sea level. The area is classified under dry evergreen Afromontane which is characterized by dry climate (annual mean precipitation less than 1000 mm). The area only consists of one type of forest, which is the dry evergreen Afromontane forest. Mean annual precipitation of the forest ranges from 653 to 818.6 mm. Mean maximum temperature in the region is in the range of 21.4–30 °C while the mean minimum temperature is 9.4–14.8 °C. The month of October is the coldest in the year while June records the highest temperature.
The forest is located in four districts: Endamohoni, Raya Azebo, Raya Alamata, and Ofla. These districts have four weather stations: Maichew, Mohoni, Alamata, and Korem town, respectively (). The area’s topography is distinguished by rough and hilly landscape spanning 369 km2. The dominant soils are Vertisol, leptosoil, and cambosols. The Hugumburda Grat-Kahsu forest is a mixed forest consisting of both natural and plantation forest. There are six different land use and land cover types within the forest (). They include forest, shrub, water body, settlement, and grasslands.
Figure 1. Map of study area.
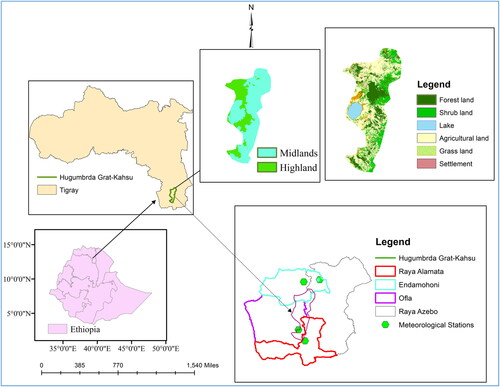
There are approximately 26,889 households within and around the forest boundary, with 5496 households located fully within the forest area (Central Statistical Agency, CSA Citation2007; Kidane et al. Citation2010). The households living in the vicinity of the forest rely on the forest for fuel wood, timber, and farming equipment (Kidu et al. Citation2017). Agriculture is an important part of the local economy in the districts surrounding the Hugumburda Grat-Kahsu National Forest Priority Area. Mixed farming is common in the area with crops such as teff, wheat, sorghum, barley, and maize are commonly grown in the region. The common animals reared in the study area are cows, goats, sheep, donkey, horse, mule, and camels (Abay Citation2018; Sertse et al. Citation2021).
2.2. Data
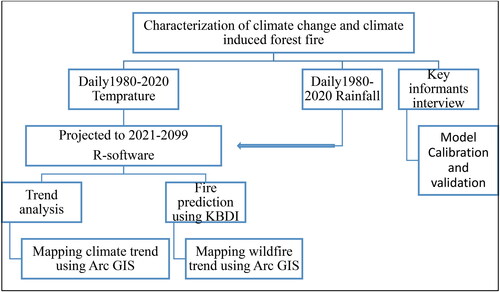
The materials used in this study included various numerical datasets, such as climate data, Arc and Diva GIS, KBDIS, Weather Datatool, and Anclim. The study utilized observed data from meteorological stations and satellite data for precipitation, minimum, and maximum temperature. These data were projected into the period 2009–2099 using average GCM datasets. Key interview information was also used to calibrate and validate the KBDIS models, as depicted in .
Figure 2. Conceptual framework.
The baseline period (1980–2020) climate data of daily minimum and maximum temperature and rainfall data of the study area were sourced from four meteorological stations, namely: Maichew, Mohoni, Korem, and Alamata. The stations are located around the forest. The dataset served as the main input data for this study. Satellite data was used to fill the missing climate data of the meteorological data. Temperature data from Enhancing Climate Information Services (ENACTS; Dinku et al. Citation2018), Tropical Application of Meteorology using Satellite (TAMSAT) data and rainfall from Climate Hazards Group InfraRed Precipitation (CHIRPS; Funk et al. Citation2015) were used to fill the missing values of national meteorological stations. To fill in the missing values of national meteorological stations, appropriate statistical methods were utilized based on the type of data available. The methods used included regression analysis, as well as the normal precipitation and arithmetic mean methods. The 30-year average value for each day, month, and year was also taken into consideration during the process of filling in the missing data.
The baseline filled and meteorological climate data for the period between 1980 and 2009 were projected using the R programming language software. The importance of the R-programming language lies in its ability to assist numerous researchers in evaluating the possible effects of climate change. This is crucial as it provides valuable insights that inform policy decisions. The projected observed climate data for the years between 2010 and 2099 were generated using an ensemble of 20 GCMs with a mean value and detailed in . Bias correction was not carried out since the analysis was based on observed meteorological station data. The data were found to be consistent with the observed average values. However, the projected climate data for the years 2010–2020 were replaced by observed meteorological data to ensure greater accuracy. The climate time series was then classified into four different datasets: baseline (1980–2020), near future (2021–2039), mid-future (2040–2069), and end-term future (2070–2099). These datasets were subsequently used as input data for fire prediction. Medium (RCP 4.5) and high (RCP 8.5) emission scenarios were selected for this study. Those RCPs were projected from the average of the GCMs.
Table 1. List of global circulation models (GCMs) used for input.
The decision to choose an ensemble GCM was based on the insufficiency of a single GCM in accurately simulating local and regional weather and climate for assessing potential climate change trends and impacts, as highlighted by Haftu and Haftom (Citation2022). Moreover, to enhance the reliability of projections, it has been established that the multi-model average is more effective than individual GCM simulations (Knutti et al. Citation2008; Camici et al. Citation2014). This is because multiple models in the average reduces errors in individual models and decreases ensemble uncertainty. Therefore, this study utilizes an ensemble of GCMs from different models to generate more precise projected climate data than a single GCM projection output, as presented in .
2.3. Methods
2.3.1. Climate analysis
To characterize the observed climate data for the period 1980–2020, and predicted for the period 2021–2099, daily time series data of temperature (maximum and minimum), and precipitation were computed. Seasonal means of climate trend and fire occurrence were determined from monthly data, defined as winter (December–February); spring (March–May); summer (July–August), and autumn (September–November). To analyse the trend of climate data, the projected climate data were compared with the baseline climate data for the period 1980–2009. The baseline climate data were used as a reference to assess the changes in the projected climate data over the future time periods, i.e. near (2021–2039), mid (2040–2069), and end term (2070–2099). The mapping of spatial-temporal variation of the climate trend was accomplished using the inverse distance weighting (IDW) technique.
To calculate the coefficients of the trend and assess their statistical significance, the study utilized two software programs: AnClim software, http://www.climahom.eu/AnClim.html (Štěpánek Citation2005) and Weather Data Tool from AgriMetSoft (https://agrimetsoft.com/). Several statistical methods were employed to analyse the climate trend, including the arithmetic Mean, Mann-Kendall, and Theil-Sen test. The Mann-Kendall statistic was selected due to its effectiveness in measuring trends in time-series data (Mann Citation1945; Kendall Citation1975), and its frequent usage in similar studies (e.g. Rahman et al. Citation2018). The methodology is extensively explained by Ongoma and Chen (Citation2017), who also applied it to investigate climate variability in East Africa.
2.3.2. Trend of forest fire outbreak under climate change
The primary factors contributing to the incidence and spread of forest fires are meteorological conditions. In this study, both observed and GCM simulated meteorological data were utilized to calculate present (1980–2020) and future (2021–2099) KBDI values. The maximum temperature and precipitation data for the baseline (1980–2020) and projected (2021–2099) periods were then analysed to determine the occurrence of forest fires in the past and future. The simulation of forest fire occurrence based on meteorological data was carried out using the KBDI software, which has become the most widely used index in wildfire monitoring globally, as highlighted by Ganatsas et al. (Citation2011). It is considered a reliable indicator of wildfire risk in terms of year, season, and day, as noted by Arpaci et al. (Citation2013) and Haftu and Kelali (Citation2019). KBDI, created by John Keetch and George Byram in the USA in 1968, is a numerical index and the most commonly used tool for predicting the likelihood and severity of wildfire risks (Keetch and Byram Citation1968). It is also one of the key elements utilized in drought and forest fire potential studies (Feidas et al. Citation2002). KBDI values range from 0 (no moisture deficit) to 800 (moisture deficit) (Keetch and Byram Citation1968), and the index itself does not have a specific SI unit since it is a dimensionless index calculated based on various meteorological and environmental parameters (Keetch and Byram Citation1968). Therefore, the KBDI was utilized in this study to estimate the occurrence of forest fires and classification of the severity was between 0 and 800.
The theory and framework of KBDI are based on the rate of soil moisture loss depending on density of the vegetation cover, antecedent moisture conditions, annual precipitation, and evapotranspiration. It is also based on the field capacity of soil. Soil field capacity was taken at a depth of 25 cm. Similarly, it is based on daily maximum temperature, daily precipitation, cumulative antecedent moisture deficiency, and annual average precipitation (Keetch and Byram Citation1968).
The computations are based on EquationEquations (1–3);
(1)
(1)
where dQ is a drought factor or soil water depletion (in mm) during a period of time dt, Q is the accumulated soil water depletion (in mm); T is daily maximum temperature; R is mean annual rainfall; 203.2 is the field capacity of soil expressed in mm (Keetch and Byram Citation1968). In the equation, potential evapotranspiration (ETP) is estimated on a daily basis as the ratio of an exponential function of the daily maximum temperature (T), divided by an exponential function of the mean annual rainfall (R);
(2)
(2)
Potential evapotranspiration is converted to actual evapotranspiration as a linear function of soil water depletion, i.e. ETP is reduced as soil dries as described by the following equation:
(3)
(3)
The study categorized the KBDI values to assess various degrees of fire hazard in estimating seasonal and long-term fires. illustrates the aforementioned categories.
Table 2. KBDI fire risk classes.
The study utilized the IDW technique in ArcGIS 10.3 to interpolate the KBDI results and climate data obtained from four meteorological stations to the entire forest area. This deterministic method of multivariate interpolation is widely used for its simplicity, and has been applied at various spatial and temporal scales (Ly et al. Citation2013). In fact, it is one of the most commonly employed interpolation techniques (Dripps and Bradbury Citation2007). It is a useful method for spatial interpolation and mapping of different variables related to climate and fire risk, and has been widely used in scientific research and practical applications. We utilized the IDW method to interpolate KBDI values across the study area using ArcGIS software. This method was chosen due to its ability to approximate values for unsampled areas based on the sampled areas, which is important for mapping KBDI values across the entire forest.
2.3.3. Model validation
Key informant discussions are a valuable tool for validating models, and most of the data required to answer research questions can be collected from primary sources. The study utilized a sample of key informants from various individuals in the forest, including 40 farmers above the age of 50 and four agricultural development agents and experts. The age group was selected to capture the real climate trend for more than 30 years. The interviews with the 40 farmers were conducted in the four districts under study. Insights and understanding about climate change-induced fires in the forest from 1980 to the present were gathered from key informants. These informants reported that climate change has resulted in rising temperatures, greater variability, and reduced rainfall intensity and amount. They also acknowledged the incidence of human-caused forest fires. The insights provided by the key informants were crucial for validating the models used in the study.
3. Results
3.1. Climate trend analysis
The four weather stations: Maichew, Mohoni, Korem, and Alamata, recorded mean maximum temperature of 21.4 °C, 28.8 °C, 23.7 °C, and 30 °C, respectively, during the baseline (1980–2020) period. In addition, mean minimum temperature of the four stations were 9.4 °C, 14.8 °C, 12.2 °C, and 13.2 °C. Mean annual precipitation of the stations were 763.6, 728.8, 818.6, and 653 mm. The mean annual precipitation of the forest is 653 − 818.6 mm and mean maximum temperature is 21.4 − 30 °C. In addition, mean minimum temperature ranges from 9.4 °C to 14.8 °C. In all met stations maximum and minimum temperature significantly increases (p < 0.05). Besides, precipitation was significantly decreasing (p < 0.05) in two meteorological stations while the two meteorological stations were significantly increased (p < 0.05). Hence, the trend of temperature was increment in the four meteorological stations while trend of precipitation showed both increment and reduction. Key informants also mentioned the same as the calculations, especially for the trend of temperature. All respondents cleared that temperature is increasing. In addition, the trend of precipitation is both reduction and increment. The respondents reported a reduction in the duration of the rainy season and a delay in the onset or start of the rainy season.
The forest is projected to record precipitation within the ranges of 634.28–846.2, 619.51–849.01, and 622.25 − 865.44 mm in the near (2021–2039), mid (2040–2069), and end-term (2070–2099) time series of RCP 4.5, respectively. The forest is expected to experience precipitation between 626.51–876.77, 586.94–863.54, and 606.31–880.53 mm in the near, mid, and end-term time series, respectively, under RCP 8.5. In terms of maximum temperature, the forest will record temperature in the range of 22.24–27.98 °C, 22.77–28.29 °C, and 23.29–28.49 °C in the near, mid, and end-term time series of RCP 4.5, respectively. For RCP 8.5, the forest will experience maximum temperatures ranging from 21.6 to 30.13, 22.76 to 34.35, 23.96 to 35.21, and 24.84 to 36.82 °C in the near, mid, and end-term time series. Minimum temperature will reach 11.12–14.74 °C, 11.54–14.79 °C, and 12.01–15.04 °C in the near, mid, and end-term time series of RCP 4.5, respectively. For RCP 8.5, the forest will have minimum temperatures ranging from 10.83 to 17.2 °C, 11.87 to 17.95 °C, and 12.82 to 19.5 °C in the near, mid, and end-term time series ().
Figure 3. Mean precipitation, maximum and minimum temperature for the periods baseline (1980–2020), near (2021–2039), mid (2040–2069), and end (2070–2099) under RCP 4.5 and 8.5.
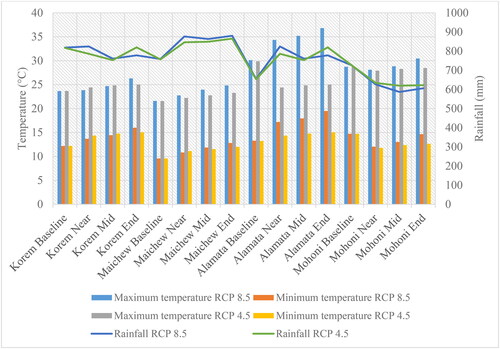
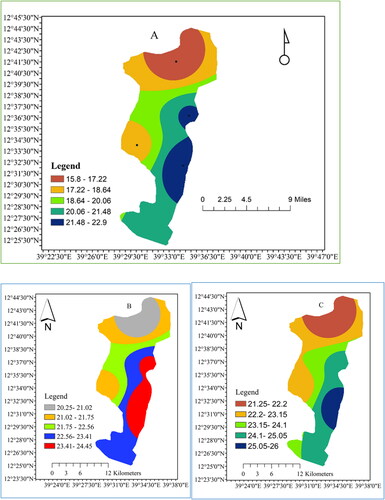
In 2021–2099, mean maximum temperature of four stations is projected to be 26.8 °C, 27.3 °C, 31 °C, and 32.6 °C, respectively, under RCP 4.5. In addition, mean minimum temperature of the stations is projected to reach 14.2 °C, 16 °C, 15.5°C and 16.3 °C. The average temperature within the study area shows variability among different periods, potentially ranging from 15.8 to 22.9°C during the baseline period, from 20.25 to 24.45°C from the years 2021 to 2099 under the RCP 4.5 scenario, and from 21.25 to 26°C for the years 2021–2099 under the RCP 8.5 scenario ()." Mean annual precipitation of the stations might also reach 855.8, 624, 778, and 786.4 mm (). Hence, under RCP 4.5 scenario, mean annual precipitation of the forest will be 624–855.8 mm and mean maximum temperature will range from 26.8 °C to 32.6 °C. In addition, mean minimum temperature ranges from 14 °C to 16.3 °C.
Figure 4. Mean average temperature map (A) baseline, (B) 2021–2099 under RCP 4.5, and (C) 2021–2099 under RCP 8.5.
Under RCP 8.5 from 2021 to 2099 mean maximum temperature of the stations is projected to range from 27.5 °C to 34.6 °C. On the other hand, mean minimum temperature of the four stations range between 15 °C and 17.4 °C. Mean annual precipitation of the stations might also 874.2, 603.8, 774, and 782.7 mm (). Hence, in RCP 8.5 projection, mean annual precipitation of the forest might be 603.8 − 874.2 mm and mean maximum temperature is projected to reach 27.5–34.6 °C. The region is likely to record a mean minimum temperature ranging from15 °C to 17.4 °C. The temperatures might be increasing up to 2099 in both RCPs. The highest minimum and maximum temperature might be under RCP 8.5. On the other hand, precipitation shows both reduction and increment in both RCPs when compared with the baselines.
Figure 5. Mean precipitation map (A) baseline (B) 2021–2099 RCP 4.5 (C) 2021–2099 RCP 8.5.
Between 1980 and 2099, the mean values for maximum temperature, minimum temperature, and precipitation in Korem under RCP 4.5 are 24.43, 13.9, and 796.9, respectively. Regression models were created for each variable using time (x), with the following equations: y = 783.8642 + 0.2157x for maximum temperature, y = 23.3606 + 0.0176x for minimum temperature, and y = 11.8560 + 0.0338*x for precipitation. The regression model for maximum temperature is not statistically significant, while the models for minimum temperature and precipitation are both significant. The trends per decade for maximum temperature, minimum temperature, and precipitation in Korem under RCP 4.5 between 1980 and 2099 are +2.157, +0.176, and 0.338, respectively. Under RCP 8.5, the mean values for maximum temperature, minimum temperature, and precipitation in Korem are 24.62, 13.94, and 794.8, respectively. The regression models for each variable using time (x) are as follows: y = 22.7925 + 0.0302x for maximum temperature, y = 11.3632 + 0.0426x for minimum temperature, and y = 805.9538 − 0.1836*x for precipitation. The models for maximum and minimum temperature are significant, while the model for precipitation is not significant. The trends per decade for maximum temperature, minimum temperature, and precipitation in Korem under RCP 8.5 are 0.302, 0.426, and −1.836, respectively.
The data for Maichew under RCP 4.5 indicate that the mean values for precipitation, maximum temperature, and minimum temperature between 1980 and 2099 are 821.33, 22.41, and 10.92, respectively. The regression models for each variable with time (x) are significant, with the following equations: y = 21.0388 + 0.0227x for maximum temperature, y = 9.0526 + 0.0309x for minimum temperature, and y = 757.2777 + 1.0587*x for precipitation. The trends per decade for maximum temperature, minimum temperature, and precipitation between 1980 and 2099 are +0.227, +0.309, and +10.9 mm, respectively. Under RCP 8.5, the mean values for maximum temperature, minimum temperature, and precipitation in Maichew are 23.2, 11.6, and 834.14, respectively. The regression models for each variable with time (x) are significant, with the following equations: y = 20.7491 + 0.0402x for maximum temperature, y = 8.7433 + 0.0399x for minimum temperature, and y = 761.0998 + 1.2073*x for precipitation. The trends per decade for maximum temperature, minimum temperature, and precipitation are 0.399, 0.4, and 12.7 mm, respectively.
Between 1980 and 2099, Mokoni’s arithmetic mean for precipitation, maximum temperature, and minimum temperature is 659, 28.43, and 13.16, respectively, under RCP 4.5. In RCP 8.5, the mean values are 645.6, 29.11, and 13.87, respectively. Regression models were created for each variable in RCP 4.5, where precipitation is modelled as y = 727.7280 − 1.1367x, maximum temperature is modelled as y = 28.3177 + 0.0020x, and minimum temperature is modelled as y = 14.4277 − 0.0210x. The models for precipitation and minimum temperature are significant, while the model for maximum temperature is not significant. In RCP 8.5, the regression models for each variable are y = 724.5508 − 1.3050x for precipitation, y = 27.7651 + 0.0222x for maximum temperature, and y = 13.8876 + 0.0003x for minimum temperature. The model for maximum temperature is significant, while the models for precipitation and minimum temperature are not significant. The trend per 10 years for Mokoni in RCP 4.5 is −11.367 for precipitation, 0.020 for maximum temperature, and 0.210 for minimum temperature. In RCP 8.5, the trend per 10 years is −13.050 for precipitation, 0.222 for maximum temperature, and 0.03 for minimum temperature.
For Alamata, the arithmetic mean for precipitation, maximum temperature, and minimum temperature is 741.02, 26.5, and 14.25, respectively, under RCP 4.5. In RCP 8.5, the mean values are 738.9, 33.74, and 16.63, respectively. The trend per 10 years in RCP 4.5 is 18.72 for precipitation, 0.05 for maximum temperature, and 0.23 for minimum temperature. In RCP 8.5, the trend per 10 years is 14.72 for precipitation, 0.76 for maximum temperature, and 0.7 for minimum temperature. Regression models were created for each variable in RCP 4.5, where precipitation is modelled as y = 627.7833 + 1.8716x, maximum temperature is modelled as y = 29.7469 + 0.0529x, and minimum temperature is modelled as y = 12.8857 + 0.0225x. All of these models are significant (p < 0.05). In RCP 8.5, the regression models for each variable are y = 649.8697 + 1.4724x for precipitation, y = 29.1200 + 0.0763x for maximum temperature, and y = 29.1200 + 0.0763x for minimum temperature. All of these models are significant (p < 0.05).
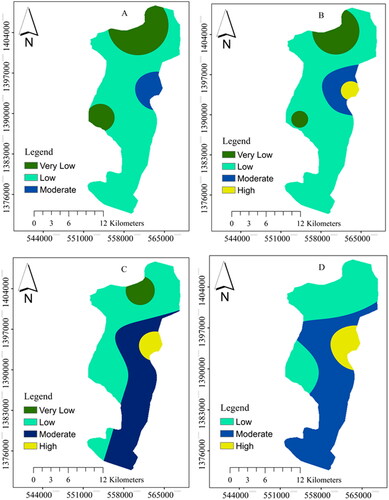
3.2. Spatial and temporal forest fire risk
The baseline occurrence (1980–2020) of forest fire simulated using KBDI software was 240. This indicates that in baseline, there was no climate induced forest fire in the study area, it is zero hectare. In a similar case baseline data shows that KBDI and fire burning indicate no fire occurrence. This was confirmed by the key informant interviews from the study area. The KBDI values (1980–2099) for Alamata_at RCP 4.5, Alamata_at RCP 8.5, Korem_at RCP 4.5, Korem_at RCP 8.5, Maichew at_RCP 4.5, Maichew at_RCP 8.5, Mohoni at_RCP 4.5, and Mohoni at_RCP 8.5 have an arithmetic mean of 158.78, 173.28, 88.29, 97.48, 76.5, 78.77, 118.89, and 128.6, respectively, with standard deviations of 51.21, 60.5, 30.64, 38.84, 24.83, 27.64, 109.07, and 112.2, respectively (see ). Upon annual calculation, the KBDI value for the study area from 1980 to 2099, projected under RCP 4.5 and 8.5, may range from 21 to 336 and 21 to 370, respectively.
Figure 6. KBDI trend from 1980 to 2099.
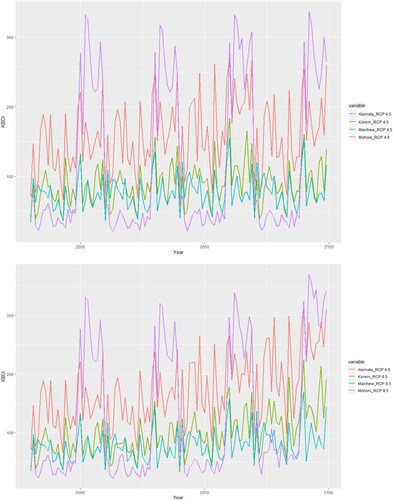
The trend of KBDI per ten years for each station is as follows: 3.93 for Alamata_at RCP 4.5, 9.88 for Alamata_RCP 8.5, 2.12 for Korem at_RCP 4.5, 6 for Korem_RCP 8.5, 1.21 for Maichew_at RCP 4.5, 2.34 for Maichew at RCP 8.5, 6.7 for Mohoni_RCP 4.5, and 10.18 for Mohoni_RCP 8.5. Regression models in time (x) were developed for each meteorological station, with the following equations: y = 135.0207 + 0.3928x for Alamata_at RCP 4.5, y = 113.5203 + 0.9878x for Alamata_at RCP 8.5, y = 75.4969 + 0.2115x for Korem_at RCP 4.5, y = 61.2211 + 0.5994x for Korem at_RCP 8.5, y = 69.2249 + 0.1208x for Maichew_at RCP 4.5, y = 64.6008 + 0.2343x for Maichew at RCP 8.5, y = 78.0919 + 0.6744x for Mohoni_at RCP 4.5 and y = 66.9703 + 1.0180x for Mohoni_at RCP 8.5. All models are significant at p < 0.05, except for the Maichew at RCP 4.5 model, which is not significant (p > 0.05).
The projected climate results will likely increase forest fire potential. Highest KBDI results from the coupled effect of increased maximum temperature and decreased precipitation. Future forest fire (2021–2099) in the forest might be 259, 321, 331, 339, 336, and 370 in near term (2021–2039) RCP 4.5, near term RCP 8.5, midterm (2040–2069) RCP 4.5, midterm RCP 8.5, end term (2070–2099) RCP 4.5 and end term RCP 8.5, respectively. In the near term there might be moderate probability of forest fire occurrence in the midland area. There is likelihood for moderate and high forest fire occurrence under RCPs 4.5 and 8.5 in mid and end term ( and ). In the baseline period, moderate forest fire occurrences induced by climate change were observed for approximately 18.3% of the years. No average of years was identified as having high, very high, or extreme forest fire occurrence. However, in the future period of 2021–2099, the severity of forest fires is projected to increase, with an estimated 27.2–27.8% of years experiencing moderate forest fires, and 3.3–7.8% of years experiencing high forest fires. Similarly with baseline, there will be no very high and extreme fire occurrence years in 2021–2099.
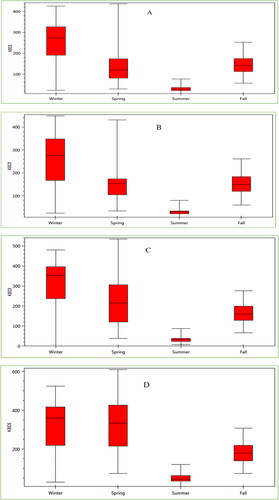
Risk of forest fire incidence in winter might be higher than spring, fall and summer in both scenarios and periods. It was observed that the KBDI values are lowest during summer and fall, while highest level in winter and spring comparatively. In winter KBDI values indicate from 300 to 400 which is a high probability of fire occurrence. Seasonally, it might range more than 400 which is very high in RCP 8.5. In summer and spring, values have a tendency to increase. The winter fire shows a stronger relationship to fire occurrence when compared with spring. The probability of fire risk increases more in a high emission scenario ( and ).
Figure 7. Seasonal forest fire occurrence in baseline and future (A) baseline (B) 2021–2039 under RCP 4.5 (C) 2040–2069 under RCP 4.5, and (D) 2070–2099 under RCP 4.5.
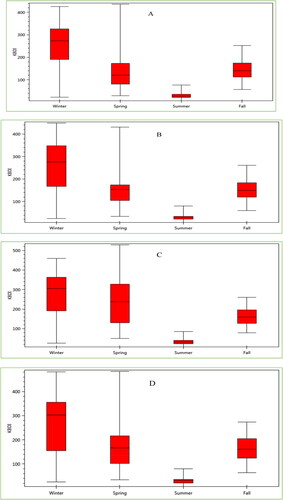
Figure 8. Seasonal Forest fire occurrence in baseline and future (A) baseline, (B) 2021–2039 under RCP 8.5, (C) 2040–2069 under RCP 8.5, and (D) 2070–2099 under RCP 8.5.
At the baseline, the forest had a low to moderate risk of wildfires with no high-risk areas. However, there is a likelihood of increased moderate to high-risk areas by the mid and end terms, in both RCPs ( and ). The midland areas are likely to be the source of fire occurrences due to the higher temperatures and lower rainfall amounts than the highland areas. Analysis of the KBDI data’s spatial distribution revealed relatively higher risk values in the midland, eastern, and southeastern parts of the forest. In the high emission scenario’s end-term, the forest fire risk may expand from the eastern to western regions.
Figure 9. Current and future spatial and temporal variation of climate change induced forest fire under RCP 4.5 (A) baseline, (B) 2021–2039, (C) 2040–2069, and (D) 2070–2099.
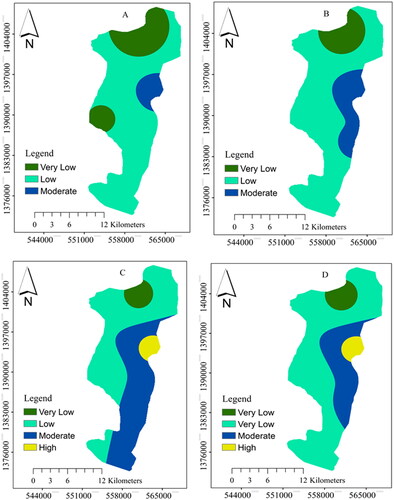
Figure 10. Current and future spatial and temporal variation of climate change induced forest fire under RCP 8.5 (A) baseline, (B) 2021–2039, (C) 2040–2069, and (D) 2070–2099.
4. Discussion
4.1. Climate modelling
Our study indicates that there will be an increase in both the maximum and minimum temperatures in all meteorological stations from 1980 to 2099. Specifically, the forest experiences an increase in maximum and minimum temperatures in the near, mid, and end-term time series of RCPs 4.5 and 8.5, compared to the baseline. The forest is expected to receive varying amounts of precipitation and experience different maximum and minimum temperatures over the near, mid, and end-term periods under RCP 4.5 and 8.5 scenarios. The trends indicate that temperature in the study areas are increasing while there is variation in precipitation, with some variations in the magnitude and significance of the trends depending on the location and the emission scenario. Our study indicates that the trend of annual precipitation shows much greater variability for both the baseline and future. The forest experiences precipitation both increment and reduction in the near, mid, and end-term time series, respectively. The study projects a trend per 10 years for maximum temperature, minimum temperature, and precipitation in the study area from 1980 to 2099 under RCP4.5, ranging from 0.05 °C to 0.227 °C, 0.21 °C to 0.338 °C, and −11.37 to 18.7 mm, respectively. For RCP8.5, the trend per 10 years for maximum temperature, minimum temperature, and precipitation is expected to be within the range of 0.22–0.76 °C, 0.03–0.7 °C, and 0.21–0.338 °C, and −13.05 to 14.72 mm, respectively.
Similarly, McSweeney et al. (Citation2010) reported that the annual temperature of Ethiopia is projected to increase in the future. Besides, an average decadal temperature of Tigray is increasing at the rate of 0.54 °C (Gebrehiwot and Veen Citation2013). In the long term, there is rainfall variability and increasing temperature (Alaminie et al. Citation2021). Biniyam et al. (Citation2021), also found that temperatures might be increased up to 2099 in both RCP’s over the southern Tigray. The highest minimum and maximum temperature were predicted under RCP 8.5. Other studies (e.g. Araya et al. Citation2015) also predicted an increase in average annual minimum and maximum temperature. In addition, Elshamy et al. (Citation2009) projected average annual temperature increase over the northern Ethiopia between 2 °C and 5 °C at the end of the twenty-first century. Temperature forecasts in sub-Saharan Africa there might be elevation of 3.3 °C by the end of this century (Cooper et al. Citation2008). In Tigray, there was an increasing trend of both maximum and minimum temperatures, with minimum temperature increasing at a faster rate (Haftu and Haftom Citation2022). The global average temperature from 1998 to 2012, and 1951–2012 shows an increase of 0.05 °C and 0.12 °C per decade, respectively (IPCC, Citation2013).
Similar to this study, rainfall trend in Tigray region is distributed unevenly and characterized by large spatial variation. This variation is associated with differences in topography (Gebrehiwot and Veen, Citation2013). Additionally, Shongwe et al. (Citation2009) indicated that future projections of precipitation in Ethiopia are complex and difficult to identify trends. There is variability in simulated rainfall conditions by climate models over Africa (Stocker Citation2013). Haftu et al. (Citation2018) and Biniyam et al. (Citation2021) found that both temperature and precipitation are projected to increase and decrease in the RCP 4.5 and 8.5 scenarios up to 2099 in Tigray. Different models predict either negative or positive changes in future rainfall in sub-Saharan Africa (Cooper et al. Citation2008). Kruger (Citation2006) found that significant increases and decreases in precipitation occurred in Africa. Moreover, global rainfall tendencies is variable and characterized by both heavy rains and severe droughts (Traore, Citation2014).
Climate models are valuable tools for supporting decision-making processes and for developing adaptation and mitigation strategies in response to climate change, as highlighted by Weaver et al. (Citation2013). Timely, reliable, and actionable climate predictions are crucial for various stakeholders, including individual users, different sectors, and national development planning, to manage development opportunities and risks, and to plan for effective adaptation and mitigation measures. This study also aims to provide useful information for users and decision-makers.
4.2. Fire modelling
The study area had no climate-induced forest fires during the baseline period of 1980–2020, according to KBDI simulations and key informant interviews. However, the mean KBDI values for various meteorological stations under two RCPs 4.5 and 8.5 indicate a potential risk of increased forest fires in the future. The study projects that the potential for forest fires will increase due to climate change, with an estimated 27.2–27.8% of years experiencing moderate forest fires and 3.3–7.8% of years experiencing high forest fires in the future. The highest risk of forest fires is projected in winter, with KBDI values indicating high probability of fire occurrence. This study suggests that future fire occurrence is likely to increase. The probability of fire risk increases more in high emission scenarios. Climate change will increase forest fire potential, especially in the midland areas of the forest, due to higher temperatures and lower rainfall. The KBDI trend over a 10-year period in the study area from 1980 to 2099, as projected under RCPs 4.5 and 8.5, ranges from 1.21 to 6.7 and 2.34 to 10.18, respectively. Upon annual calculation, the KBDI value for the study area from 1980 to 2099, projected under RCPs 4.5 and 8.5, may range from 21 to 336 and 21 to 370, respectively. Seasonally, it might range more than 400.
Other studies have found that forests worldwide are vulnerable to wildfires due to climate change, with circumboreal forests projected to see an increase in wildfire frequency of 18–50% by 2070–2099 (Flannigan et al. Citation2009). Different regions of the world may see increases in forest fire risk, with some areas shifting from low to moderate or from moderate to high risk (Yongqiang et al. Citation2010). The predicted variation of fuel moisture with higher temperatures due to climate change is expected to intensify the frequency and extent of forest fires. Climate change is considered a fundamental driver of forest fire occurrence, and fire patterns are strongly influenced by climate variability and change (Haftu and Kelali Citation2019). Forest fires occurred in Ethiopia fires occur in the late dry season (Abera and Kinahan Citation2011). In particular, the probability of forest fires during dry seasons is likely to increase due to the effects of climate change (Machado et al. Citation2014; Libonati et al. Citation2015). The significant correlation between climate and the annual burnt area indicates that climate change was primarily accountable for the recent changes in the burnt area in Ethiopia. This trend is also evident across sub-Saharan Africa, as highlighted by studies such as Zubkova et al. (Citation2019) and Wei et al. (Citation2020).
Forest fires in Mediterranean regions are most common during the hot and dry summer months (Gülsen and Sönmez Citation2016), while in southern Europe, the risk of forest fires also increases during the summer season (Giannakopoulos et al. Citation2009). However, in Tigray, forest fire risk is highest during the winter and spring seasons (Haftu and Kelali Citation2019). Drought conditions can also trigger forest fires in Ethiopia, as evidenced by studies in the country’s southern regions where forests have burned during dry seasons (Dechassa Lemessa and Perault Citation2001). Climate change increases wildfire magnitudes and occurrences (Brown et al. Citation2004). Wide research describes the linkages among climate and fire (Beckage et al. Citation2003; Gedalof et al. Citation2005). Similar observations have been made that increase in dry season results in longer fire seasons and leads to higher emissions (Kasischke and Turetsky Citation2006; Turetsky et al. Citation2011). According to this study, Canada forest fire might increase by 25% by 2030 and 75% by the end of the twenty-first century predicted using Canadian Climate Centre GCM scenarios and increase by 140% by the end of twenty-first century predicting using Hadley Centre GCM (Wotton et al. Citation2010). GCM projected climate produced for western boreal North America, shows forest fires increases in the future (Balshi et al. Citation2009). Climate change has already changed fire trends globally. It also leads to increased emissions and loss of forest cover (Scholze et al. Citation2006). Accordingly, this general increase in fire occurrence across the forest agrees with other international studies of the impacts of climate change on fire occurrence.
Forest fire prevention policies and measures implemented in different periods have a significant impact on the occurrence and patterns of forest fires, as highlighted by Ingalsbee (Citation2017). The negative impacts associated with large-scale uncontrolled forest fires have increased worldwide over the past two decades, with an estimated 300–400 million hectares of forests and woodlands burning annually and emitting approximately 9.2 billion tonnes of greenhouse gases (Jurvélius, Citation2004). To mitigate these dangers, proactive methods have been developed, including prediction mechanisms that provide early warnings of forest fires (de Groot et al. Citation2015). These proactive methods are effective in preventing or mitigating the loss caused by forest fires. The prediction of forest fire occurrence prior to each fire season could aid policymakers in implementing appropriate fuel management policies in vulnerable areas, as well as optimizing firefighting resources to mitigate the adverse effects of forest fires, as noted by Turco et al. (Citation2013). The construction of firebreaks and fire towers are additional measures that offer potential for substantial improvement in prevention and response capacity. Human-induced forest fire management should be practiced. The study emphasizes the need to plan and apply sustainable climate change mitigation, adaptation, and resilience measures to mitigate the future impacts of climate change. These findings are important for forest fire management offices in planning their fire management strategies under climate change. Thus, it is essential to develop proactive fire management strategies that aim to prevent fires from happening. Our study is also among these proactive management methods.
4.3. Contribution of the study
Climate prediction and forest fire prediction play important roles in forest management and conservation in Ethiopia. The prediction helps to anticipate and prepare for potential changes in temperature and precipitation patterns, which can affect forest fire risk (Haftu and Kelali Citation2019). Meanwhile, forest fire prediction models can help to identify areas at high risk for forest fires, allowing for targeted prevention and firefighting efforts (Mekuria and Ayana Citation2015). Other studies have highlighted the importance of forest management practices in mitigating the effects of climate change and forest fires in Ethiopia. For example, Bekele et al. (Citation2019) suggested that sustainable forest management practices, such as reduced impact logging and reforestation, could help to reduce forest fire risk in Ethiopia. Similarly, studies (Mengist and Alemu Citation2019; Zerga et al. Citation2019) found that community-based forest management practices in Ethiopia could help to reduce the vulnerability of forests to climate change and forest fires. In general, climate prediction and forest fire prediction play important roles in managing and conserving Ethiopia’s forests in the face of climate change. By anticipating and mitigating the effects of climate change and forest fires, it may be possible to reduce the impact of these threats on Ethiopia’s valuable forest ecosystems.
Climate and forest fire prediction play a crucial role in informing policy makers on the potential impacts of climate change on forest ecosystems and the associated risk of wildfire. This study can aid in developing policies and strategies to mitigate the effects of climate change and reduce the likelihood of forest fires. Furthermore, such types of studies can help policy makers identify areas at high risk of fire, allowing for targeted resource allocation and early warning systems. The integration of these prediction models into policy making can support the development of proactive management practices and aid in preserving and protecting valuable forest ecosystems (Calkin et al. Citation2011; Paveglio et al. Citation2013). In addition, this study’s results can also be used to raise awareness among stakeholders about the importance of protecting forest ecosystems and the potential consequences of climate change on these ecosystems (FAO Citation2019; Grose et al. Citation2014). Furthermore, stakeholders involved in climate change mitigation and adaptation can utilize the results of this study to develop and implement effective strategies to address the impacts of climate change on forest ecosystems. The study’s findings can also provide a basis for collaborations between different stakeholder groups, such as NGOs, governments, and communities, to develop comprehensive and integrated management practices that consider the complex interactions between climate change, forest ecosystems, and forest fires (FAO, Citation2018; O’Brien et al. Citation2004). The role of forest fire prediction and climate modelling is an important study for achieving the UN sustainable development goals (SDGs).
4.4. Limitations and challenges of the study
Africa is a region with limited availability of validated and calibrated GCMs, which can affect the accuracy of climate change predictions (Seidl and Turner Citation2022). To address this limitation, this study uses an ensemble of GCMs, which is a technique that combines the outputs of multiple GCMs to create a more robust and reliable prediction. The use of an ensemble of GCMs allows for a better understanding of the uncertainties and variability in the climate change predictions, which can inform policy-making and management strategies (Giorgi et al. Citation2009; IPCC, Citation2013; Ali et al. Citation2019). Additionally, the ensemble approach can provide a more comprehensive view of the potential impacts of climate change on forest ecosystems and wildfire risk, which can support the development of effective adaptation and mitigation measures (Seidl and Turner Citation2022). In addition, more than two years war and siege in Tigray, Ethiopia were the main challenge of this study. It affects access to study sites, as it is located in war-affected area to find updated documents and for field surveys.
5. Conclusion
The study analysed the changes in temperature and precipitation between 1980 and 2099. It was found that the forest will experience increased temperature by the middle and end of the century, and these changes were statistically significant across all meteorological locations. However, the precipitation trends showed both positive and negative slopes, and were not as uniform as temperature changes. The study also predicted the likelihood of forest fires and found that the potential for forest fires is expected to increase in the future climate, particularly in the midland part of the forest during the winter and spring seasons. In the future high emission scenario, there will be one level increment on fire prediction. The magnitude of fire occurrence will be increased. The probability of fire risk is higher in high emission scenarios compared to medium emission scenarios and baselines. The use of KBDI helped in the prediction of forest fires. Forest fires occurring in the study area due to climate change are expected to contribute to global greenhouse gas emissions and other impacts of climate change.
In order to enhance the accuracy of fire risk prediction, future research should aim to incorporate additional variables such as human activities, land use type, land cover change, socioeconomic projections, wind speed, and forest density. Although KBDIS provides valuable insights into fire risk based on climate and soil moisture data, the integration of other machine learning techniques with KBDI can further improve the precision of fire risk forecasting.
Data availability statement
Availability of data and material: Data will be made available on request.
Acknowledgment
I would like to express my sincere gratitude to the PASET/RSIF team for their consistent support, especially during the war and the complete siege of Tigray, Ethiopia.
Disclosure statement
The authors declare no conflict of interest.
References
- Abay NG. 2018. Cactus (Opuntia ficus-indica): current utilization and future threats as cattle forage in Raya Azebo, Ethiopia. EMSD. 7(3):1–3. doi: 10.5296/emsd.v7i3.12806.
- Abera K, Kinahan AA. 2011. Factors affecting fire extent and frequency in the Bale Mountains National Park. In: D. Randall, S. Thirgood, A. Kinahan editors. Walia-Special edition on the Bale Mountains, Frankfurt Zoological Society, Addis Ababa; pp. 146–157.
- Alaminie AA, Tilahun SA, Legesse SA, Zimale FA, Tarkegn GB, Jury MR. 2021. Evaluation of past and future climate trends under CMIP6 scenarios for the UBNB (Abay), Ethiopia. Water. 13(15):2110. doi: 10.3390/w13152110.
- Ali S, Eum HI, Cho J, Dan L, Khan F, Dairaku K, Shrestha ML, Hwang S, Nasim W, Khan IA, et al. 2019. Assessment of climate extremes in future projections downscaled by multiple statistical downscaling methods over Pakistan. Atmos Res. 222:114–133. doi: 10.1016/j.atmosres.2019.02.009.
- Araya A, Hoogenboom G, Luedeling E, Hadgu KM, Kisekka I, Martorano LG. 2015. Assessment of maize growth and yield using crop models under present and future climate in southwestern Ethiopia. Agric for Meteorol. 214–215:252–265. doi: 10.1016/j.agrformet.2015.08.259.
- Arpaci A, Eastaugh CS, Vacik H. 2013. Selecting the best performing fire weather indices for Austrian ecoregions. Theor Appl Climatol. 114(3–4):393–406. doi: 10.1007/s00704-013-0839-7.
- Balshi MS, McGuire AD, Duffy P, Flannigan M, Walsh J, Melillo J. 2009. Assessing the response of area burned to changing climate in western boreal North America using a Multivariate Adaptive Regression Splines (MARS) approach. Glob Change Biol. 15(3):578–600 doi: 10.1111/j.1365-2486.2008.01679.x.
- Beckage B, Platt WJ, Slocum MG, Panko B. 2003. Influence of the El Nino Southern Oscillation on fire regimes in the Florida Everglades. Ecology. 84(12):3124–3130. doi: 10.1890/02-0183.
- Bekele M, Mengesha B. 2001. Fire situation in Ethiopia. Int For Fire News (IFFN). 25:7–12.
- Bekele A, Tegegne F, Mekuria W, Garedew E. 2019. Impacts of human activities on forest cover change and forest fires in Ethiopia. Forests. 10(3):226.
- Belayneh A, Yohannes T, Worku A. 2013. Recurrent and extensive forest fire incidence in the Bale Mountains National Park (BMNP), Ethiopia: extent, cause and consequences. Int J Environ Sci. 2(1):29–39.
- Biniyam Y, Shiferaw H, Haftu A, Gebremedhin A, Hagos H, Adhana K, Bezabh T. 2021. Spatio‐temporal characteristics of meteorological drought under changing climate in semi‐arid region of northern Ethiopia. Environ Syst Res. 10(1):1–10. doi: 10.1186/s40068-021-00226-4.
- Brown TJ, Hall BL, Westerling AL. 2004. The impact of twenty-first century climate change on wildland fire danger in the Western United States: an applications perspective. Clim Change. 62(1–3):365–388. doi: 10.1023/B:CLIM.0000013680.07783.de.
- Calkin DE, Ager A, Thompson MP, Finney MA, Lee DC, Quigley TM, McHugh CW, Riley KL, Gilbertson-Day JM. 2011. A comparative risk assessment framework for wildland fire management: the 2010 cohesive strategy science report. Fort Collins, CO: U.S. Department of Agriculture, Forest Service, Rocky Mountain Research Station. General Technical Report RMRS-GTR-262.
- Camici S, Brocca L, Melone F, Moramarco T. 2014. Impact of climate change on flood frequency using different climate models and downscaling approaches. J Hydrol Eng. 19(8):04014002. doi: 10.1061/(ASCE)HE.1943-5584.0000959.
- Central Statistical Agency (CSA). 2007. The 2007 population and housing census of Ethiopia: statistical report for Tigray region. Addis Ababa: Central Statistical Agency;
- Clarke H, Nolan RH, De Dios VR, Bradstock R, Griebel A, Khanal S, Boer MM. 2022. Forest fire threatens global carbon sinks and population centres under rising atmospheric water demand. Nat Commun. 13(1):7161. doi: 10.1038/s41467-022-34966-3.
- Cooper PJM, Dimes J, Rao KPC, Shapiro B, Shiferaw B, Twomlow S. 2008. Coping better with current climatic variability in the rain-fed farming systems of sub- Saharan Africa: an essential first step in adapting to future climate change? Agric Ecosyst Environ. 126(1–2):24–35. doi: 10.1016/j.agee.2008.01.007.
- de Groot WJ, Wotton BM, Flannigan MD. 2015. Wildland fire danger rating and early warning systems. Wildfire hazards, risks and disasters. Amsterdam, Netherlands: Elsevier; p. 207–228.
- Dechassa Lemessa D, Perault M. 2001. Forest fires in Ethiopia: reflections on socio-economic and environmental effects of the fires in. Addis Ababa and Providence. Providence (RI): UNDP Emergencies Unit for Ethiopia and Brown University; p. 2000.
- Demissie F, Yeshitela K, Rouleau M, Flaspohler D, Kindu M. 2019. Socio-economic importance of forest resources and their conservation measures in Ethiopia: the case of area closure in South Gonder of Ethiopia. Environ Monit Assess. 191(7):437. doi: 10.1007/s10661-019-7569-y.
- Dinku T, Thomson MC, Cousin R, del Corral J, Ceccato P, Hansen J, Connor SJ. 2018. Enhancing national climate services (ENACTS) for development in Africa. Clim Dev. 10(7):664–672. doi: 10.1080/17565529.2017.1405784.
- Dripps WR, Bradbury KR. 2007. A simple daily soil–water balance model for estimating the spatial and temporal distribution of groundwater recharge in temperate humid areas. Hydrogeol J. 15(3):433–444. doi: 10.1007/s10040-007-0160-6.
- Elshamy M, Seierstad IA, Sorteberg A. 2009. Impacts of climate change on Blue Nile flows using bias-corrected GCM scenarios. Hydrol Earth Syst Sci. 13(5):551–565. doi: 10.5194/hess-13-551-2009.
- FAO. 2016. Global forest resources assessment 2015. How are the world’s forests changing? Second edition. Rome: Food and Agriculture Organization of the United Nations. [accessed 13 March 2023]. https://www.fao.org/3/i4793e/i4793e.pdf.
- FAO. 2018. Forests and climate change. Rome: Food and Agriculture Organization of the United Nations.
- FAO. 2019. The state of the world’s forests 2018 - forest pathways to sustainable development. Rome: Food and Agriculture Organization of the United Nations.
- FAO. 2020. Towards a fire-free Ethiopia: a strategy for effective fire management. Rome: Food and Agriculture Organization of the United Nations.
- Faramarzi H, Hosseini SM, Pourghasemi HR, Farnaghi M. 2021. Forest fire spatial modelling using ordered weighted averaging multi-criteria evaluation. J For Sci. 67(2):87–100. doi: 10.17221/50/2020-JFS.
- Feidas H, Cartalis C, Lagouvardos C. 2002. Temporal simulation of diurnal air temperature and relative humidity at a forested mountainous site in Attica, Greece. Thessaloniki, Greece: Aristotle University of Thessaloniki.
- FFE (Forum for the Environment). 2009. Tackling the frequent forest fire incidence in Ethiopia. Forum for the Environment. Ethiopia: Addis Ababa.
- Finkele K, Mills GA, Beard G, Jones DA. 2006. National gridded drought factors and comparison of two soil moisture deficit formulations used in prediction of Forest Fire Danger Index in Australia. Aust Meteorol Mag. 55:183–197.
- Flannigan M, Stocks B, Turetsky M, Wotton M. 2009. Impacts of climate change on fire activity and fire management in the circumboreal forest. Glob Change Biol. 15(3):549–560. doi: 10.1111/j.1365-2486.2008.01660.x.
- Funk C, Peterson P, Landsfeld M, Pedreros D, Verdin J, Shukla S, Husak G, Rowland J, Harrison L, Hoell A, et al. 2015. The climate hazards infrared precipitation with stations—a new environmental record for monitoring extremes. Sci Data. 2(1):150066. doi: 10.1038/sdata.2015.66.
- Ganatsas P, Antonis M, Marianthi T. 2011. Development of an adapted empirical drought index to the Mediterranean conditions for use in forestry. Agric for Meteorol. 151(2):241–250. doi: 10.1016/j.agrformet.2010.10.011.
- Gebrehiwot T, Veen vdA 2013. Assessing the evidence of climate variability in the northern part of Ethiopia. J Dev Agric Econ. 5(3):104–119. doi: 10.5897/JDAE12.056.
- Gedalof Z, Peterson DL, Mantua NJ. 2005. Atmospheric, climatic, and ecological controls on extreme wildfire years in the Northwestern United States. Ecol Appl. 15(1):154–174. doi: 10.1890/03-5116.
- George CW, Mutch RW. 2001. Ethiopia: strengthening forest fire management. Rome: FAO Project Document (TCP/ETH/0065).
- Giannakopoulos C, Le Sager P, Bindi M, Moriondo M, Kostopoulou E, Goodess CM. 2009. Climatic changes and associated impacts in the Mediterranean resulting from a 2 C global warming. Glob Planet Change. 68(3):209–224. doi: 10.1016/j.gloplacha.2009.06.001.
- Gil-Romera G, Adolf C, Benito BM, Bittner L, Johansson MU, Grady DA, Lamb HF, Lemma B, Fekadu M, Glaser B, et al. 2019. Long-term fire resilience of the Ericaceous Belt, Bale Mountains, Ethiopia. Biol Lett. 15(7):20190357.
- Giorgi F, Jones C, Asrar GR. 2009. Addressing climate information needs at the regional level: the CORDEX framework. World Meteorol Organ (WMO) Bull. 58(3):175.
- Grose MR, Fox-Hughes P, Harris RMB, Bindoff NL. 2014. Changes to the drivers of fire weather with a warming climate – a case study of southeast Tasmania. Clim Change. 124:255–269. doi: 10.1007/s10584-014-1070-y
- Gülşen KUM, Sönmez M. 2016. Determination of meteorological forest fire risks in mediterranean climate of Turkey. KSÜ Doğ Bil Derg. 19(2):181–192. doi: 10.18016/ksujns.11183.
- Haftu A, Birhane E, Zenebe A, Hagos H, Girma A, Aynekulu E, Alemie A. 2018. Modeling the impacts of climate change and cochineal (Dactylopius coccus Costa) invasion on the future distribution of cactus pear (Opuntia ficus-indica (L.) Mill.) in Northern Ethiopia. J Prof Assoc Cactus. 20(2):128–150. doi: 10.56890/jpacd.v20i.33.
- Haftu A, Haftom H. 2022. Characterization of changing trends of baseline and future predicted precipitation and temperature of Tigray, Ethiopia. J Agrometeorol. 24(3):235–240.
- Haftu A, Kelali A. 2019. Desa’a national forest reserve susceptibility to fire under climate change. Forest Science and Technology. 15:140–146. doi: 10.1080/21580103.2019.1628109.
- Haile GG, Tang Q, Sun S, Huang Z, Zhang X, Liu X. 2019. Droughts in East Africa: causes, impacts and resilience. Earth Sci Rev. 193:146–161. doi: 10.1016/j.earscirev.2019.04.015.
- Hansen LJ, Biringer JL, Hoffman J. 2003. Buying time. A user’s manual for building resistance and resilience to climate change in natural systems. [accessed 06 April 2023]. https://wwfint.awsassets.panda.org/downloads/buyingtime_unfe.pdf.
- Harris LB, Taylor AH, Kassa H, Leta S, Powell B. 2023. Humans and climate modulate fire activity across Ethiopia. Fire Ecol. 19(1):1–16. doi: 10.1186/s42408-023-00171-w.
- Healey SP, Urbanski SP, Patterson PL, Garrard C. 2014. A framework for simulating map error in ecosystem models. Remote Sens Environ. 150:207–217. doi: 10.1016/j.rse.2014.04.028.
- Holsten A, Dominic AR, Costa L, Kropp JP. 2013. Evaluation of the performance of meteorological forest fire indices for German federal states. For Ecol Manage. 287:123–131. doi: 10.1016/j.foreco.2012.08.035.
- Ingalsbee T. 2017. Whither the paradigm shift? Large wildland fires and the wildfire paradox offer opportunities for a new paradigm of ecological fire management. Int J Wildland Fire. 26(7):557–561. doi: 10.1071/WF17062.
- IPCC. 2013. Technical summary. Climate change 2013: the physical science basis. Contribution of Working Group I to the Fifth Assessment Report of the Intergovernmental Panel on Climate Change. Cambridge: Cambridge University Press.
- Jolly WM, Cochrane MA, Freeborn PH, Holden ZA, Brown TJ, Williamson GJ, Bowman DMJS. 2015. Climate-induced variations in global wildfire danger from 1979 to 2013. Nat Commun. 6(1):7537. doi: 10.1038/ncomms8537.
- Jurvélius M. 2004. Health and protection | forest fires (prediction, prevention, preparedness and suppression). In: Burley J, editor. Encyclopedia of forest sciences. Oxford: Elsevier; p. 334–339.
- Kandya A, Kimothi M, Jadhav R, Agarwal J. 1998. Application of Geographic Information System in Identification of 'Fire-Prone’ Areas-a Feasibility Study in Parts of Junagadh (Gujarat). Indian For. 124:531–536.
- Kasischke ES, Turetsky MR. 2006. Recent changes in the fire regime across the North American boreal region: spatial and temporal patterns of burning across Canada and Alaska. Geophys Res Lett. 33(9):L09703. doi: 10.1029/2006GL025677.
- Keetch JJ, Byram GM. 1968. A drought index for forest fire control. Washington (DC): US Department of Agriculture, Forest Service, Southeastern Forest Experiment.
- Kendall MG. 1975. Rank correlation methods. 4th ed. London: Charles Griffin; p. 272.
- Kidane L, Bekele T, Nemomissa S. 2010. Vegetation composition in Hugumbirda-Gratkhassu National Forest Priority Area, South Tigray. Momona Ethiop J Sci. 2:27–48.
- Kidu G, Gebremedhin B, Birhane E, Kassa H. 2017. Does communal forest intervention management enhance forest benefits of smallholder farmers? Evidence from Hugumbirda forest, Tigray, Ethiopia. J Sustain For. 36(3):264–276. doi: 10.1080/10549811.2017.1296775.
- Knutti R, Allen MR, Friedlingstein P, Gregory JM, Hegerl GC, Meehl GA, Meinshausen M, Murphy JM, Plattner GK, Raper SCB, et al. 2008. A review of uncertainties in global temperature projections over the twenty-first century. J Clim. 21(11):2651–2663., doi: 10.1175/2007JCLI2119.1.
- Kruger AC. 2006. Observed trends in daily precipitation indices in South Africa: 1910– 2004. Int J Climatol. 26(15):2275–2285. doi: 10.1002/joc.1368.
- Lemessa D, Perault M. 2001. Forest fires in Ethiopia: reflections on socio-economic and environmental effects of the fires in 2000. Assessment Study June-September. Addis Ababa and Providence (RI): UNDP Emergencies Unit for Ethiopia and Brown University.
- Libonati R, Dacamara CC, Setzer AW, Morelli F, Melchiori, AE. 2015. An Algorithm for burned area detection in the Brazilian Cerrado using 4µm MODIS imagery. Remote Sens. 7(11):15782–15803. doi: 10.3390/rs71115782.
- Ly S, Charles C, Degré A. 2013. Different methods for spatial interpolation of rainfall data for operational hydrology and hydrological modeling at watershed scale: a review. Biotechnol Agron Soc Environ. 17:392–406.
- Machado NG, da Silva FCP, Biudes MS. 2014. Efeito das condições meteorológicas sobre o risco de incêndio e o número de queimadas urbanas e focos de calor em CuiabáMT, Brasil. CeN. 36(3):459–469. doi: 10.5902/2179460X11892.
- Mann HB. 1945. Nonparametric tests against trend. Econometrica. 13(3):245–259. doi: 10.2307/1907187.
- Massada AB, Syphard AD, Stewart SI, Radeloff VC. 2013. Wildfire ignition-distribution modelling: a comparative study in the Huron–Manistee National Forest, Michigan, USA. Int J Wildland Fire. 22(2):174–183. doi: 10.1071/WF11178.
- Masson-Delmotte V, Zhai P, Pirani A, Connors SL, Péan C, Berger S, Caud N, Chen Y, Goldfarb L, Gomis MI, et al. 2021. Climate change 2021: the physical science basis. Contribution of working group I to the sixth assessment report of the intergovernmental panel on climate change. Cambridge: Cambridge University Press.
- McDowell NG, Allen CD, Anderson-Teixeira K, Aukema BH, Bond-Lamberty B, Chini L, Clark JS, Dietze M, Grossiord C, Hanbury-Brown A, et al. 2020. Pervasive shifts in forest dynamics in a changing world. Science. 368(6494):eaaz9463. doi: 10.1126/science.aaz9463.
- McSweeney C, Lizcano G, New M, Lu X. 2010. The UNDP climate change country profiles: improving the accessibility of observed and projected climate information for studies of climate change in developing countries. Bull Amer Meteor Soc. 91(2):157–166. doi: 10.1175/2009BAMS2826.1.
- Mekuria W, Ayana A. 2015. Forest fire prediction using remote sensing and GIS in Bale Mountains National Park, Ethiopia. Int J Remote Sens. 36(2):458–476.
- Mengist D, Alemu M. 2019. Community based participatory forest resources management practices in Chilimo forest, Dendi District, West Shewa Zone, Oromia regional state Ethiopia. African J Agric Res. 14(35):2119–2134.
- Miller R, Nielsen E, Huang CH. 2017. Ecosystem service valuation through wildfire risk mitigation: design, governance, and outcomes of the Flagstaff Watershed Protection Project (FWPP). Forests. 8(5):142. doi: 10.3390/f8050142.
- MoA. 2000. Proceedings of the round table conference on integrated forest fire management in Ethiopia, 19–20 September 2000, Ministry of Agriculture, Addis Ababa, Ethiopia, in collaboration with GTZ and GFMC.
- Mouillot F, Field CB. 2005. Fire history and the global carbon budget: a 1 × 1 fire history reconstruction for the 20th century. Global Change Biol. 11(3):398–420. doi: 10.1111/j.1365-2486.2005.00920.x.
- Mubiru DN, Komutunga E, Agona A, Apok A, Ngara T. 2012. Characterising agrometeorological climate risks and uncertainties: crop production in Uganda. South Afr J Sci. 108(3–4):108–118. doi: 10.4102/sajs.v108i3/4.470.
- O’Brien K, Leichenko R, Kelkar U, Venema H, Aandahl G, Tompkins H, Javed A, Bhadwal S, Barg S, Nygaard L, et al. 2004. Mapping vulnerability to multiple stressors: climate change and globalization in India. Glob Environ Change. 14(4):303–313. doi: 10.1016/j.gloenvcha.2004.01.001.
- Ongoma V, Chen H. 2017. Temporal and spatial variability of temperature and precipitation over East Africa from 1951 to 2010. Meteorol Atmos Phys. 129(2):131–144. doi: 10.1007/s00703-016-0462-0.
- Pausas JG, Llovet J, Rodrigo A, Vallejo R. 2008. Are wildfires a disaster in the Mediterranean basin?–A review. Int J Wildland Fire. 17(6):713–723. doi: 10.1071/WF07151.
- Paveglio TB, Prato T, Hardy M. 2013. Simulating effects of land use policies on extent of the wildland urban interface and wildfire risk in Flathead County, Montana. J Environ Manage. 130:20–31. doi: 10.1016/j.jenvman.2013.08.036.
- Piñol J, Terradas J, Lloret F. 1998. Climate warming, wildfire hazard, and wildfire occurrence in coastal eastern Spain. Clim Change. 38(3):345–357. doi: 10.1023/A:1005316632105.
- Rahman S, Chang HC, Magill C, Tomkins K, Hehir W. 2018. Forest fire occurrence and modeling in Southeastern Australia. London: IntechOpen.
- Riahi K, Grübler A, Nakicenovic N. 2007. Scenarios of long-term socio-economic and environmental development under climate stabilization. Technol Forecast Soc Change. 74(7):887–935. doi: 10.1016/j.techfore.2006.05.026.
- Riahi K, Rao S, Krey V, Cho C, Chirkov V, Fischer G, Kindermann G, Nakicenovic N, Rafaj P. 2011. RCP 8.5. A scenario of comparatively high greenhouse gas emissions. Clim Change. 109(1–2):33–57. doi: 10.1007/s10584-011-0149-y.
- Sakr GE, Elhajj IH, Mitri G, Wejinya UC. 2010. Artificial intelligence for forest fire prediction. In Proceedings of the IEEE/ASME International Conference Advanced Intelligent Mechatronics; July 6–9, Montreal, QC. AIM. p. 1311–1316.
- Scholze M, Knorr W, Arnell NW, Prentice IC. 2006. A climate-change risk analysis for world ecosystems. Proc Natl Acad Sci USA. 103(35):13116–13120. doi: 10.1073/pnas.0601816103.
- Seidl R, Turner MG. 2022. Post-disturbance reorganization of forest ecosystems in a changing world. Proc Natl Acad Sci USA. 119(28):e2202190119. doi: 10.1073/pnas.2202190119.
- Sertse SF, Khan NA, Shah AA, Liu Y, Naqvi SAA. 2021. Farm households’ perceptions and adaptation strategies to climate change risks and their determinants: evidence from Raya Azebo district, Ethiopia. Int J Disaster Risk Reduct. 60:102255. doi: 10.1016/j.ijdrr.2021.102255.
- Shongwe M, Van Oldenborgh G, Van Den Hurk B, De Boer B, Coelho C, Van Aalst M. 2009. Projected changes in mean and extreme precipitation in Africa under global warming. Part I: southern Africa. J Clim. 22(13):3819–3837. doi: 10.1175/2009JCLI2317.1.
- Štěpánek P. 2005. AnClim-software for time series analysis. Brno, Czechia: Department of Geography, Faculty of Natural Sciences, MU, Brno, 1.
- Stocker TF. 2013. Climate change 2013: the physical science basis: working group I contribution to the fifth assessment report of the intergovernmental panel on climate change. Cambridge: Cambridge University Press.
- Szerszynski B, Urry J. 2010. Changing climates: introduction. London: SAGE Publications Sage. doi: 10.1177/0263276409362091.
- Tariq A, Jiango Y, Lu L, Jamil A, Al-Ashkar I, Kamran M, Sabagh AE. 2023. Integrated use of sentinel-1 and sentinel-2 data and open-source machine learning algorithms for burnt and unburnt scars. Geomatics Nat Hazards Risk. 14(1):2190856. doi: 10.1080/19475705.2023.2190856.
- Tariq A, Shu H, Siddiqui S, Mousa BG, Munir I, Nasri A, Waqas H, Lu L, Baqa MF. 2021. Forest fire monitoring using spatial-statistical and geo-spatial analysis of factors determining forest fire in Margalla Hills, Islamabad, Pakistan. Geomatics Nat Hazards Risk. 12(1):1212–1233. doi: 10.1080/19475705.2021.1920477.
- Tariq A, Shu H, Siddiqui S, Munir I, Sharifi A, Li Q, Lu L. 2022. Spatio-temporal analysis of forest fire events in the Margalla Hills, Islamabad, Pakistan using socio-economic and environmental variable data with machine learning methods. J For Res. 33(1):183–194. doi: 10.1007/s11676-021-01354-4.
- Traore B. 2014. Climate change, climate variability and adaptation options in smallholder cropping systems of the Sudano - Sahel region in West Africa. Doctor of Philosophy, Wageningen: Wageningen University.
- Turco M, Llasat MC, Tudela A, Castro X, Provenzale A. 2013. Brief communication decreasing fires in a Mediterranean region (1970–2010, NE Spain). Nat Hazards Earth Syst Sci. 13(3):649–652. doi: 10.5194/nhess-13-649-2013.
- Turetsky MR, Kane ES, Harden JW, Ottmar RD, Manies KL, Hoy E, Kasischke ES. 2011. Recent acceleration of biomass burning and carbon losses in Alaskan forests and peatlands. Nat Geosci. 4(1):27–31. doi: 10.1038/ngeo1027.
- van Vuuren DP, Edmonds J, Kainuma M, Riahi K, Thomson A, Hibbard K, Hurtt GC, Kram T, Krey V, Lamarque JF, et al. 2011. The representative concentration pathways: an overview. Clim Change. 109(1–2):5–31. doi: 10.1007/s10584-011-0148-z.
- Viljur ML, Abella SR, Adámek M, Alencar JBR, Barber NA, Beudert B, Burkle LA, Cagnolo L, Campos BR, Chao A, et al. 2022. The effect of natural disturbances on forest biodiversity: an ecological synthesis. Biol Rev. 97(5):1930–1947. doi: 10.1111/brv.12876.
- Weaver CP, Lempert RJ, Brown C, Hall JA, Revell D, Sarewitz D. 2013. Improving the contribution of climate model information to decision making: the value and demands of robust decision frameworks. WIREs Clim Change. 4(1):39–60. doi: 10.1002/wcc.202.
- Wei F, Wang S, Fu B, Brandt M, Pan N, Wang C, Fensholt R. 2020. Nonlinear dynamics of fires in Africa over recent decades controlled by precipitation. Glob Chang Biol. 26(8):4495–4505. doi: 10.1111/gcb.15190.
- Wotton BM, Nock CA, Flannigan MD. 2010. Forest fire occurrence and climate change in Canada. Int J Wildland Fire. 19(3):253–271. doi: 10.1071/WF09002.
- Yongqiang L, John S, Scott G. 2010. Trends in global wildfire potential in a changing climate. For Ecol Manage. 259:685–697.
- Zerga B, Workineh B, Teketay D, Woldetsadik M. 2019. Community based forest management (CBFM) in Ethiopia: progress and prospects. J Theor Applied Sci. 2(2):8.
- Zubkova M, Boschetti L, Abatzoglou JT, Giglio L. 2019. Changes in fire activity in Africa from 2002 to 2016 and their potential drivers. Geophys Res Lett. 46(13):7643–7653. doi: 10.1029/2019gl083469.