
 ?Mathematical formulae have been encoded as MathML and are displayed in this HTML version using MathJax in order to improve their display. Uncheck the box to turn MathJax off. This feature requires Javascript. Click on a formula to zoom.
Abstract
Groundwater resource problems are increasing development and planning challenges due to climate change and overexploitation, necessitating assessments of their potential and productivity. The study area has been facing a groundwater level decline problem for many years, and these results can help increase the groundwater level in the basaltic rock area. In this research, we have worked on the demarcation and suitability of groundwater potential zones using GIS and Analytical Hierarchical Process (AHP) methods for the Urmodi River Basin. This research prepared eight thematic maps, that is, geomorphology, geology, drainage density, land use/land cover, elevation, lineament density and slope from satellite data and GIS methods, which play a primary factor in determining the proper groundwater potential zones. In this study, every thematic map was allocated weights depending on its specific characteristics and contribution to the groundwater potential capacity. The weights were determined using the AHP method, which considers the comparative significance of every layer about others. This weighting procedure allowed for a comprehensive assessment of the factors influencing groundwater potential in the Urmodi River basin. The resulting groundwater potential map was divided into four classes, that is, good, excellent, moderate, and poor. The study revealed that approximately 22.69% of the basin had excellent groundwater potential, 28.96% had good potential, 25.32% had moderate potential, and 22.92% had poor potential. These study findings suggest that a significant portion of the Urmodi River Basin exhibits good to moderate groundwater potential, indicating promising opportunities for sustainable groundwater utilization in the region. The groundwater potential zone map accuracy is 84% based on the Receiver Operating Characteristic (ROC) method. These results can have implications for sustainable groundwater resources and provide a framework for conducting similar assessments in other regions. The results can be more important for sustainable development goals and helpful in increasing groundwater levels in the area.
1. Introduction
Groundwater is a dynamic natural resource that resides below the earth’s surface in soil and rock pore spaces and breaks within rock formations (Kandekar et al. Citation2021; Pande et al. Citation2022). It significantly sustains diverse human activities and ecosystems globally (Akhtar et al. Citation2020; Ozegin et al. Citation2023). Groundwater is a crucial resource that fulfills various human needs, including domestic, industrial, agricultural, and other developmental determinations (Li et al. Citation2023; Ma et al. Citation2023). The value of groundwater is immeasurable, as it supports diverse economic sectors and plays a vital role in sustaining life on our planet. In countries like India, where agriculture is the dominant sector and a significant source of livelihood for millions of people, the importance of groundwater cannot be overstated (Wu et al. Citation2023). Groundwater serves as a critical water source for irrigation, especially in regions where surface water is scarce or inaccessible. Nearly 60% of India’s total irrigated area is estimated to rely on groundwater (Sahu et al. Citation2018; Pande Citation2020b).
Additionally, in remote areas, groundwater fulfills approximately 85% of the rural population’s domestic water needs, highlighting its significance in meeting fundamental human requirements (Dhawan Citation2017; Pande Citation2020a, Citationb). Ensuring sustainable management of groundwater resources is vital to maintaining its availability and quality for future generations (Patode et al. Citation2017; Yin et al. Citation2023a; Yin et al. Citation2023b). Moreover, raising awareness about the importance of groundwater and promoting responsible practices can contribute to its long-term sustainability (Pande and Moharir Citation2021; Yuan et al. Citation2023).
The overexploitation of groundwater in India has become a significant problem in recent years. The escalating demand for water, determined by people’s growth, urbanization and financial development, has led to excessive groundwater extraction. As a result, the water table is rapidly declining, contributing to a severe water crisis in numerous areas of the country (Srinivas et al. Citation2015; Boretti and Rosa Citation2019). The overexploitation of groundwater resources has caused various challenges. One consequence is the alarming rise in salinity levels, making the water unsuitable for human use and irrigation (Pande and Moharir Citation2021). This negatively affects community’s dependent on agriculture and jeopardizes food security.
Additionally, aquifer depletion has caused land subsidence in certain areas, damaging infrastructure, buildings and agricultural land. Subsidence occurs when underground layers compress due to water extraction, resulting in the sinking and uneven settling of the land surface. This affects structures and infrastructure and disrupts natural drainage, increasing the risk of flooding (Chakraborty et al. Citation2022; Patil et al. Citation2022). The depletion of groundwater resources has wide-ranging implications for food security, livelihoods and a country’s economy. It is crucial to address this issue promptly and collectively. Urgent actions are required to tackle the overexploitation of groundwater (Zhu et al. Citation2022). Implementing sustainable water management practices is crucial in mitigating this crisis. This includes promoting water conservation, enhancing irrigation efficiency and initiating groundwater recharge projects (Gao et al. Citation2021; Gong et al. Citation2023).
Furthermore, embracing innovative technologies and policies, coupled with effective governance and community involvement, can add to the ecological development of groundwater resources. Striking a balance between water demand and availability is essential to alleviate the pressures on groundwater and ensure its long-term sustainability. These measures will secure water availability for current and upcoming generations and help minimize the adverse impacts on the environment and socio-economic well-being (Pande, Moharir, Panneerselvam, et al. Citation2021; Pande, Moharir, and Khadri Citation2021). According to the central groundwater board information on Dynamic Groundwater Resources of India, the country experiences yearly groundwater restores of approximately 437.60 billion cubic meters (BCM). In contrast, the yearly groundwater withdrawal amounts to 239.16 BCM nationwide (Pande, Moharir, and Khadri Citation2021). The report reveals that out of the total recharge-worthy area of 24.69 sq. km in the country, approximately 17% or 4.30 sq. km are classified as 'Overexploited', 3% or 0.77 sq. km as 'Critical’, 12% or 3.03 sq. km as 'Semi-Critical’. In comparison, 66% or 16.18 sq. km are categorized as 'Safe.'
Additionally, 2% or 0.4 sq. km are identified as the 'Saline’ category (DGWRI Citation2021). A report published by the World Bank has warned of potential water stress in India by 2025 and water scarcity by 2050 unless appropriate actions are taken (The World Bank Citation2022). This highlights the urgent need to comprehensively understand all freshwater resources, particularly the groundwater resource, which plays a vital role in India’s overall water availability. The findings of these reports emphasize the critical importance of effectively managing and conserving groundwater resources. Implementing sustainable groundwater management practices, such as regulating groundwater extraction, promoting water-efficient technologies and implementing recharge initiatives, are imperative to guarantee the long-term sustainability of this energy resource. Policymakers, researchers and communities must work together to address the challenges associated with groundwater overexploitation and promote responsible water resource management to safeguard freshwater availability for future generations.
Conventional techniques for identifying, demarcating, and mapping groundwater potential zones often rely on costly ground-based surveys involving geophysical, geological and hydrogeological tools. In contrast, geospatial tools offer a cost-effective and efficient alternative by generating and simulating valuable data in various geoscience disciplines (Mobasheri et al. Citation2020). A comprehensive evaluation of the literature reveals that research fellows have employed numerous techniques to recognize and create the groundwater potential zones map (Ozdemir Citation2011; Razandi et al. Citation2015), decision tree (Chenini and Ben Mammou Citation2010), multi-criteria decision analysis (Choudhary et al. Citation2022; Goswami and Ghosal Citation2022), artificial neural network (Nguyen et al. Citation2020), weights of evidence (Lee et al. Citation2012), logistic regression (Rizeei et al. Citation2019), certainty factor (Guru et al. Citation2017), evidential belief function (Mogaji et al. Citation2015), and machine learning algorithms like random forest (RF) (Rahmati et al. Citation2016), K-Means (Marín Celestino et al. Citation2018) and maximum entropy (ME) (Salvacion Citation2022), among others. Remote sensing and GIS methods have emerged as powerful tools for rapidly estimating natural resources, especially groundwater potential zones (Ravichandran et al. Citation2022). This cost-effective approach provides valuable information for groundwater exploration before resorting to extra detailed and expensive measuring techniques (Bhadran et al. Citation2022; Khan et al. Citation2022a). Numerous studies have been conducted worldwide to support the use of Remote Sensing (RS) and GIS for mapping groundwater potential zones (Arulbalaji et al. Citation2019; Maity et al. Citation2022; Khan et al. Citation2022b, Citation2023a, Citationb).
The current study employs a combined approach of AHP and GIS methods to effectively demarcate groundwater potential zones. These methods offer enhanced efficiency and accuracy in mapping these zones, critical for ecological groundwater management (Pande, Moharir, and Khadri Citation2021; Yahiaoui et al. Citation2021; Choudhary et al. Citation2022). Integrating multiple criteria like soil, Land Use and Land Cover (LULC), slope, etc., the AHP method identifies the most influential features for groundwater potential (Arulbalaji et al. Citation2019; Zhao et al.Citation 2020). Complementing this, the GIS technique provides a spatial framework for data analysis and visualization, facilitating the characterization of groundwater potential zones (Bhadran et al. Citation2022). By adopting this approach, the accuracy and reliability of groundwater potential mapping can be significantly improved, providing valuable insights for decision-making in water resource management. To ensure the accuracy of the output, the outcomes were cross-validated. This involved comparing the generated groundwater potential zones with known data on groundwater prospects in the study area. By assessing the consistency and agreement between the mapped zones and the actual conditions on the ground, the methodology’s accuracy and the results’ reliability were evaluated. Cross-validation is a crucial step in the research process as it helps validate the accuracy and effectiveness of the mapping approach. It provides confidence in the reliability of the results and enhances the credibility of the findings. By verifying the output against real-world data, any discrepancies or inconsistencies can be identified and addressed, leading to a more robust and precise calculation of the groundwater potential zones in the area. The aim of groundwater potential zone maps can be prepared for basaltic rock areas based on satellite data, GIS, and AHP methods. The main objectives of this research are, (1) to collect and prepare the thematic maps from satellite data with the references of field data points, (2) to measure and assign the weights of each thematic layer, and (3) to prepare the groundwater potential zone map using GIS and AHP methods. The final groundwater potential zone map was validate with water yield data based on the ROC method. The results of study area can be very helpful to development groundwater resources in the basaltic hard rock aquifer.
2. Materials and methods
2.1. Study area
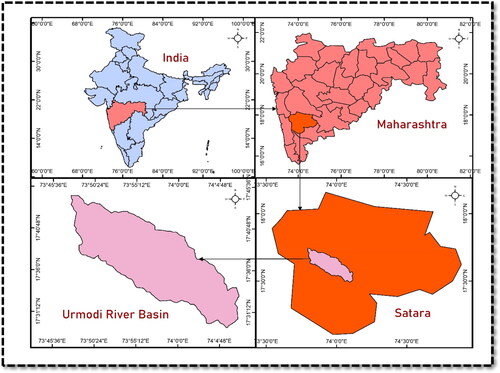
The Urmodi River basin is located in the Western Ghats of Maharashtra state, India, covering an area of approximately 407.32 km2. It is bounded by latitudes 17.47′ N to 17° 74′ N and longitudes 73° 79′ E to 74° 09′ E (). Situated within the Western Ghats, it is a region of high biodiversity. The Urmodi River basin holds significant geographical importance as a major tributary of the Krishna River basin, India’s fifth-largest river basin (Moharir et al. Citation2023). Spanning 407.35 km2, it is a biodiverse region within the Western Ghats of India. The basin sources from the Amboli hills in the Western Ghats and follows a south-easterly course for about 88 km, eventually joining the Krishna River near Karad. The basin primarily exhibits a hilly terrain with altitudes ranging from 587 to 1255 m above mean sea level (Pande Citation2020a). The basin experiences a distinct climate pattern, characterized by a monsoon season from June to September, a post-monsoon season from October to November, and a dry season from December to May. The average annual rainfall in the basin is recorded at 1247 mm.
Figure 1. Location map of study area.
2.2. Data collection and pre-processing
This study employed advanced geospatial techniques to create suitable groundwater zones in the area. A knowledge-based factor analysis approach was utilized, incorporating eight distinct layers of information: geomorphology, drainage density, lineaments, slope, geology, LULC, and elevation. Various software tools were employed to facilitate the analysis, including ERDAS Imagine 11.0, Geomatica 2018, and Arc GIS 10.5. The basin boundary was accurately delineated using high-resolution data from SRTM (Shuttle Radar Topography Mission) and Survey of India topo-sheets at a scale of 1:50,000. Sentinel-2A satellite imagery with a spatial resolution of 10 meters was utilized to prepare the thematic maps. Expert visual interpretation was employed through a supervised image classification technique, aided by the National Remote Sensing Centre (NRSC), to describe the LULC and geomorphology characteristics within satellite imagery.
Furthermore, the digital elevation data resulting from radar datasets with a resolution of 30 meters facilitated the generation of elevation and slope layers for the study area. The drainage network data was found from SRTM, while lineament data was clipped from Indian remote sensing (IRS) LISS-III data, both utilizing instinctive clipping methods. The spatial analyst tool within the GIS software was utilized to quantify the density of the drainage network and lineament features. The Geological Survey of India also provided a published geological map, which was digitized for integration into the study. Utilizing these advanced geospatial techniques, alongside RS data and GIS methods, allows for a complete and precise calculation of groundwater potential zones in the basin. The water yield data collected from 50 observation wells is used to cross-validate the groundwater potential zone map using the ROC method. By incorporating multiple layers of information, the study aimed to provide valuable insights for sustainable groundwater management and decision-making processes in the area. Integrating high-resolution satellite imagery, digital elevation models, and geological data adds depth and precision to the findings, enabling a well-considered assessment of the groundwater resources within the basin.
2.3. Multi-criteria decision analysis using AHP and GIS methods
The study employed the AHP, proposed by Saaty in 1980, as a crucial component in determining the weights for every thematic map used in the analysis (Gautam et al. Citation2023). AHP is a broadly recognized and utilized process for multi-criteria decision-making in groundwater and environmental studies (Shelar et al. Citation2022). By applying AHP, a matrix of pairwise comparisons was constructed, and scores were assigned to each layer on a scale typically ranging from 1 (equal importance) to 9 (extreme importance) (Wollmann et al. Citation2013). provides the Saaty scale of relative importance, which guided the scoring process. The pairwise comparison matrix was generated for eight maps examined for this study. The eigenvector technique was employed to determine the normalized weights of the separate maps. The AHP model employed the maximum eigenvalue in the normalized eigenvalue matrix to assign weights to every thematic map. The flow chart of a procedure for mapping potential zones is depicted in . To ensure the reliability of the judgments made during the pairwise comparison process, the consistency ratio (CR) was computed. The CR should ideally not exceed 0.1 to maintain consistency. If the CR exceeds this threshold, it is recommended to re-evaluate the pairwise comparison process (Pant et al. Citation2022). This study’s calculated consistency ratio for the eight layers (n = 8) was 0.05, lower than 0.10 ( and ). This indicates that the weight valuation process was reliable. The assigned weights for each thematic layer were determined through expert suggestions and references to relevant literature. These weights represent the effect of each layer on the groundwater potential zones. and provide the assigned weights and influences for each layer, offering valuable insights into the relative importance of different factors in delineating groundwater potential zones in the Urmodi River basin. By employing the AHP methodology and assessing the consistency ratio, this study ensured a robust and reliable determination of weights for the thematic layers. These weights are vital in accurately mapping groundwater potential zones, enabling effective resource management and planning decision-making. The AHP approach enhances the overall quality and validity of the results, providing a comprehensive understanding of the factors of groundwater potential in the area.
Figure 2. Flow chart of methedology used for groundwater potential zones mapping.
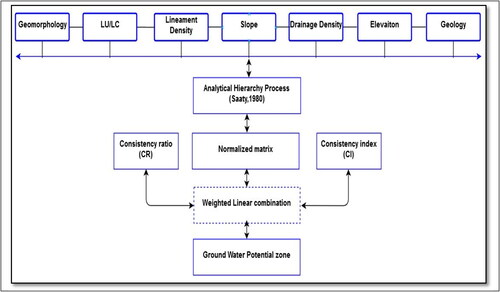
Table 1. Saaty’s rating scale.
Table 2. AHP matrix for groundwater potential zone delineation.
Table 3. Normalized matrix.
Table 4. Parameters (AHP) to check consistency of the matrix.
Table 5. List of parameters and AHP ratings and weights.
The utilization of the Analytic Hierarchy Process (AHP) in the context of groundwater potential zone mapping serves several critical purposes that enhance the accuracy and reliability of the study: Groundwater potential zone mapping involves a multitude of influencing factors, such as geological, hydrogeological, topographical and land-use attributes. AHP enables the structured evaluation and comparison of these diverse criteria by assigning relative weights to each factor based on their significance. This ensures a comprehensive consideration of all relevant aspects, leading to a more holistic groundwater potential assessment. AHP facilitates ranking influencing factors according to their relative importance in groundwater potential determination. By assigning appropriate weights, AHP helps identify which factors significantly impact groundwater occurrence and flow. This prioritization aids in focusing resources and efforts on the most critical aspects, improving the accuracy of potential zone delineation.
2.4. AHP and weighted methods
AHP is a decision-making technique that permits the prioritization and selection of replacements using a set of criteria.
In the background of groundwater suitable mapping, the weighted method assigns weights to various thematic layers representing factors such as geology, geomorphology, land use, slope, etc. These weights reflect the importance or influence of each factor in determining groundwater potential. A weighted sum or index is obtained by multiplying the weights with the corresponding values or scores of each factor, representing the overall groundwater potential at a given location. This allows for comparing and classifying different areas based on their potential for groundwater availability. The combination of AHP and the weighted method provides a systematic and structured approach for mapping groundwater potential zones (). It enables the integration of multiple criteria or factors, considers their relative importance, and generates a comprehensive assessment of groundwater potential across the study area. This approach improves decision-making in groundwater management, facilitates resource allocation, and assists in sustainable development and planning initiatives.
2.5. Validation of groundwater potential zone map
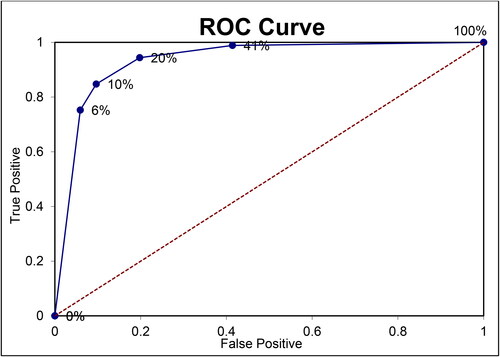
A total of 50 observation wells were utilized to assess the accuracy of the groundwater potential map. The study aimed to compare the accuracy of the AHP-based Groundwater Potential Zones (GWPZ) map using Receiver Operating Characteristic (ROC) curve. The ROC analysis, a widely used technique, aids in evaluating the effectiveness of different methods for groundwater suitability zone mapping (Pourtaghi and Pourghasemi Citation2014).
The ROC plot, ranging from 0.5 to 1.0, represents the true positive (sensitivity) and false positive (1-specificity) rates. A key metric in this analysis is the Area Under the Curve (AUC), with a value of 0.5 indicating a model that does not effectively assess groundwater zones. The AUC measures the model’s discriminatory power, with higher values indicating better accuracy (Pande, Moharir, and Khadri Citation2021). The well observation locations were superimposed onto the groundwater potential map. The accuracy of the map was assessed by comparing the observed and predicted outcomes. This evaluation followed a specific equation (Eq. 1) established in previous studies focused on groundwater potential assessment in river areas.
By employing the ROC methodology and comparing observed data with predictions, the study provides valuable insights into the accuracy and reliability of the AHP-based GWPZ map, contributing to improved decision-making in groundwater resource management.
3. Results and discussion
The combination of AHP, RS and GIS techniques proves an effective groundwater zone mapping method. The multi-criteria evaluation provided by AHP enables the incorporation of diverse factors influencing groundwater occurrence, while RS and GIS facilitate spatial examination and visualization of results. The findings of this research add to informed decision-making and sustainable utilization of groundwater resources (Pande, Moharir, and Khadri Citation2021). The results distinct groundwater areas within the basin, highlighting areas with higher, moderate and low potential. These maps provide valuable information for decision-makers, hydrogeologists, and water resource managers to identify suitable locations for groundwater extraction, prioritize recharge strategies, and implement sustainable water management practices. The collective usage of AHP, RS and GIS methods offers a powerful toolset for mapping groundwater zones and unlocking their hidden potential. The generated maps aid in classifying parts with higher groundwater potential, enabling better management and allocation of this vital resource. By implementing the discoveries of this examination, policymakers can work towards sustainable groundwater management, ensuring its availability for future generations.
3.1. Geomorphology
Geomorphology plays a crucial role in assessing areas with significant groundwater potential due to its capability to provide insights into the topography and landforms of a given area (). It offers valuable information regarding the distribution of landform features and processes, including temperature variations, water flow patterns, geo-chemical reactions, as well as thawing and freezing dynamics (Grozavu Citation2017). The geomorphic characteristics are primarily characterized by low dissected structural hills and valleys, moderately dissected denudational upper plateau, moderately dissected structural upper plateau, and a pediment pediplain complex. These features contribute to understanding the landscape and its potential for groundwater resources. illustrates the geomorphology of the Urmodi River basin. The Pediment Pediplain complex is the prominent landform in the area, which is identified by a mildly sloping erosion surface dissected by several shallow valleys or channels. This complex comprises two parts—the pediment, a gently sloping surface at the foot of a mountain or range, and the pediplain, the relatively flat area extending from the pediment towards the basin or valley floor. Due to the characteristics of this feature, it has been assigned a high weight in the analysis. The structural upper plateau, which is moderately dissected by valleys or channels, is the area’s second most prominent geomorphic feature. It is characterized by a comparatively flat top surface formed due to structural activities such as faulting and folding. Because of the distinctive nature of this feature, it was assigned the second-highest weight in the analysis ().
Figure 3. Geomorphology map of study area.
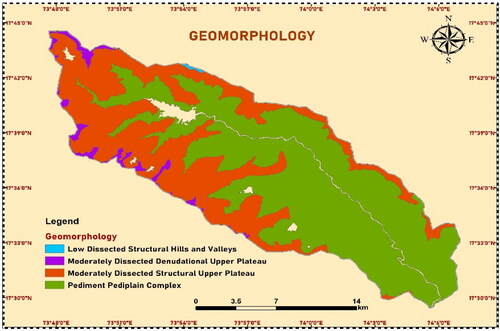
The research area includes some regions characterized by low dissected structural hills and valleys and others that exhibit moderately dissected denudational upper plateau. The former refers to areas shaped by structural activities, such as faulting and folding, resulting in the formation of hills and valleys with relatively shallow slopes. On the other hand, the latter refers to regions that have experienced more extensive erosion due to natural forces such as weathering and erosion, resulting in the formation of a relatively flat plateau that is moderately dissected by valleys or channels. The low dissected structural hills and valleys and moderately dissected denudational upper plateau, though present in the study area, were given relatively low weightage in the analysis. These landforms have a relatively lower potential for groundwater storage than the Pediment Pediplain complex and moderately dissected structural upper plateau. Nonetheless, these landforms are an essential factor in the overall hydrology in the area and should not be overlooked (Anusha et al. Citation2022; Badapalli et al. Citation2022).
3.2. Land use/land cover
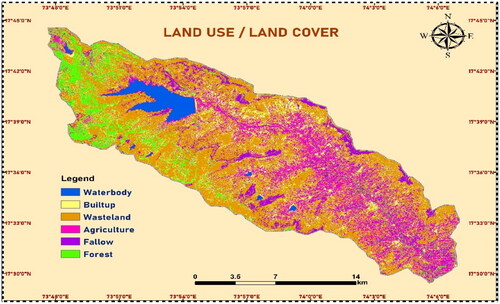
Its results play a crucial role in various aspects such as groundwater, soil moisture, infiltration, surface water, and identifying groundwater requirements (Khadri Citation2013; Mohamed and Worku Citation2020; Kumar et al. Citation2022; Pande et al. Citation2022; Kumar et al. Citation2023). In the Urmodi river basin, the LULC categories comprise agricultural land, fallow land, forests, settlements, wasteland, and water bodies. The LULC types were identified using Sentinel 2A satellite data. displays the LULC map of the Urmodi River basin. This area is semi-urban, with 30% agricultural land, 36% wasteland, 8% water bodies, 6% fallow land, and the remaining 12% settlements and 8% forest regions. The highland areas are mainly covered with evergreen forests, whereas the midland areas are primarily characterized by agricultural lands with little parts of fallow lands. The low land areas are predominantly working by built-up areas and agricultural lands. The water content in LULC classes such as forest and agricultural land is considerably higher compared to settlements and wastelands. Therefore, a high weight was assigned to forests, agricultural land, and water bodies in the analysis. Conversely, the weight assigned to settlement areas and wastelands was relatively low ().
Figure 4. Land use/land cover map of study area.
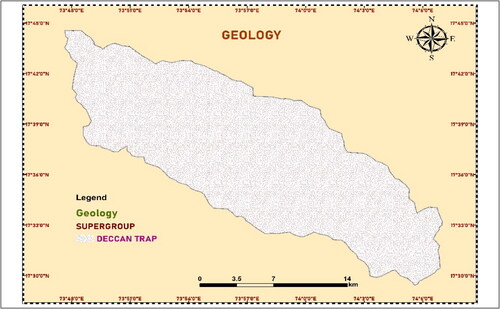
3.3. Geology
Geology plays an important role in groundwater occurrence, movement and storage. Different rock types and geologic structures have different permeabilities and porosities, which determine how easily water can flow through them and how much water they can hold (Lee et al. Citation2012). Therefore, understanding the geology of an area is important in identifying potential groundwater sources and in managing and protecting existing groundwater resources. In this study, the available geological map from the Geological Survey of India was utilized to identify and demarcate the various geological units present in the study area. The geology layer of the study area is presented in . The study area is predominantly covered by Deccan traps, with only a thin layer of soil covering it, which is a result of weathering of the traps. The behavior of groundwater in the Deccan traps is influenced by numerous parameters such as lithology, the extent of weathering, and the type and intensity of fractures and faults (Rai et al. Citation2011). This factor plays a vital part in the movement and accumulation of groundwater in Deccan traps.
Figure 5. Geology map of study area.
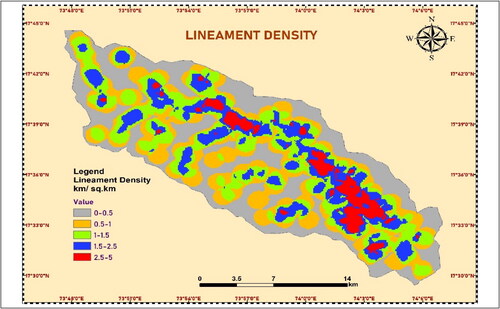
3.4. Lineament density
Geological lineaments refer to surface expressions of underlying geological structures, such as faults and fractures, which may exhibit either noticeable displacement or insignificant fracture displacement. Lineaments characterized by their straight alignments in satellite imagery. These lineaments contribute to the development of secondary porosity and permeability, which are crucial for groundwater flow (Choudhary et al. Citation2022). In this research, lineaments were identified using an automated method that utilized IRS LISS-III satellite data. The resulting lineament density map was generated in Arc GIS10.5 software (). To analyze lineament density data, it was categorized into five categories, namely very low, low, moderate, high, and very high. These categories were defined based on specific ranges of lineament density values, such as very low very low (0–0.5 km/km2), low (0.6–1.0 km/km2), moderate (1.1–1.5 km/km2), high (1.6–2.5 km/km2) and very high (2.6–5.0 km/km2). Effect these adjustments in and also in . The map illustrates that the lineaments were found in higher density along drainage systems, suggesting a potential correlation. Regions characterized by a high density of lineaments indicate the presence of permeable areas, thus indicating the likelihood of favorable groundwater potential zones. The proximity of lineaments was considered in assigning ranks to the lineament density, with the understanding that as the distance from lineaments increases, the groundwater potential tends to decrease (Arulbalaji et al. Citation2019). So, high weights were allotted to areas with high-density lineaments, while lower weights were assumed to regions with low-density lineaments. This weighting approach aimed to reflect the association between lineament density and groundwater potential zones.
Figure 6. Lineament density map of study area.
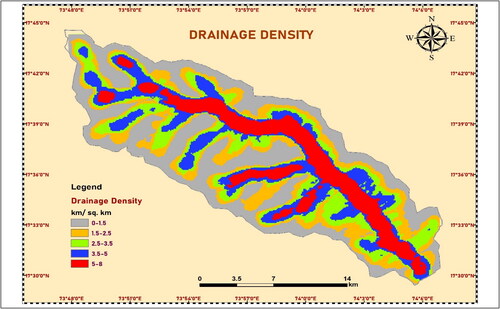
3.5. Drainage density
A drainage network is a critical factor that significantly influences both the availability and contamination of groundwater. It is primarily shaped by the types of rock formations present in an area, which in turn affect the rate of water penetration into the ground (Nag and Chakraborty Citation2003). Drainage density, the well-defined sum of the length of rivers within a drainage area separated by the whole area of the basin, serves as a significant indicator for recognizing potential zones of groundwater. It is inversely related to permeability, making it a key parameter in groundwater potential assessment (Rizeei et al. Citation2019). Higher drainage density implies a lower rate of infiltration, which is unfavorable for groundwater potential. Conversely, low drainage density indicates a higher infiltration rate, contributing to a greater potential for groundwater availability (Chenini and Ben Mammou Citation2010). The drainage density data was classified into five categories based on the obtained values: very low (0–1.5 km/km2), low (1.6–2.5 km/km2), moderate (2.6–3.5 km/km2), high (3.6–5 km/km2) and very high (5–8 km/km2) (). In the delineation of groundwater potential zones, areas with low drainage density are assigned the highest weight, while expanses with higher drainage density are allocated a lower weight. This weighting approach recognizes the inverse association between drainage density and groundwater potential, emphasizing the significance of regions with lower drainage density for groundwater resource identification and management.
Figure 7. Drainage density map of study area.
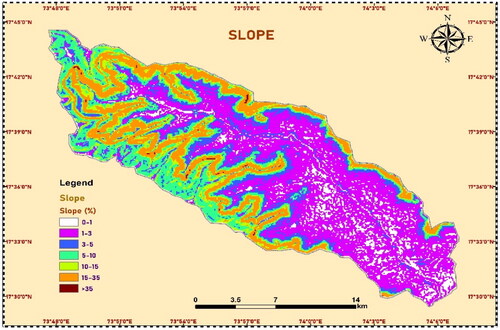
3.6. Slope
It is topography that is a crucial influence in considering the characteristics of the land surface. It provides valuable information about the geological and geodynamic processes that shape the land at a regional scale. This has an important effect on surface runoff and the rate of infiltration. It can also provide valuable insights into the overall direction of groundwater flow. Steep slopes tend to result in less recharge, as water from precipitation runs off rapidly down the slope during precipitation. This leads to an insufficient habitation period for water to penetrate and recharge the groundwater system (Akhtar et al. Citation2020). Although the presence of a flat slope in the region may result in increased infiltration compared to the steep slope, the study area has been divided into five distinct slope classes for classification purposes, ranging from flat to very steep, based on their percentage gradient. Flat (0–1%), gentle (1–3%), undulating (3–5%), moderately steep (5–10%), steep (10–15%), strongly Steep (15-35%) and very Steep (>35%). This slope values is shown in . The flatter slopes have a higher weight assigned to them due to the fact that regions characterized by flatter slopes possess a propensity for retaining precipitation and promoting the replenishment of groundwater resources (Tolche Citation2021)., while the steeper slopes have a lower weight assigned to them (). This classification helps in identifying zones, where groundwater potential is likely to be higher or lower based on the slope characteristics.
Figure 8. Slope map of study area.
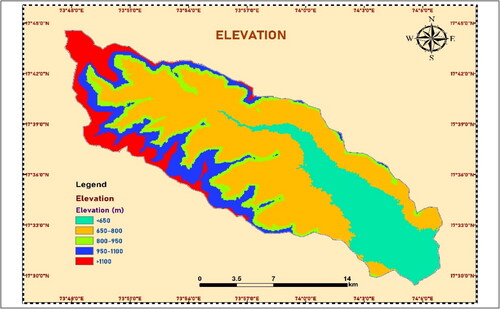
3.7. Elevation
The elevation of a region is a crucial factor that indicates the ruggedness of the terrain, and it has a significant impact on identifying potential groundwater zones. Regions with lower elevations tend to hold water for longer periods, allowing for greater infiltration of recharge water and less runoff during rainfall events with lower evapotranspiration rates. Conversely, areas with higher elevations tend to retain rainwater for shorter periods, resulting in greater runoff (El Jazouli et al. Citation2019). The elevation layer of the study area is illustrated in . The study basin exhibits relief ranging from 587 to 1255 m, and the elevation of the region was divided into five classes. The classes with lower elevations were given greater weights since they have a higher potential to hold water for a longer time and allow greater permeation of recharge water, leading to less runoff. Conversely, the classes with higher elevations were assigned lower weights () as they tend to retain rainwater for a shorter duration and produce more runoff.
Figure 9. Elevation map of study area.
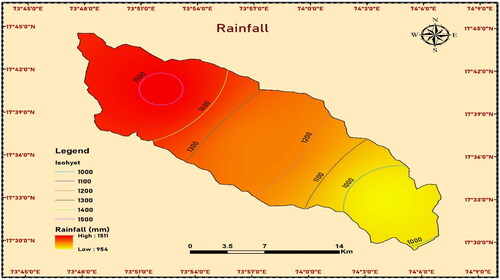
3.8. Rainfall
The analysis of rainfall data spanning from a low of 954 mm to a high of 1511 mm holds crucial insights into local precipitation patterns. This valuable information was collected and compiled from the Climate Hazards Group InfraRed Precipitation with Station (CHIRPS) dataset. Rainfall, a fundamental component of our climate system, plays a pivotal role in shaping ecosystems, agriculture, and water resources. The recorded range of rainfall, from 954 mm at its lowest to 1511 mm at its highest, signifies a considerable variability in the amount of precipitation received within the studied area (). The CHIRPS dataset, which combines satellite-derived data and ground station observations, offers a comprehensive and spatially detailed perspective on rainfall patterns. This data fusion enhances our understanding of local and regional precipitation dynamics, contributing to more accurate assessments of climate trends and variability.
Figure 10. Rainfall map of study area.
3.9. Groundwater potential zones (GWPZ)
Groundwater is an essential resource that can be filled over time, but human actions and growth have significantly reduced its recharge rate in the last few decades (Pande Citation2023). It is crucial to have a perfectly consideration of groundwater suitable for the area to facilitate sustainable progress (Moharir et al. Citation2023). This result is essential in scheming and applying structures that can help improve groundwater recharge processes (Trivedi et al. Citation2023). The reduction of groundwater resources can have severe consequences on the atmosphere and the economy. Therefore, efforts must be made to monitor, conserve and manage groundwater resources sustainably (Kumari et al. Citation2023). In the Arc GIS 10.5 environment, eight layers that affect the storage of groundwater were developed, and a weighted overlay analysis tool was used to overlay these layers. The resulting map shows the groundwater potential zones for the Urmodi River basin, which is divided into four classes ranging from poor to excellent groundwater potential zones (). After conducting the analysis, it was discovered that a total of 92.45 km2, which is equivalent to 22.69% of the basin area, has excellent potential for groundwater. The largest portion of the basin, which is 28.96% or 118.32 km2, falls under the good potential for groundwater category. On the other hand, about 25.32% or 103.16 km2 of the basin has moderate potential, while 22.92% or 93.39 km2 is categorized as having poor potential for water suitable zones (). The categorization of groundwater potential zones provides valuable insights for sustainable groundwater resource management and utilization in the Urmodi River Basin.
Figure 11. Gound water potential zones of study area.
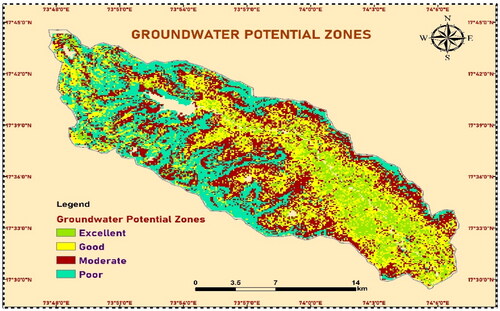
Table 6. Categories of groundwater potential zone.
The areas with flat slopes, low elevation, low drainage density, high lineament density, and mostly consisting of forest and agricultural lands in pediplanis were found to have excellent groundwater potential in the Urmodi river basin. This zones was situated in the lower influences of the basin and around the Urmodi River. These areas have a higher potential for groundwater recharge due to their favorable hydrogeological conditions, which allow water to infiltrate and recharge the aquifers more easily. The presence of forests and agricultural lands in these areas also contributes to groundwater recharge by reducing surface runoff and increasing soil moisture. The areas classified as poor and moderate groundwater potential zones were identified to be situated in the highlands characterized by steep slopes, high drainage density, and low lineament density. These areas are typically associated with structural hills and valleys and are dominated by barren land cover. The areas classified as good groundwater potential zone were situated between the areas identified as having moderate and excellent groundwater potential. These areas were characterized by moderate hydrogeological properties, which means that they had moderate permeability, slope, elevation, drainage density, lineament density and land cover. In terms of groundwater recharge and availability, these areas were better than the ones classified as moderate or poor.
The groundwater potential zone mapping in the Urmodi river basin is a valuable tool for planning and managing the sustainable use of groundwater resources in the region. It provides important information for implementing appropriate strategies for groundwater recharge in areas with poor and moderate potential and identifying areas where drilling of wells for domestic, industrial, and agricultural purposes can be done with a high probability of success. The information obtained from this study can be utilized by government agencies, local authorities, and other stakeholders to plan and implement sustainable groundwater management practices in the Urmodi River basin. The identified groundwater potential zones in the Urmodi River basin were subjected to verification by analyzing data from 50 observation wells strategically located throughout the study area. The analysis focused on the water yield capacity of these wells as an indicator of groundwater potential. The results showed that wells situated in the moderate and poor groundwater potential zones exhibited a water yield capacity ranging from 10 to 40 liters per minute (LPM). In contrast, wells located in the good groundwater potential zones demonstrated a higher water yield capacity, ranging from 40 to 80 LPM. Wells situated in the excellent groundwater potential zones displayed an even more substantial yield capacity, ranging from 80 to 150 LPM. The locations of these observation wells used for validation can be observed in . Out of the 50 wells, 42 wells aligned well with the assigned groundwater potential zone categories in the Urmodi river basin. However, 8 wells did not fully correspond to their respective designated potential zones.
Figure 12. Location of observation wells used for validation.
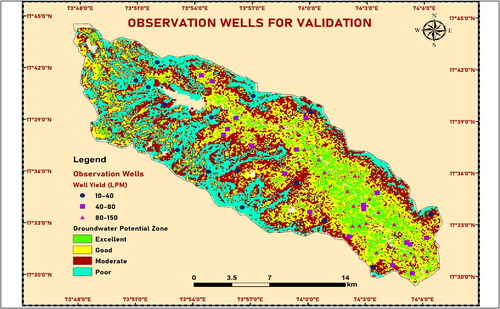
This deviation was primarily attributed to the proximity of these wells to densely populated areas or intensive agricultural regions, where groundwater exploitation tends to be high. Intriguingly, even though these eight wells were situated in high-potential zones, eight of them exhibited low-yielding characteristics. Further analysis revealed that 16 wells demonstrated a water yield capacity of 80–150 LPM, while 19 wells yielded 40–80 LPM (). The remaining wells exhibited a relatively lower water yield of 10–40 LPM. The accuracy of the groundwater potential zone mapping in the Urmodi River basin was estimated to be approximately 84% based on ROC. The AHP technique, known for its ability to handle complex decision-making scenarios, was utilized to prioritize and weigh various influencing factors contributing to groundwater potential. These factors encompassed hydrogeological, topographical, and geological parameters, among others. Upon integration of the AHP-derived weights, a groundwater potential zones map was generated. To rigorously assess its accuracy, the map was validated against actual well yield data. The Receiver Operating Characteristic (ROC) curve was employed to evaluate the model’s performance. Remarkably, the AHP-based map exhibited an impressive accuracy rate of 84%, indicating a robust correlation between the predicted potential zones and observed well yield data (). The estimated the Random Index is 1.41 for n = 8. This level of accuracy is consistent with findings from comparable studies (Jhariya et al. Citation2021; Rajasekhar et al. Citation2022; Senapati and Das Citation2022), emphasizing the reliability of the methodology employed in this study for identifying potential zones for groundwater recharge and extraction in the basin. The high accuracy of the mapping results underscores their value in planning and managing groundwater resources in the region. The cross-validation of the groundwater potential zones with the data from observation wells demonstrates the reliability and practicality of the zoning approach, which can significantly contribute to the sustainable management of groundwater in the Urmodi river basin.
Figure 13. Groundwater potential zones map validated with well yield data of AHP techniques using ROC curve.
The present study innovatively combined the analytic hierarchy process (AHP) and geographic information system (GIS) techniques to assess and categorize potential groundwater zones within the basaltic hard rock area. This methodology has been employed previously in remote sensing and GIS studies for mapping groundwater potential zones in arid areas (Rahmati et al. Citation2015). These prior investigations, like our study, integrated diverse thematic layers—such as geology, geomorphology, soil characteristics, drainage density, and rainfall data—to construct accurate groundwater potential map. The delineation of groundwater potential zones across the Habawnah Basin, encompassing a spectrum from very low to very high potential areas, is consistent with spatial patterns observed in other research (Pande, Moharir, and Khadri Citation2021; Shebl et al. Citation2022). To ensure the reliability of our groundwater potential map, a validation process was conducted by comparing it against the locations of existing wells within the study area. This validation approach is widely recognized in earlier studies (Naghibi et al. Citation2016). By adopting a comprehensive approach that combines AHP and GIS techniques, our study contributes valuable insights into identifying groundwater potential zones in semi-arid context. The distinctiveness of this approach lies in its ability to integrate diverse spatial data layers, leading to a more accurate depiction of groundwater potential across the study area.
4. Conclusion
This research aimed to assess the groundwater potential zones in the basin area, situated in the western Western Ghats region in central India. To achieve this objective, eight thematic layers were analyzed. A comprehensive understanding of the groundwater potential was obtained by integrating and evaluating these layers. The findings revealed that the Urmodi River basin possesses substantial potential for sustainable groundwater utilization. Most of the basin fell into the good and moderate categories, indicating favorable conditions for groundwater availability. The results indicated that approximately 22.69% of the basin had excellent groundwater potential, 28.96% had good potential, 25.32% had moderate potential, and 22.92% had poor potential. These findings suggest that a significant portion of the Urmodi Basin exhibits favorable groundwater potential, providing promising opportunities for sustainable groundwater utilization. To confirm the outcomes’ dependability, the methodology’s accuracy was verified by comparing them with the known groundwater prospects in the area. The overall accuracy of the method was found to be approximately 84%, highlighting its effectiveness in assessing groundwater potential. The findings of this study have substantial implications for decision-makers engaged in the strategic planning and effective management of groundwater resources, particularly for urban and agricultural purposes. Considering the substantial agricultural coverage in the study area, the results can enhance irrigation facilities and improve agricultural productivity. This study showcases the efficiency and expediency of GIS-based investigations in providing crucial insights into groundwater resources and their potential for further development. Integrating GIS and AHP techniques facilitates a comprehensive evaluation of multiple factors, enabling effective decision-making and resource management. Assessing groundwater potential in specific regions is of utmost importance; however, additional research shall be conducted to ensure its reliability. Furthermore, it is essential to examine the quality of groundwater and its appropriateness for various purposes, including drinking, agriculture, and industrial activities. The potential of groundwater resources is significantly influenced by groundwater recharge. Consequently, conducting a quantitative analysis of groundwater recharge in future studies is advisable, as it will provide empirical evidence regarding the groundwater potential in a given area.
Authors’ contributions
Rahul S. Shelar: Conceptualization, Idea of topic, Formal Analysis, Validation, Data Interpretations, Methodology, Software, results and analysis, Creation and Interactive visualization of figures and methodology chart, writing – original draft, Writing – review & editing etc. Chaitanya B. Pande: Formal analysis, Conceptualization, Methodology, Validation, Idea of topic, Formal Analysis, Validation, results and analysis, writing – original draft and Writing review & editing. Sachin B. Nandgude: Writing review & editing, Supervision, Conceptualization, Idea of topic, Formal Analysis. Romulus Costache: Formal Analysis, Visualization, Writing -review & editing. Gamal A. El-Hiti: Writing -review & editing, Abebe Debele Tolche: Formal Analysis, Writing -review & editing, Cao Truong Son: Writing -review & editing, Krishna Kumar Yadav: Writing -review & editing.
Acknowledgment
This work received support from the Researchers Supporting Project (number RSP2023R404), King Saud University, Riyadh, Saudi Arabia.
Disclosure statement
This manuscript has not been published or presented elsewhere in part or entirety and is not under consideration by another journal. There are no conflicts of interest to declare.
Availability of data and materials
The data that support the findings of this study are available from the corresponding author, upon reasonable request.
References
- Akhtar N, Izzuddin Syakir M, Talha Anees M, et al. 2020. Characteristics and assessment of groundwater. United Kingdom: IntechOpen. doi: 10.5772/intechopen.93800.
- Anusha BN, Babu KR, Kumar BP, Kumar PR, Rajasekhar M. 2022. Geospatial approaches for monitoring and mapping of water resources in semi-arid regions of Southern India. Environ Chall. 8:100569. doi: 10.1016/j.envc.2022.100569.
- Arulbalaji P, Padmalal D, Sreelash K. 2019. GIS and AHP techniques based delineation of groundwater potential zones: a case study from Southern Western Ghats, India. Sci Rep. 9(2082). doi: 10.1038/s41598-019-38567-x.
- Badapalli PK, Nakkala AB, Kottala RB, Gugulothu S. 2022. Geo environmental green growth towards sustainable development in semi-arid regions using physicochemical and geospatial approaches. Environ Sci Pollut Res. doi: 10.1007/s11356-022-24588-z.
- Bhadran A, Girishbai D, Jesiya NP, Gopinath G, Krishnan RG, Vijesh VK. 2022. A GIS based fuzzy-AHP for delineating groundwater potential zones in tropical river basin, southern part of India. Geosyst Geoenviron. 1(4):100093. doi: 10.1016/j.geogeo.2022.100093.
- Boretti A, Rosa L. 2019. Reassessing the projections of the World Water Development Report. NPJ Clean Water. 2(15). doi: 10.1038/s41545-019-0039-9.
- Chakraborty B, Roy S, Bera B, Adhikary PP, Bhattacharjee S, Sengupta D, Shit PK. 2022. Evaluation of groundwater quality and its impact on human health: a case study from Chotanagpur plateau fringe region in India. Appl Water Sci. 12(25). doi: 10.1007/s13201-021-01539-6.
- Chenini I, Ben Mammou A. 2010. Groundwater recharge study in arid region: an approach using GIS techniques and numerical modeling. Comput Geosci. 36(6):801–817. doi: 10.1016/j.cageo.2009.06.014.
- Choudhary S, Pingale SM, Khare D. 2022. Delineation of groundwater potential zones of upper Godavari sub-basin of India using bi-variate, MCDM and advanced machine learning algorithms. Geocarto Int. 37(27):15063–15093. doi: 10.1080/10106049.2022.2093992.
- DGWRI. 2021. Dynamic ground water resources of india. central ground water board department of water resources. River Development & Ganga Rejuvenation Ministry of Jal Shakti Government of India, Faridabad.
- Dhawan V. 2017. Water and Agriculture in India Background paper for the South Asia expert panel during the Global Forum for Food and Agriculture (GFFA) 2017. German Asia-Pacific Business Association
- El Jazouli A, Barakat A, Khellouk R. 2019. GIS-multicriteria evaluation using AHP for landslide susceptibility mapping in Oum Er Rbia high basin (Morocco). Geoenviron Disasters. 6(3) doi: 10.1186/s40677-019-0119-7.
- Gao C, Hao M, Chen J, Gu C. 2021. Simulation and design of joint distribution of rainfall and tide level in Wuchengxiyu Region, China. Urban Clim. 40:101005. doi: 10.1016/j.uclim.2021.101005.
- Gautam VK, Pande CB, Kothari M, Singh PK, Agrawal A. 2023. Exploration of groundwater potential zones mapping for hard rock region in the Jakham river basin using geospatial techniques and aquifer parameters. Adv Space Res. 71(6):2892–2908. doi: 10.1016/j.asr.2022.11.022.
- Gong S, Bai X, Luo G, Li C, Wu L, Chen F, Ran C, Xi H, Zhang S. 2023. Climate change has enhanced the positive contribution of rock weathering to the major ions in riverine transport. Global Planet Change. 228:104203. doi: 10.1016/j.gloplacha.2023.104203.
- Goswami T, Ghosal S. 2022. Understanding the suitability of two MCDM techniques in mapping the groundwater potential zones of semi-arid Bankura District in eastern India. Groundw Sustain Dev. 17:100727. doi: 10.1016/j.gsd.2022.100727.
- Grozavu A. 2017. Application of AHP method for mapping slope geomorphic phenomena. In International multidisciplinary scientific GeoConference SGEM. doi: 10.5593/sgem2017/23/S11.046.
- Guru B, Seshan K, Bera S. 2017. Frequency ratio model for groundwater potential mapping and its sustainable management in cold desert, India. J King Saud Univ Sci. 29(3):333–347. doi: 10.1016/j.jksus.2016.08.003.
- Jhariya DC, Khan R, Mondal KC, Kumar T, K I, Singh VK. 2021. Assessment of groundwater potential zone using GIS-based multi-influencing factor (MIF), multi-criteria decision analysis (MCDA) and electrical resistivity survey techniques in Raipur city, Chhattisgarh, India. J Water Supply Res Technol Aqua. 70(3):375–400. doi: 10.2166/aqua.2021.129.
- Kandekar VU, Pande CB, Rajesh J, Atre AA, Gorantiwar SD, Kadam SA, Gavit B. 2021. Surface water dynamics analysis based on sentinel imagery and Google Earth Engine Platform: a case study of Jayakwadi dam. Sustain Water Resour Manag. 7(3):44. doi: 10.1007/s40899-021-00527-7.
- Khadri. 2013. Groundwater quality mapping of PTU-1 Watershed in Akola district of Maharashtra India using geographic information system techniques. Int J Sci Eng Res. 4(9):387–397.
- Khan MYA, ElKashouty M, Subyani AM, Tian F. 2023b. Morphometric determination and digital geological mapping by RS and GIS Techniques in Aseer–Jazan Contact, Southwest Saudi Arabia. Water. 15(13):2438. doi: 10.3390/w15132438.
- Khan MYA, ElKashouty M, Subyani AM, Tian F, Gusti W. 2022a. GIS and RS intelligence in delineating the groundwater potential zones in Arid Regions: a case study of southern Aseer, southwestern Saudi Arabia. Appl Water Sci. 12(1):3. doi: 10.1007/s13201-021-01535-w.
- Khan MYA, ElKashouty M, Tian F. 2022b. Mapping groundwater potential zones using analytical hierarchical process and multicriteria evaluation in the central eastern desert, Egypt. Water. 14(7):1041. doi: 10.3390/w14071041.
- Khan MYA, ElKashouty M, Zaidi FK, Egbueri JC. 2023a. Mapping aquifer recharge potential zones (ARPZ) using integrated geospatial and analytic hierarchy process (AHP) in an arid region of Saudi Arabia. Remote Sens. 15(10):2567. doi: 10.3390/rs15102567.
- Kumar BP, Anusha BN, Babu KR, Sree PP. 2023. Identification of climate change impact and thermal comfort zones in semi-arid regions of AP, India using LST and NDBI techniques. J Cleaner Prod. 407:137175. doi: 10.1016/j.jclepro.2023.137175.
- Kumar BP, Babu KR, Anusha BN, Rajasekhar M. 2022. Geo-environmental monitoring and assessment of land degradation and desertification in the semi-arid regions using Landsat 8 OLI/TIRS, LST, and NDVI approach. Environ Chall. 8:100578. doi: 10.1016/j.envc.2022.100578.
- Kumari S, Kumar D, Kumar M, Pande CB. 2023. Modeling of standardized groundwater index of Bihar using machine learning techniques. Phys Chem Earth A/B/C. 130:103395. doi: 10.1016/j.pce.2023.103395.
- Lee S, Kim Y-S, Oh H-J. 2012. Application of a weights-of-evidence method and GIS to regional groundwater productivity potential mapping. J Environ Manage. 96(1):91–105. doi: 10.1016/j.jenvman.2011.09.016.
- Li Y,Mi W,Ji L,He Q,Yang P,Xie S,Bi Y. 2023. Urbanization and agriculture intensification jointly enlarge the spatial inequality of river water quality. Sci Total Environ. 878:162559.doi: 10.1016/j.scitotenv.2023.162559.
- Maity B, Kumar Mallick S, Das P, Rudra S. 2022. Comparative analysis of groundwater potentiality zone using fuzzy AHP, frequency ratio and Bayesian weights of evidence methods. Appl Water Sci. 12(63). doi: 10.1007/s13201-022-01591-w.
- Marín Celestino A, Martínez Cruz D, Otazo Sánchez E, Gavi Reyes F, Vásquez Soto D. 2018. Groundwater quality assessment: an improved approach to K-means clustering, principal component analysis and spatial analysis: a case study. Water. 10(4):437. doi: 10.3390/w10040437.
- Ma S, Qiu H, Yang D, Wang J, Zhu Y, Tang B, Sun K, Cao M. 2023. Surface multi-hazard effect of underground coal mining. Landslides. 20(1):39–52. doi: 10.1007/s10346-022-01961-0.
- Mobasheri A, Pirotti F, Agugiaro G. 2020. Open-source geospatial tools and technologies for urban and environmental studies. Open Geospatial Data Softw Stand. 5(5). doi: 10.1186/s40965-020-00078-2.
- Mogaji KA, Lim HS, Abdullah K. 2015. Regional prediction of groundwater potential mapping in a multifaceted geology terrain using GIS-based Dempster–Shafer model. Arab J Geosci. 8(5):3235–3258. doi: 10.1007/s12517-014-1391-1.
- Mohamed A, Worku H. 2020. Simulating urban land use and cover dynamics using cellular automata and Markov chain approach in Addis Ababa and the surrounding. Urban Clim. 31:100545. doi: 10.1016/j.uclim.2019.100545.
- Moharir KN, Pande CB, Gautam VK, Singh SK, Rane NL. 2023. Integration of hydrogeological data, GIS and AHP techniques applied to delineate groundwater potential zones in sandstone, limestone and shales rocks of the Damoh district, (MP) central India. Environ Res. 228:115832. doi: 10.1016/j.envres.2023.115832.
- Nag SK, Chakraborty S. 2003. Influence of rock types and structures in the development of drainage network in hard rock area. J Indian Soc Remote Sens. 31(1):25–35. doi: 10.1007/BF03030749.
- Naghibi SA, Pourghasemi HR, Dixon B. 2016. GIS-based groundwater potential mapping using boosted regression tree, classification and regression tree, and random forest machine learning models in Iran. Environ Monit Assess. 188(1):44. doi: 10.1007/s10661-015-5049-6.
- Nguyen PT, Ha DH, Avand M, Jaafari A, Nguyen HD, Al-Ansari N, Van Phong T, Sharma R, Kumar R, Le HV, et al. 2020. Soft computing ensemble models based on logistic regression for groundwater potential mapping. Appl Sci. 10(7):2469. doi: 10.3390/app10072469.
- Ozdemir A. 2011. GIS-based groundwater spring potential mapping in the Sultan Mountains (Konya, Turkey) using frequency ratio, weights of evidence and logistic regression methods and their comparison. J Hydrol. 411(3–4):290–308. doi: 10.1016/j.jhydrol.2011.10.010.
- Ozegin KO, Ilugbo SO, Ogunseye TT. 2023. Groundwater exploration in a landscape with heterogeneous geology: an application of geospatial and analytical hierarchical process (AHP) techniques in the Edo north region, in Nigeria. Groundw Sustain Dev. 20(2):100871. doi: 10.1016/j.gsd.2022.100871.
- Pande CB. 2020a. Watershed management and development. In Sustainable watershed development. Springerbriefs in water science and technology. Cham: Springer. doi: 10.1007/978-3-030-47244-3_2.
- Pande CB. 2020b. Thematic mapping for watershed development. In Sustainable watershed development. Springerbriefs in water science and technology. Cham: Springer. doi: 10.1007/978-3-030-47244-3_3.
- Pande CB. 2022. Land use/land cover and change detection mapping in Rahuri watershed area (MS), India using the google earth engine and machine learning approach. Geocarto Int. 37(26):13860–13880. doi: 10.1080/10106049.2022.2086622.
- Pande CB. 2023. Hydrogeology. In Geology, petrography and geochemistry of basaltic rock in Central India. Cham: Springer. doi: 10.1007/978-3-031-30574-0_6.
- Pande CB, Moharir KN 2021. Groundwater resources development and planning in the semi-arid region, 1st ed, Cham: Springer. doi: 10.1007/978-3-030-68124-1.
- Pande CB, Moharir KN, Khadri S. 2021. Watershed planning and development based on morphometric analysis and remote sensing and GIS Techniques: A case study of semi-arid watershed in Maharashtra, India. In Groundwater resources development and planning in the semi-arid region. Cham: Springer. doi: 10.1007/978-3-030-68124-1_11.
- Pande CB, Moharir KN, Panneerselvam B, Singh SK, Elbeltagi A, Pham QB, Varade AM, Rajesh J. 2021. Delineation of groundwater potential zones for sustainable development and planning using analytical hierarchy process (AHP), and MIF techniques. Appl Water Sci. 11(12). doi: 10.1007/s13201-021-01522-1.
- Pande CB, Moharir KN, Singh SK, Elbeltagi A, Pham QB, Panneerselvam B, Varade AM, Kouadri S. 2022. Groundwater flow modeling in the basaltic hard rock area of Maharashtra, India. Appl Water Sci. 12(1):12. doi: 10.1007/s13201-021-01525-y.
- Pant S, Kumar A, Ram M, Klochkov Y, Sharma HK. 2022. Consistency indices in analytic hierarchy process: a review. Mathematics. 10(8):1206. doi: 10.3390/math10081206.
- Patil CA, Nalawade PM, Gadakh BL, Khangar NV. 2022. Statistical assessment of groundwater quality using hydrochemical parameters for drinking water of rural areas in Nashik district, Maharashtra, India. Water Sci. 36(1):136–143. doi: 10.1080/23570008.2022.2152175.
- Patode RS, Pande CB, Nagdeve MB, Moharir KN, Wankhade RM. 2017. Planning of conservation measures for watershed management and development by using geospatial technology – a case study of Patur Watershed in Akola District of Maharashtra. Curr World Environ. 12(3):706–714. doi: 10.12944/CWE.12.3.22.
- Pourtaghi ZS, Pourghasemi HR. 2014. GIS-based groundwater spring potential assessment and mapping in the Birjand Township, southern Khorasan Province. Iran. Hydrogeol J. 22(3):643–662. doi: 10.1007/s10040-013-1089-6.
- Rahmati O, Nazari Samani A, Mahdavi M, Pourghasemi HR, Zeinivand H. 2015. Groundwater potential mapping at Kurdistan Region of Iran using analytic hierarchy process and GIS. Arab J Geosci. 8(9):7059–7071. doi: 10.1007/s12517-014-1668-4.
- Rahmati O, Pourghasemi HR, Melesse AM. 2016. Application of GIS-based data driven random forest and maximum entropy models for groundwater potential mapping: A case study at Mehran Region, Iran. CATENA. 137:360–372. doi: 10.1016/j.catena.2015.10.010.
- Rai SN, Thiagarajan S, Kumari YR. 2011. Exploration for groundwater in the basaltic Deccan traps terrain in Katol Taluk, Nagpur District, India. Curr Sci. 101:1198–1205.
- Rajasekhar, M., Upendra, B., Raju, GS, Anand (2022) Identification of groundwater potential zones in southern India using geospatial and decision-making approaches. Appl Water Sci. 12(68). doi: 10.1007/s13201-022-01603-9.
- Ravichandran R, Ayyavoo R, Rajangam L, Madasamy N, Murugaiyan B, Shanmugam S., 2022. Identification of groundwater potential zone using analytical hierarchical process (AHP) and multi-criteria decision analysis (MCDA) for Bhavani river basin, Tamil Nadu, southern India. Groundw Sustain Dev. 18:100806. doi: 10.1016/j.gsd.2022.100806.
- Razandi Y, Pourghasemi HR, Neisani NS, Rahmati O. 2015. Application of analytical hierarchy process, frequency ratio, and certainty factor models for groundwater potential mapping using GIS. Earth Sci Inf. 8(4):867–883. doi: 10.1007/s12145-015-0220-8.
- Rizeei HM, Pradhan B, Saharkhiz MA, Lee S. 2019. Groundwater aquifer potential modeling using an ensemble multi-adoptive boosting logistic regression technique. J Hydrol. 579:124172. doi: 10.1016/j.jhydrol.2019.124172.
- Sahu U, Panaskar D, Wagh V, Mukate S. 2018. An extraction, analysis, and prioritization of Asna river sub-basins, based on geomorphometric parameters using geospatial tools. Arab J Geosci. 11(17):517. doi: 10.1007/s12517-018-3870-2.
- Salvacion AR. 2022. Groundwater potential mapping using maximum entropy. In Advances in geographical and environmental sciences. Singapore: Springer; p. 239–256. doi: 10.1007/978-981-16-6573-8_13.
- Senapati U, Das TK. 2022. GIS-based comparative assessment of groundwater potential zone using MIF and AHP techniques in Cooch Behar district, West Bengal. Appl Water Sci. 12(43). doi: 10.1007/s13201-021-01509-y.
- Shebl A, Abdelaziz MI, Ghazala H, Araffa SAS, Abdellatif M, Csámer Á. 2022. Multi-criteria ground water potentiality mapping utilizing remote sensing and geophysical data: A case study within Sinai Peninsula, Egypt. Egypt J Remote Sens Space Sci. 25(3):765–778. doi: 10.1016/j.ejrs.2022.07.002.
- Shelar RS, Shinde SP, Pande CB, Moharir KN, Orimoloye IR, Mishra AP, Varade AM. 2022. Sub-watershed prioritization of Koyna river basin in India using multi criteria analytical hierarchical process, remote sensing and GIS techniques. Phys Chem Earth. 128:103219. doi: 10.1016/j.pce.2022.103219.
- Srinivas R, Bhakar P, Singh AP. 2015. Groundwater quality assessment in some selected area of Rajasthan, India using fuzzy multi-criteria decision making tool. Aquat Procedia. 4:1023–1030. doi: 10.1016/j.aqpro.2015.02.129.
- The World Bank. 2022. World water day 2022: How India is addressing its water needs. World Bank. https://www.worldbank.org/en/country/india/brief/world-water-day-2022-how-india-is-addressing-its-water-needs.
- Tolche AD. 2021. Groundwater potential mapping using geospatial techniques: a case study of Dhungeta-Ramis sub-basin, Ethiopia. Geol Ecol Landsc. 5(1):65–80. doi: 10.1080/24749508.2020.1728882.
- Trivedi A, Awasthi MK, Gautam VK, Pande CB, Din NM. 2023. Evaluating the groundwater recharge requirement and restoration in the Kanari river, India, using SWAT model. Environ Dev Sustain. doi: 10.1007/s10668-023-03235-8.
- Wollmann D, Steiner MTA, Vieira GE, Steiner PA. 2013. Details of the analytic hierarchy process technique for the evaluation of health insurance companies. Production. 24(3):583–593. doi: 10.1590/S0103-65132013005000070.
- Wu B, Quan Q, Yang S, Dong Y. 2023. A social-ecological coupling model for evaluating the human–water relationship in basins within the Budyko framework. J Hydrol. 619:129361. doi: 10.1016/j.jhydrol.2023.129361.
- Yahiaoui B, Agoubi B, Kharroubi A. 2021. Groundwater potential recharge areas delineation using groundwater potential recharge index (GPRI) within arid areas: Ghomrassen, south Tunisia. Arab J Geosci. 14(11):919. doi: 10.1007/s12517-021-07173-5.
- Yin H, Wu Q, Yin S, Dong S, Dai Z, Soltanian MR. 2023a. Predicting mine water inrush accidents based on water level anomalies of borehole groups using long short-term memory and isolation forest. J Hydrol. 616:128813. doi: 10.1016/j.jhydrol.2022.128813.
- Yin L, Wang L, Keim BD, Konsoer K, Yin Z, Liu M, Zheng W. 2023b. Spatial and wavelet analysis of precipitation and river discharge during operation of the Three Gorges Dam, China. Ecol Indic. 154:110837. doi: 10.1016/j.ecolind.2023.110837.
- Yuan C, Li Q, Nie W, Ye C. 2023. A depth information-based method to enhance rainfall-induced landslide deformation area identification. Measurement. 219:113288. doi: 10.1016/j.measurement.2023.113288.
- Zhao M, Zhou Y, Li X, Cheng W, Zhou C, Ma T, Li M, Huang K. 2020. Mapping urban dynamics (1992–2018) in Southeast Asia using consistent nighttime light data from DMSP and VIIRS. Remote Sens Environ. 248:111980. doi: 10.1016/j.rse.2020.111980.
- Zhu G, Liu Y, Shi P, Jia W, Zhou J, Liu Y, Ma X, Pan H, Zhang Y, Zhang Z, et al. 2022. Stable water isotope monitoring network of different water bodies in Shiyang River basin, a typical arid river in China. Earth Syst Sci Data. 14(8):3773–3789. doi: 10.5194/essd-14-3773-2022.