
Abstract
Slope movement, the surface expressions as seated scars are the variety of surface deformation mechanisms on the earth’s outer crust. These slow-deformation mechanisms can be visualized easily, if in-situ geotechnical observations, GNSS synopticity (regional), and space-borne (Microwave) spatio-temporal data structured and interpreted accordingly. Globally, several techniques are adapted for the slope failure analysis and their zonation. Thus, the most directed with geospatial technologies. Wide area assessment, mapping, and monitoring are some complex tasks only possible and could be addressed with the space borne datasets. Their outcomes help users to implement area strategies viz. in susceptibility and vulnerability. Landslide Susceptibility mapping (LSM) quantify the problem very effectively. In LSM, soft computing analytical skills among various participatory and triggering factors for the application of complex models are required for ground simulation. In this article critical review of LSM over Uttarakhand Himalaya was primarily focussed which analyze various sections including- participatory/triggering factors, datasets, different models, and validation practices. The study exhibits multiple avenues and future pathways for various research windows, such as LSM-SAR refinement, orographic climatic and changing factor relationship, high-quality data coupling with drone/Unmanned Aerial Vehicle (UAV) data, etc. Such analysis implicates the cost-effectiveness of strategies in effective planning and management.
1. Introduction
Mass movement is the surface expression as seated scars on the outer crust are the primary step of a variety of surface deformation mechanisms. such processes concealed and initiate with the ground slope and its direction and later on their development to the point of surface deformation (earth surface elevation transformation by regional denudation and downward displacement of land) over the earth surface may involve and escalate with the presence of external stimulus over the period (Allen Citation1984). Bibliographic records express a different way of explanation of such mechanisms: Landslide, in terms of Varnes (Citation1978), is a relative displacement of the outer most surface concerning the stable ground state underneath. Similar to this, Crozier (Citation1986) explained it as the gradient apparent and descent gravitational shift of earth elements that occur without the aid of water. While (Guzzetti Citation2002) interpreted it as the downward slope mobilization of earth material with the presence of antecedent variables, such as slope, aspect, elevation, lithology, soil, terrain channeling, etc. oftentimes slope movement started and get escalated with the triggering agent (rainfall, earthquake, anthropogenic acceleration). Well-documented records from Campbell (Citation1975) and Ellen et al. (Citation1988) from California, Jibson (Citation1989), Simon et al. (Citation1990), Larsen and Torres Sanchez (Citation1992) from Puerto Rico, Wilson et al. (Citation1992) and Ellen et al. (Citation1993) from Hawaii, Dikshit et al. (Citation2020) and Das and Ganguli (Citation2022) from India revealed the activation of landslides close association and relationship with the rainfall intensity. Despite García-Rodríguez et al. (Citation2008) from El Salvador, Kamp et al. (Citation2008) from India, Fan et al. (Citation2019) from China, Kargel et al. (Citation2016) from Nepal, Pourghasemi and Rahmati (Citation2018) from Iran supports the role of the earthquake in triggering the landslides. Furthermore, anthropogenic acceleration to affecting slopes includes rapid infrastructure framework (Barnard et al. Citation2001; Petley et al. Citation2007) conjointly with ground shaking (caused during mining, tunneling, and cutting roads) enhance the landslide occurrences in the hilly region (Süzen and Kaya Citation2012; Robinson et al. Citation2017). Due to its multimodal morpho-dynamic process and the improper interaction of humans with the environment, especially in terrain ecosystems, landslides have been identified as one of the fast-spreading epidemics affecting hill ecosystems (Metha et al. Citation2015; Sharma and Sanjeevi Citation2015; Sarkar et al. Citation2016).
The current review intent is to carry out a critical analysis of the techniques used to simulate slope failure susceptibility and the accompanying terrain zonation. It is noticed while preparing the database that, Parallel phrases ‘susceptibility’ is often used with the ‘Hazard’ and exists collinearly. Despite the definition, it stands differently. ‘Susceptibility’ is contemplated as the spatial occurrence and landslide propensity under certain topography and climate conditions in any area. While, the ‘hazard,’ denotes the probability of slope failure and its magnitude with its occurrence in a given period and place.
When addressing the earlier work, it reveals that the study of the landslide impacts with the climatic and triggering variables is attempted and adopted using various GIS heuristic-knowledge-driven (qualitative) and data-driven (quantitative) approaches as illustrated in and . It is noticed that all of the assumptions used in the proposed methodologies and methods to determine landslide susceptibility have been taken directly from the source texts (Varnes and IAEG Citation1984; Carrara et al. Citation1991; Hutchinson Citation1991, Citation1995; Turner and Schuster Citation1996; Guzzetti et al. Citation1999).
Table 1. A basic approach for susceptibility modeling.
Table 2. Classification of basic approaches used in landslide susceptibility assessment/modelling.
In this article, sometimes we use the alternative term ‘Ground movement’, ‘slope movement’, ‘mass movement’, and ‘slope failure’ as ‘landslide’ synonyms.
In the Himalayan orogeny, the land mass distribution in highly elevated areas dominantly hinges on the mechanical characteristics of rock formation with their spatial attributes. Particularly, when dealing with ground movements area-specific geometry is extremely important. The review reveals that landscape geometry evolves through the interaction between exogenic and endogenic earth processes. Later on the process complexes and initiates the mechanisms, such as folding, faulting, basin tilting, and fluvial mechanics within it. When these mechanics together interact and initiate along the geomorphic alignments (viz. slope; its length, curvature, aspect, and roughness) with the superimposed land mass characteristic (including a loaded drainage network, man-made fill, or the artificial overburden), it may fail if one of any alignment gets unstable (Gruber et al. Citation2004; Huggel et al. Citation2010).
In the Himalayan region, landslides are more frequent and severe than global events. Documented database of Geological Survey of India (GSI) (http://www.gsi.gov.in) scales, about 12.6% (0.42 M km2) topography in the Indian subcontinent is prone to landslide hazards, to which 33% (0.14 M km2) falls in the North-western (NW) Himalayas. Particularly, the active boundaries of the states Uttarakhand, Himachal Pradesh, and Jammu and Kashmir are prone to such hazards. Because of its destructive potential, it poses a significant threat to the lives and socio-economic assets of humans as well as to nature’s prosperity (Corominas et al. Citation2013). Landslides with varying frequencies are reported in these terrains. According to recent evidences on landscape creation, it is a widely discussed subject when it comes to high-magnitude with low-frequency landslides and low-magnitude with high-frequency landslides. The identification, measurement, and dating of significant landslides allow for Ist-order estimations of mountain denudation caused by large-scale mass-movements, which can relate further with denudation caused by fluvial and glacial erosion.
Uttarakhand, Garhwal-Kumaun Himalaya (UGKH) an integral part of the Himalayan mountain system occupies a total of 93% of land in the mountainous region. The mentioned complex interactions among several primary factors (Slope, Geology, Geomorphology, Aspect, terrain roughness, vegetation, terrain channelling) with the secondary response (cohesion, friction, changes of the water table and groundwater, and their multiple intensifying stimulus range by magnitude, intensity, and frequency of climatic, earthquake, anthropogenic cause) makes the terrain so vulnerable for the landslide and subsidence. This sometimes results in their aftermath effects, such as induced flash floods (due to landslide dam, debris-glacial flood) or vice versa (Ermini and Casagli Citation2003; Gruber et al. Citation2004; Jomelli et al. Citation2004; Huggel et al. Citation2010; Allen and Huggel Citation2013; Fischer et al. Citation2013; Paranunzio et al. Citation2015; Weidner et al. Citation2019).
Observations of the last two decades with RS and GIS and field-based analysis show the remarkably increasing trends of such calamities in the region. According to the Vulnerability Atlas of India (link https://vai.bmtpc.org/) and (USDMA 2016) report (link https://www.usdma.uk.gov.in), the frequency and number of such disasters have recorded an alarming exponential rise with a 2900% increase in last five years. Most of these occurred between June and October, during the monsoon season, and during the region’s peculiar seismic episodes. Similarly, flash flood-triggered landslides have wreaked havoc on Uttarakhand. According to the (USDMA 2016) database, the state saw significant cloudburst incidents in the years 2002, 2004, 2007, 2008, 2009, 2010, 2012, 2014, 2016, 2019, 2020, 2021, and 2022.
As the practices conducted over the decade’s tells us these hazards can be curbed, but the projection cannot be avoided especially in the Uttarakhand Himalaya. Since it is an earthquake-prone area (Zone-IV and V), Where soil and rocks get disturbed by constant geo-tectonic shift.
Therefore, to map prone areas and their assessment before their occurrence is important in minimizing their hazard impact using spatial distribution and velocity analysis and simultaneously from the inventory outcome by LSM/LHZ assessment. The effort involved in effective hazard susceptibility provides end users, planners, and policy-makers for rapid movement identification, suitable risk assessment, preparedness, and management against such events. However, the reliability of such maps as LSM,/LHZ primarily depends on the criteria scrutinized for hazard evaluation. For an evaluation of the landslide susceptibility it is necessary and important to answer the following ground question:
How will the slope failure occur?
When and where it will occur?
What type of slope failures will occur?
What will be the frequency and magnitude of slope failure? …. etc.
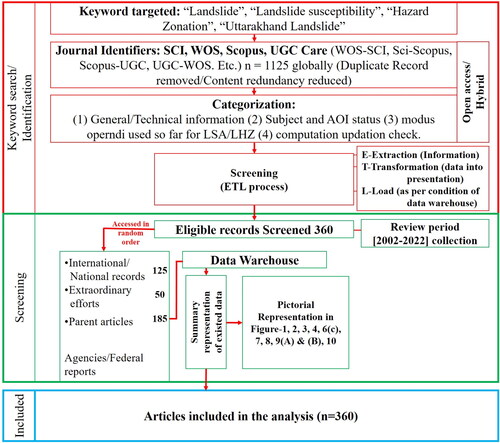
The most recent archives with the current subject show the synoptic diversity of the isostatic adjustment, stabilization, and consolidation state about the region. Therefore, a comprehensive review of the recent work done in consideration of Landslides inventory their updation, LSM/LHZ status, and rate of movement calculation as a subpart. Literatures reviewed to ensure the pattern of occurrence, pattern of movement (annual and temporal), dynamic relationship with the climate, and the long-term impacts/effects of landslides on nearby urbanization for safe operation about landslide awareness and for providing mitigation measures. Therefore, the review was conducted with the scientific published records especially focused on the current criteria of the manuscript subject. Key role as remote sensing and GIS, field, instrumentation, etc. with a different bandwidth of investigation were reviewed for the past, current, and future (expected, projected) through undertaken 360 articles. Out of the numbers a stretch of 185 international/national articles primarily focussing extra-peninsular India, 125 articles focused their views on the same problem globally for the period of 2000–2022 was studied. Fifty articles are considered for basic understanding and their extraordinary efforts. The flowchart adopted for the current systematic analysis is shown in .
Figure 1. Flowchart of the systematic review for the study.
The literature on the burning issue is broad and diversified, so we limit this process by review of the published articles in various scientific journals, proceedings, conferences, and book chapters technically relying on the GIS, and field integrating approach. An exhaustive analysis of the most recent developments in slope stability and failure mechanisms can provide a reliable foundation for stability prediction, early warning, and emergency risk mitigation in mountainous regions. For this paper, a comprehensive perspective addressing the landslide is organized in the sections as follows:
2. Region characteristics: relationship with litho-morphological attribute
Uttarakhand Himalaya (UH), a major framework within Extra Peninsular India (EPI) is one of the most diversified landmasses in terms of the complex morphological setup and the dynamic tectonostratigraphic column. It occupies ∼1.63% area of the Indian total 12% EPI, out of which 93% represents the typical terrain. The region is very prone to ground movements, such as landslide activity. Such slope failures take place due to fragile-complex litho units and presence of the dynamic structures over the region. Further, the associated damage depends upon the size and the rate of movement of the landslide. Morphologically, the region represents a wide spectrum of high energy along its steep topographic slopes also representing the high topographic roughness. Thus, it results in a different range of frequency and magnitude of failures sparsely around the varying geographic units in this region. The terminology of the failure is different with material composition ().
Table 3. Classification of the failure associated with the composition.
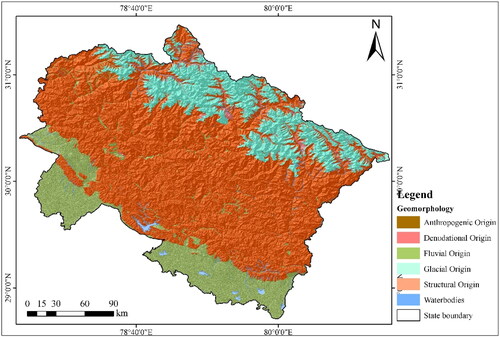
UH shows a variety in the landform pattern (erosional/denudational, depositional) throughout the region due to their origin and the state geographic location, thus it is classified into six major landform classes (GSI and NRSC Citation2012) ().
Figure 2. Major geomorphological classes in the Uttarakhand Himalaya.
In addition to the slope failure, these movements escalate denudational (erosion) processes along the highly undulated Himalayan terrain, which Contributes to the long-term evolution of terrain-slope morphology. Precursor-like various surface expressions develop, such as structural discontinuities, micro topographic deformations, etc. within a moving mass due to the acting tensile/compressional stresses. These can be seen in the bulged slope due to sagging further accompanied by a linear series of depressions before the development of the slip surface.
With the current ability of the space-borne datasets mapping, monitoring, and the overall susceptibility and risk analysis of these prone sites became easy and cost-effective with time. With RS and GIS, mapping the slip surfaces may define their spatial patterns, movement, and their spatiotemporal evolutionary patterns of surface deformation even for the individual evaluation of the slide surface with their kinematics and mechanics. By observing the in-situ surface pattern of the active slope failures one can identify the type of movement and predict their near future dynamic behaviour, such as velocity, the distance of travel, and their pattern in response to the climatic variables, etc.
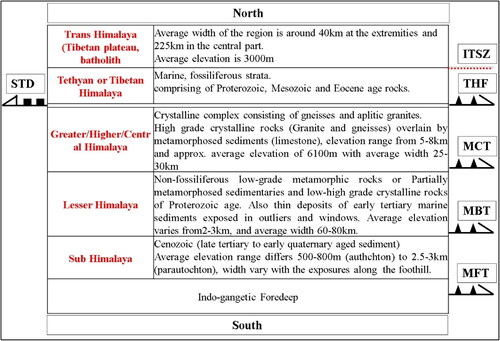
Geologically, in the Himalayan mountains-Uttarakhand Himalayan system provides unique research space for the study to ensure the continental lithosphere response in favour of its destructive Collison history (Dewey and Burke Citation1973; LeForte Citation1975). In context of mass movement, the effective role of geological sequence (formation, litho units) cannot be ignored from the literatures (Middlemess Citation1885; Holland Citation1908; Auden Citation1935; Heim and Gansser Citation1939; Misra and Sharma Citation1967; Jain Citation1971; Rupke Citation1974; Valdiya Citation1979, Citation1980; Srivastava and Mitra Citation1994; Searle et al. Citation2003; Richards et al. Citation2005). It is observed that the Himalayan geology has been studied for over a century by many geologists. In sequence to that (Heim and Gansser Citation1939) first introduced the major Himalayan physiographic sequence as The Sub-Himalayan Seq. (SHS), the Lesser Himalayan Seq. (LHS), the Central Himalayan Crystalline (HCS), and the Tethyan Himalayan Seq. that aged from Cenozoic (quaternary) to Archean and dipping to its north with the alternating dipping thrust-fault systems as Himalayan Main Frontal Thrust (MFT), Main Boundary Thrust (MBT), Main Central Thrust (MCT), and later recognized South Tibet Detachment fault (STDF). Each tectonic unit is not only representing its physiography (average elevation) but also separated by the boundaries of intra-crustal fault zones (thrusts and wrench faults). Stratigraphic association is shown in . Here the map dimension intends to introduce Himalayan geology as a whole with the diverse regional geological setup (Uttarakhand Himalaya) alongside regional structures to elucidate the relationship between landslides and geology. Based on the section review it is observed that the regional setup ranges from the late Proterozoic-recent quaternary age. UH, stretched from south to north elaborates: the late tertiary to a recent quaternary group of rocks. Heterogenic lithology comprised of thickly bedded sandstone, siltstone and mudstone, weakly cemented conglomerate beds, and permeable quaternary deposits on moderate to steep slopes are primarily responsible for the landslide in the lower part region. It has been observed that the intensity usually occurs high along the active tectonic zones, specifically between the MBT–MCT in its south and north. The Proterozoic (mid)–Cambrian (early) age Lesser Himalaya (LH) rocks are bounded between these fault systems. Due to the intense structural presence (folding and faulting) along such rugged-hilly terrain, it becomes highly fractured, highly weathered (Pachauri Citation2010), sheared, and less consolidated. furthermore, compared to other Himalayan sequences, the LHS experiences a higher amplitude of human temporal interference through construction-development activities, such as cultivation, deforestation, construction of roads cutting on complex slopes, more vehicular movements, mining, and other economic activities etc. These elements weaken and fragile the LH terrain, which frequently exacerbates the landslide phenomenon, especially during the monsoon season (Khanduri Citation2017). Similarly, Central Himalaya (HCH) is a region that is highly sensitive to tectonic instability. It is further negatively impacted by anthropogenic intervention, but not up to that greater extent than LHS. it is bounded by STD-MCT from its North-south. Similarly, Tethyan Himalaya (TH) () is strongly influenced by glacial and periglacial processes, with diverse landforms, such as active glaciers, moraines, and loosely-sedimented alluvial fans. Thus, resulting in various incidents of landslides, avalanches, or snow–induced rock avalanches.
Figure 3. Geological map view of Uttarakhand Himalayan and Himalayan geological stretch (modified after Yin Citation2005 and GSI Citation2021).
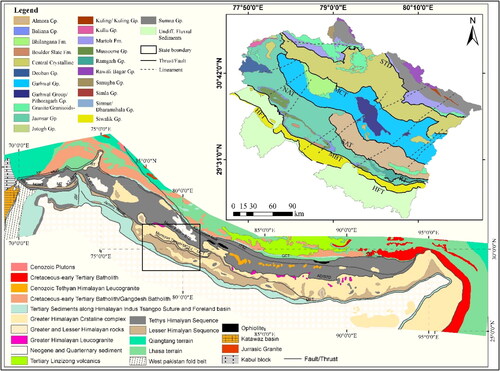
Figure 4. Major structural division of the UH.
2.1. Slope failure: vulnerability with the climate
As previous mentioned, different terrestrial phenomenon influences the slope instability which causes the associated threat, out of them climate play a very crucial role. In natural conditions climate and its variations at different temporal and geographical scales influence the rate and movement and velocity and chiefly by precipitation and temperature (Crozier Citation2010).
Heavy precipitation, like the kind that happens during the monsoon season from mid-June through late September. Thus, it also triggers landslides on the steep terrain. Although, regional setup sometimes drives off-season (early/an extended period) precipitation in a different part of the region and helps in gaining trigger. Furthermore, a scientific study says if the amount released in the preceding seven days is abnormally high in any high mountains, then the potential occurrence of landslides increases. When determining the intensity of precipitation as an aggressive factor, only the immediate preceding rainfall event will be considered. In special terms, landslides may result from moisture content variations in continuous precipitation and are difficult to monitor accurately at a finer scale. Studying the impact of rainfall that precedes a landslide is the simplest way to establish a threshold for them. Globally, records from (Pasuto and Silvano Citation1998; Kanungo and Sharma Citation2014; Dikshit and Satyam Citation2017) explain the antecedent period from 3 to 120 days for the seasonal threshold. For the study area, it can be better conceptualized in , which describes the annual cumulative distribution of rainfall. In area-specific plot for the administrative blocks can easily conceptualized.
Figure 5. Cumulative rainfall distribution in UH.
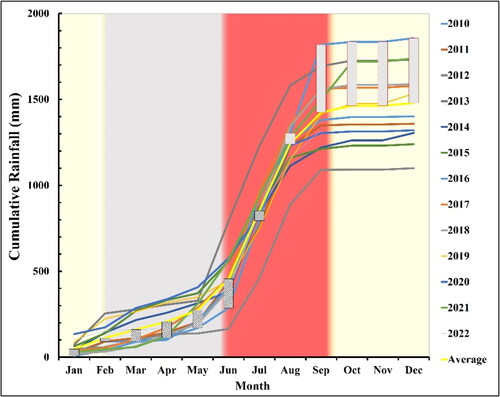
Figure 6. (A,B) Representation of precipitation day hour max trend in 95 administrative blocks of Uttarakhand.
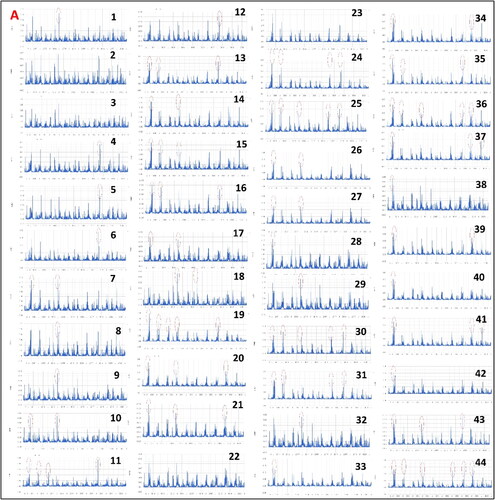
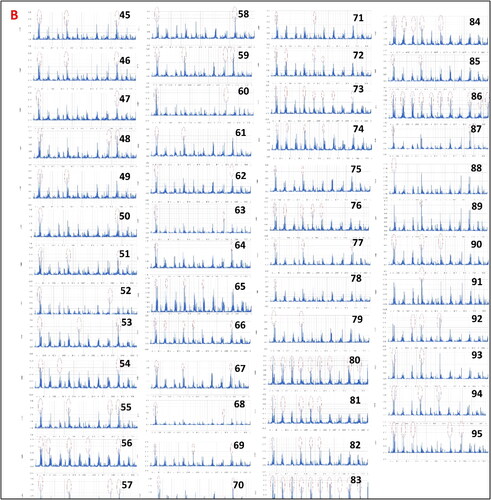
The graphical representation shows the cumulative-intense variation in the UH precipitation throughout the period of (2010–2022), Source (https://indiawris.gov.in). The red portion differentiates the peak monsoon frequency attributed to the sudden rising peak in the year’s trend. The yellow line represents the average value calculated for the months defining year show remarkable changes in the pattern, especially for the years 2010, 2012, 2013, and 2021, respectively in the post-monsoon phase. Various studies suggest the combined impact of more frequent intense rainfall and a warming-environment interaction is affecting the delicate structures around the natural and artificial reservoirs/lakes. Over time add-some effects of such cumulates can affect such structures. It may result in the release of flash floods and downstream flooding, activation/reactivation of landslides by the rapid flow, toe cutting, and associated infrastructure damage with the loss of water resources. For the climatic review, an interpretation with the ‘Climatic reanalysis product-ECMWF produced-ERA5 Daily Aggregates (2017) (C3S Citation2017) with vectorized 95 Administrative blocks was made to get the total precipitation pattern. The understanding was synchronized using the Google earth engine (GEE)—a cloud platform. It displays the temporal high intensified precipitation of the region for the study years. represent the single day-max intense precipitation beyond the torrential limit, which was obtained for all 95 administrative blocks of the state. The Red dotted encircled represents the excess limit of precipitation that happened in a single day max range beyond 125 mm in each administrative unit. As per the technical definition of the cloud burst >100 mm (Dimri et al. Citation2017). The further rising and falling trends in every single block represent the seasonal or monsoonal fluctuation for the study period.
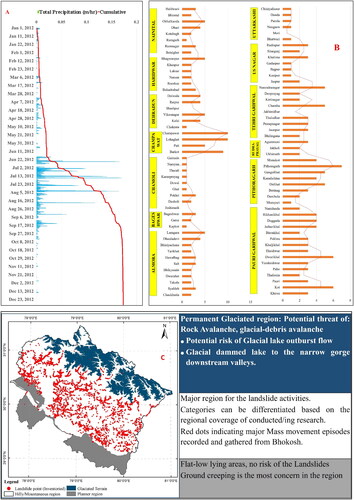
From , the understanding of the basic pattern was further summarized into three parts and illustrated in its continuation in : where (A) represents antecedent prolonged (preceding 7 days) intense rainfall pattern with a day hour’s stretch—it defines the example of the observed precipitation for the particular administrative block number ‘86’ as ‘Champawat’ with a significant positive rate of excess delivers in the area. The graphical plot was made for the year 2012 and the year selection was random to obtain the trend. (B) Illustrates the number of frequent-intense precipitation events that have been encouraged geographically due to hill characteristics—it represents an area day mean total precipitation, which shows multiple extreme event peaks in the same administrative blocks for the study period. This results in the activation and reactivation of thousands of landslides concerning their potential threat (C) Region Classification w.r.t the stability defining potential vulnerability. Combining the results from the current evaluation and the information obtained from past studies show that a combined 72% of articles provide information based on the landslide event as a trigger, out of which 58% of articles directly relate climatic influence as the major trigger and used station- and satellite-based rainfall data as event information. Similarly, 67% of articles focused on the seismic results as the triggers for the explanation. Similar statistics have been computed with the current area specific, here 78% of articles were prepared with the triggers as the influence along with the preparatory response. Relatively comparing the figures 77% revealed and lightening the events on the Area-specific studies with precipitation factors rest focussing and relating it with anthropogenic (road cutting, manmade river damming, mining and quarrying, heavy construction on an undefined slope, forest fire, etc.).
Figure 7. (A) ERA-5 modelled based precipitation observed for the administrative block-Champawat (ID-86), (B) extreme precipitation events in 95 administrative blocks for the study period, and (C) landslide distribution in the region with their vulnerability.
Although there have been numerous studies of slope failures attributed to rainfall in seismically active terrain, such as Uttarakhand (Sangeeta and Maheshwari Citation2019; Gupta and Satyam Citation2022; Khandurı Citation2022). There have been relatively few studies predicting the potential effects of both factors.
2.2. Slope failure: vulnerability with the interplate seismicity
It is concluded that co-seismic slope failures are the most dangerous geological hazards in seismically active mountainous regions (Javed et al. Citation2017). As the result of the 1999 Chamoli earthquake, Barnard et al. (Citation2001) reported 56 triggered landslides after the earthquake in the region. Although, the review conducted here since 2010 depicts relatively fewer/no current record of greater than Mw = 6 earthquakes in the region. Based on data obtained from https://seismo.gov.in/data-portal, shows only two seismic events occurred greater than Mw = 5–6 with a depth ranging of 5–10 km and ∼30 events of Mw = 4–5 having 5–30 km depth in the region. Several earthquakes below Mw < 4 have been found in the inventory displayed in . Along with the background as seismic density plot in the close periphery.
Figure 8. Seismic zonation, archival seismic density map with the structural framework of Uttarakhand Himalaya.
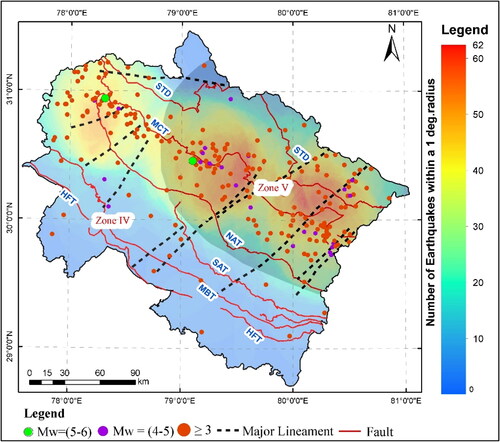
The majority of the seismic event shows their inclination and dynamics along the active tectonics margins, particularly their majority along the Main Central Thrust (MCT) and North Almora Thrust (NAT). MBT and other regional fault systems are also sensitive to their confluence with regional faults. Such dynamics led to a nucleation process to trigger the weak zone (along the high slope, unconsolidated soil overburden, barren land, vulnerable directional slope, near geological structures/weak planes), which further results in significant slope failure or in form of an avalanche in the region. represents the slope class (% distribution), landslide (frequency), and seismic events distribution concerning the seismic zonation of Uttarakhand. The database indicates slope movements and seismic episode occurrences majorly along the slope range of 15–30 and 30–45°. It is also obtained that the central part (Lesser Himalayan group of rocks) are more vulnerable to such type of activities. Detailed information about the specific slope class percent distribution, Seismic history (earthquakes along the slope classes), Landslides (along the slope classes), Slope failure vulnerability of the region, and a few publications detail those using slope range as a critical parameter for their study given below in with further their extension down in the list.
Table 4. Slope class distribution concerning the seismic zone and archives of seismic and landslide with rock type of the region.
3. Slope movement: region-specific classification
The above representations represent the supporting characteristics of Uttarakhand. Here, the most common natural slope failures and their activation shows potential sensitivity and inclination towards the water level changes, intense rainfall, rapid snowmelt, and earthquake shaking. In such terrain, it is frequently observed that sudden drops in the water level against the slope also cause landslides. This happened particularly near to earth dams, along dam margins, and along the banks of lakes, reservoirs, canals, and rivers. Similarly, it is noticed with the rapid snow melt which get saturates more to the hillside soil and recharged the shallow fractured basement. It raises pore fluid pressure beneath regolith, thus triggering the landslide (Mathewson et al. Citation1990).
Further, taking as region-specific failures- can be differentiated into two basic categories: ‘landslide’ and ‘rapid slope failure’. As described in , the division elaborates on the classified failure mechanism based on the gradient, nature of the movement, rate with moving mass (rock, debris, and earth), and the possible aforementioned triggering stipules which support the geographical location of Uttarakhand followed by the overburden mass, topography, geology, soil, over the region. Additionally, landslides and rapid slope failures differ from one another in terms of the size of the incident, slope inclination, and point of origin. describes the following as an extended form (Red and Blue outlined).
Table 5. Characteristics of slope failure.
The slope morphometry presents great variations along the geological units in this region. Failures along the slope valued between min-max (usually above 20° and rarely exceeding >55°) can directly relate to the (Varnes 1978) slope morphometric classification. Based on that landslides, slope classes are characterized into six broad classes grouped as a very gentle, gentle, moderately steep, steep, very steep, and escarpment/cliff. The slope angle >45° is represented as falls and topples. Similarly, a slope angle >15–35° as the slides, and <15° considers slides with creep movement. As per the rate of failure, velocity scale has been proposed by the (Varnes 1978). It is estimated that the landslides generally move at a slow rate (less than cm/min.) with a longer duration (over 100 h) and these are frequently repeated movements with the typical slope angle (Gentle-Moderately steep). In contrast, rapid slope failure typically moves at a rate of more than 1 m per second (with high slope angles that are steep and very steep) and takes less than an hour.
As opposed to weathered materials in their natural state, high slope values exceeding 45° consist of sturdy rocks, and these types of rocks are stable, high slope values are very rare in terms of landslides. It is because of the width of weathering zone which is found too few in such slope settings thus it reduces the susceptibility of landslides. The only thing that heavily triggers these incidents over such slope conditions is the sudden shaking of the earth slab by earthquake and volcanism or by the anthropogenic vibration during the mega-scale development projects. Tanoli et al. (Citation2017) reported that 76% of landslides occurred at slope range between 20 and 50° before earthquakes, whereas 78% occurred at slopes of 30–80° after earthquakes. It determines the effectiveness of such triggers.
4. Slope susceptibility analysis: remote sensing and GIS approach for LSM
From this analysis, varying variable selection with new and modern product refinement techniques, numerous modeling approaches along with differing validation performance. These were applied to the earlier research which gives nearly accurate/positive sign of model adaptability. Irrespective of the modeling approach used, the selection of the thematic raster defining extensive variables particularly if seasonal derivatives—is important and a pre-requisite for LSM. From the records, author extracted information on causative factors for the respective theme preparation. In sequence to that Space-borne data, product types, ground-based events information, and other valuable data as a source for inventory were identified and listed. This can help one with further sorting and inventory arrangement. The scale, mapping unit, and resolution of these inputs are also very important for production and model development.
4.1. Landslide inventory, causative factors, thematic selection-preparation for the LSM
We have listed 100+ papers specifically focussing their views on the landslide incidents covering UH. Similarly, several other published records project the same worldwide. These are separated into six major groups geological, morphological, hydrological, land cover, climatic triggering, and geo-technical, and represented in . Further, the vertical bar diagram shows the effectivity and potency of the specific while defining the susceptibility.
These groups may be combined or cascaded in the space and time. Sometimes it results in ‘complex-movements,’ which include more than one type of movement or those in which one type of movement develops into another. Most of the cases, behaviour of slope movement is highly controlled by the nature of the geological material and so on by physical, hydrological, and geotechnical properties. It demands further exploration for their establishment.
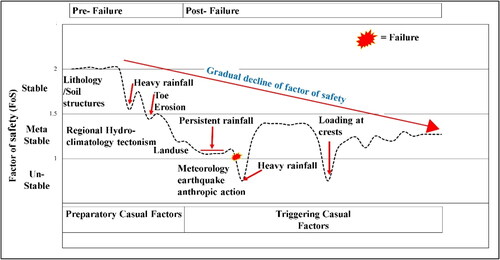
Although these groups were selected and studied based on the un-stability caused by the single controlling parameter ‘Slope’ which is greatly preferred and often initiates such un-stability. Finally, insights from the records enlighten the behavior of such slope failures, which is time-dependent. So, according to Crozier (Citation1986) the safety factor (FoS) of the slope, by comparing the shear strength (act to resist deformation) and shear stress (Force/area) of the slope material, it is possible to classify the slope movement into three stages stable, marginal, or meta-stable and unstable and can be represented by the probability distribution curve representing time dependency in creating slope failure ().
Figure 9. Factor of safety of the region representing slope failure condition.
4.2. Landslide inventory
The first step in assessing susceptibility is to compile a list of an inventory. Historically, inventory data have been used to trace the landslide and their patterns more likely in any area. It can be used for a variety of perceptions and goals that can be implemented for a variety of purposes. These could be local or regional landslide documentation and/or for the susceptibility, vulnerability, and risk analysis. Most inventories are created manually using visual image interpretation based on various sources, such as aerial photographs, unspecified satellite images, Google Earth (GE) images, or pixel-based records of previous inventories. To identify a landslide, land features special characteristics commonly used, such as terrain signature, spectral reflectance, appearance, morphological expression, DN (digital number) values, color, tone, texture, and indices, among others. To construct a landslide inventory, there are no standard guidelines.
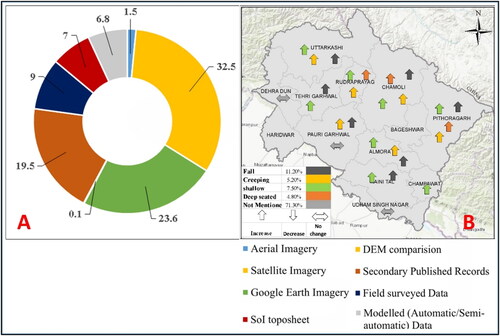
Review assessment: While going through the regional database, 15.2% of articles did not mention any kind of inventory information in their LSZ process, In the majority of the articles, the inventory was described as large-small and cross-checked with field visits. The comprehensive evaluation of the technique used by the authors is summarized as the velocity and depth of the scar illustrated in . Technically, field and domain supervision as an expertise will be very beneficial in such an analysis otherwise, the degree of reliability and ambiguity in the records will continue to exist. According to (Sarkar and Kanungo Citation2004; Guzzetti et al. (Citation2012), In addition to field work and other database-the quality of the landslide inventory can be improved by including additional information, such as the depth and type of slide, the material involved, the number of losses, and so on. Records say the number of activities in terms of landslide and associated subsidence has increased in the region. Fall, creeping, and shallow focus slope movements are found to be very common in literature whereas, the reporting on the earlier exposed scars can be figured out as most of the deep-seated slope failures with their space and time distribution as shown by . It also depicts the trend in terms of increase, decrease, and no change of the slope failure categories in the major districts representing Uttarakhand.
Figure 10. (A) Technique and data source used widely in LSM/LSA inventory as reviewed and (B) space-time distribution of slope failure in the region.
RS and GIS limitations can be attributed to the researcher’s ability to identify landslides from RS data, which requires high-resolution cloud-free images for better interpretation. Concerning challenges the adjacency effect also makes it difficult to delineate the exact boundary of landslides in hilly terrain due to different slope heights and aspects A significant number of articles on susceptibility, or zonation were found to be used in unique databases for an inventory. The illustration in is entirely based on existing work. Selection of the factor theme is one of the most difficult aspects of assessing landslide susceptibility determining the best combination of themes and representative factors. However, their association with the study area should be usually locally established along with data availability. With the literature, we have examined important sixty-five factors under the abovementioned six broad categories displayed in below.
Figure 11. Causative factor used for the LSM/LSA and used by the articles acquired from the records.
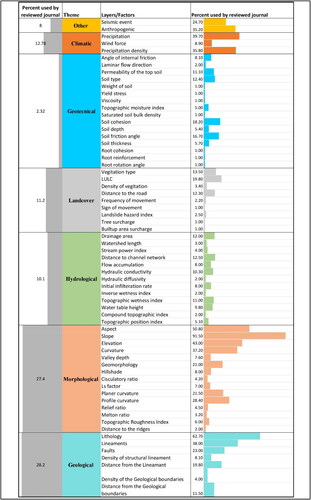
These themes have been observed as the initial important factor for susceptibility mapping. The role of individual themes in the percent was graphed, extending in . There were ∼91.5% of publications that use slope, followed by Lithology (62.7%), aspect (50.8%), elevation (43%), curvature (37.2%), lineament, fault (38 and 23%), and others. Future perspectives on conducting such studies can eliminate and replace these factors with terrain sense ideas.
4.3. Dataset selection for LSM and thematic modelling
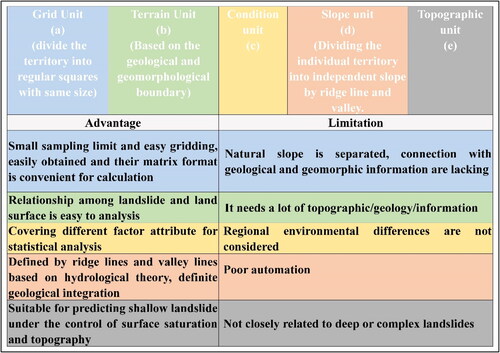
depicts the outcome of this analysis, which depicts widely used globally accessible paid/free datasets for mapping and monitoring of such natural hazards by the scientific, research, and communities’/level authorities periodically to encompass the potential threat. Existing available information shows the categories to which one can use it by the spatial information, their revisit over the study area, and reliability while focusing the scar identification. The quality and effectiveness of the map can be further increased with the subcategories demanding local, regional, and wide perspectives of the map using high (1–10 m), moderate (10–30 m), and coarse (>30 m) datasets. Landslide mapping scales as; Large (1:5k–1:15k), Medium (1:25k–1:100k), Regional (1:100k–1:500k), and National (<1:500k) Functionalities sometime change with the datasets like DEM (DTM/DSM/) which differs sometimes and quite important when dealing with changes in topographic undulations from sudden terrain flatness to sudden rising ridges alongside or their combined integration. Similarly, dependency upon the resolution of the satellite dataset sometimes results in a long spatial revisit which further results in the lack of updation in the calamities frequency over the region and plays a significant role in configuring finer mapping units (In terms of the type of landslide, and its failure mechanisms). Because the mapping unit, which can be either regular or irregular primitives, is the smallest indivisible unit of space used in the landslide susceptibility analysis. When analyzing susceptibility, it is essential to select meaningful mapping units. The most appropriate mapping unit is determined by several factors, including the type of landslide phenomenon, the scale of investigation, quality, resolution, thematic information scale and type, and adequate information management with analysis tools (Calvello et al. Citation2013). All units in this study are divided into five categories: Grid units, Terrain units, unique condition units, Slope units, and Topographic units (Guzzetti et al. Citation1999), as illustrated in .
Figure 12. Globally open access/paid datasets for the natural hazard application (LSM/LSZ) model/approach.
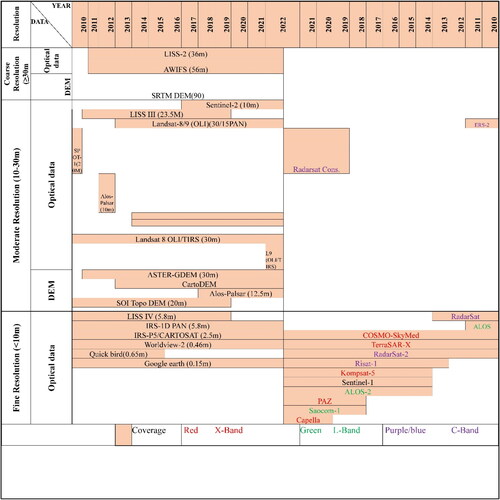
Figure 13. Summary of the mapping units in LSM/LSA.
5. Model/approach and validation methods
Model and various approaches used for the validation of landslide risk assessments are essential elements in mapping like LSA/LSM/LSZ, as the estimation of risk is usually subject to substantial uncertainty. However, very few studies have addressed this issue specifically. To maximize investment for landslide risk mitigation, management authority, and decision-makers should be aware of the limitations of risk analysis results. The majority of the modeling approaches have been discussed in the introductory part of the article.
The elementary framework of any hazard model and its validation should centre around the basic pattern of investigation (1) detailed area analysis and hazard modelling, (2) topographic support reliable slope failure modelling, (3) damage modelling (probability of affecting area accumulates), and (4) integration of hazards-associated failures-produced damage to compute and evaluate risk, failure and reliable modelling. The session summarized perspectives from various records on effective model validation and their practices on accuracy statements. A total of twelve validation practices were listed addressing the key challenges. By these recommendations, we may ultimately improve the potential reliability and usability of slope failure analyses ().
Figure 14. (A) Validation methods of LSM/LSA. (B) Radar diagram of articles published by the type of institution (C) for different applications, and (D) Processing technique on data collection.
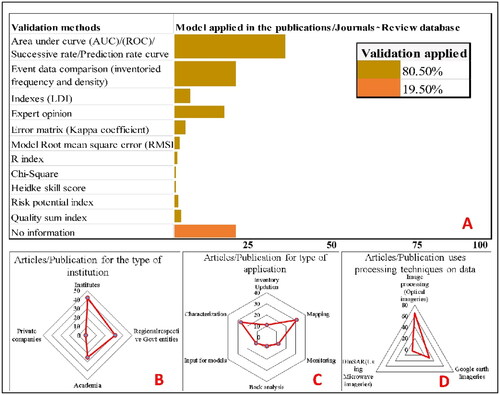
With these twelve important validation methods, we found that 80.50% of articles/Publications choice with these validation methods, such as AUC/ROC/SR/PRC, Event data (inventoried frequency and density) method, Expert opinion, RMSE, R-index techniques, and quality sum index methods for validation. Where, Specifically, AUC/ROC/SR/PRC is found to be used by 33%, inventoried frequency, and density have been used by 19.5%, Indexes (LDI) by 5%, RMSE, and R-index techniques were used by 3.5 and 1.5%, respectively and so on. A total of 19.5% were found to perform no validation for the model evaluation. For the performance of any model calibration, an initial training dataset is required. After calibration and execution of the model, the resultant map can be checked for their prediction accuracy of landslides over an area scientifically. The compatibility of models should be checked in any scientific studies using these Qualitative/Quantitative validation techniques.
6. Discussion
In this literature review and analysis, the author identified the different methods and variety of input data, etc. commonly used to map landslide susceptibility. Various aspects were analyzed and examined to better understand disparities in the worldwide study, especially for Uttarakhand. A considerable heterogeneity was observed in the methods, thematic variables, origins of the inventories, and validation practices to compose the final susceptibility map. This could be due to the user space and dependency of potential drivers (participatory and triggering) acting separately and applied on a different part of the region.
This investigation included an evaluation of 360 articles from 2010 to 2022 on landslide susceptibility mapping (LSM/LSA) and its fundamentals. The articles targeted for the analysis on the current subject covering year-by-year changes, used techniques, type of landslides, movement, number of landslides and their frequency, their periodic causes, and finding their close association with climatic or Geo-disturbances, etc. Moreover, to observe the temporal trend, we segmented the articles into four phases. Based on it, we observed that the number of articles published in the study period since 2010 has increased annually, with new introductory techniques but also with advanced scale analysis. Such a development could be attributed to increased public awareness of certain disasters, as well as rapid advancements in related application and model development. To map and monitor landslide hazards across an area, it is critical to check the ease of access of digital datasets, including RS data, for the execution and evolution of new models (machine learning models) (Devoli et al. Citation2007). Recent reports indicate that investigators becoming increasingly interested in the sensitivity of mapping-monitoring landslides due to their global prevalence and ability to inflict irreparable harm to people their property and at the same time their prosperity. The present capabilities of scientific dealing coupled with the present Synthetic Aperture Radar (SAR) environment gives accurate and near possible prone areas delineation using such analysis (Ciampalini et al. Citation2016; Li et al. Citation2019). The regions investigated using the articles cover large parts of the state of Uttarakhand. However, Nainital. Tehri Garhwal, Rudraprayag, Chamoli, Pithoragarh. Almora and Uttarkashi were particularly targeted due to the frequency of movement that happened in the region from time to time in a long history. Such incidence contains region-specific characteristics. For instance, the likelihood of landslides is greater in areas with hills and affects when events impact, such as rainfall or earthquakes, which leads to more data being available and supporting more studies.
The examined papers included thousands of landslides, although some appeared to be duplicated. Many Individual studies have found that landslides occur frequently, regardless of how frequently they occur. Refinement in the datasets can be used in future studies for further analysis in terms of new and more accurate models. Additionally, a concerted academic effort should be made to better understand landslides. Hence, landslide information and modeling must be improved through further case studies. It is recommended to ensure instrumental-based academic collaboration in which new models and merging of applied data can be used for better development for the site selection base study.
Pictorial and tabulated representation in , show the role of different observation and their affection in such studies which was considered 1000s times in the GIS-based LSM/LSA. All of the individuals, such as effect of role angles on stability, the association of slope parameters with others, the association of soil parameters with slope angle, the association of hydrology and slope angle, the association of lithology and slope angle, the association of climate and slope angle, the association of aspect and slope angle, the association of vegetation and slope angle, the association of erosion and slope angle, the association of seismicity and slope angle, the association of slope length elevation and slope angle, the association of landslides according to the slope values was majorly discussed. Because slope plays an intrinsic and governing major factor in defining movement so it is valued more with all the associated combinations. Several of these factors were considered frequently, suggesting that they are closely related to the occurrence of landslides. Despite this, the likely causes for landslides have not significantly changed over the study period. In account, of this microwave space-borne data can add movement, their rate over the period, weights of causes, and other important add-ins for further research dimensions.
In terms of the employed models, several types were introduced by various authors as listed at the beginning of . Logistic regression, Frequency ratio, artificial neural network, fuzzy logic, support vector machine, AHP, and weight of evidence models were applied in most of the cases in the articles. Machine learning models, such as support vector machine, random forest, decision tree, and naïve Bayes models, have been applied more recently.
The first three steps of the analysis of landslides are susceptibility, hazards, and risk mapping. Susceptibility has been examined in numerous studies, including the current literature review. The hazard and risk steps, however, are covered in fewer articles. Therefore, more research should be done on the hazards and risk management techniques to lessen landslide damage, save lives, and prevent property.
For initial planning and cost-effective analysis, these issues at the catchment scale require additional information. Still, there is a lot of work to do in the integration of such models to improve zonation maps, which initially can be expensive (real-time data order) for real-time growth but cost-effective with the archival resources.
7. Conclusion
A large part of the review on landslide susceptibility mapping was devoted to Uttarakhand, as the state experienced ever so often landslide activities in its active territories. However, the central part (LH) that encompasses the region is where activities are more likely to occur. This could be the effect of the proximity of the dense identified major-minor fault system, localized lineaments, well-established urbanized colonies/developing projects and their load, and the presence of natural/artificial DAM impoundment, Lakes in the nearby region. Slope stability problem and their presence also explain their vast occurrences to the proximity of these sites likely to be mentioned above.
Various publications in the international/national community repeatedly and time-to-time have covered their changing status using advanced and comparatives techniques, which rely on the slope-movements defining models. It is further accomplished using different validation curves and accuracy methods. Current observation from the review figured out that, there is a lack of validation when it comes to decision-makers and stakeholders to assess the practical applicability of the generated LSM/LSZ. It is important and to be very precise when dealing with regional analyses, especially if the country/federal or state depends on terrain for its economic population, tourism, and revenue.
Authors’ contributions
HK conceptualized and compiled this manuscript from different sources; Original and technical articles, Books, conference papers, thesis’s, proceedings, and state government/agencies of respective domain reports. HK thoroughly reviewed the contents, as material, technical processing, analyzed and prepared all structural data for this manuscript. KSR and RSC provided required/necessary input in the general organization of this manuscript significantly. The manuscript was read and approved by the author (s) and the datasets prepared/generated during and/or analyzed in this doctoral research are available from the corresponding author on reasonable request.
Acknowledgments
The authors are thankful to Geo-Informatics, Department of Civil Engineering, Graphic Era Deemed to be University, Dehradun, Uttarakhand and Indian Institute of Remote Sensing, Indian Space Research Organization, Dehradun, Uttarakhand (IIRS, ISRO) for extending all kinds of support during the compilation of the present review work.
Data availability statement
All materials used for the review article compilation are properly cited. The datasets used and/or analyzed during the current study are available from the corresponding author upon reasonable request.
Additional information
Funding
References
- Ada M, San BT. 2018. Comparison of machine-learning techniques for landslide susceptibility mapping using two-level random sampling (2LRS) in Alakir catchment area, Antalya, Turkey. Nat Hazards. 90(1):237–263. doi: 10.1007/s11069-017-3043-8.
- Aghdam N, Varzandeh MHM, Pradhan B. 2016. Landslide susceptibility mapping using an ensemble statistical index (Wi) and adaptive neuro-fuzzy inference system (ANFIS) model at Alborz Mountains (Iran). Environ Earth Sci. 75(7):1–20.
- Akgun A, Dag S, Bulut F. 2008. Landslide susceptibility mapping for a landslide-prone area (Findikli, NE of Turkey) by likelihood-frequency ratio and weighted linear combination models. Environ Geol. 54(6):1127–1143. doi: 10.1007/s00254-007-0882-8.
- Akgün A, Türk N. 2011. Mapping erosion susceptibility by a multivariate statistical method: a case study from the Ayvalık region, NW Turkey. Comput Geosci. 37(9):1515–1524. doi: 10.1016/j.cageo.2010.09.006.
- Akgun A. 2012. A comparison of landslide susceptibility maps produced by logistic regression, multi-criteria decision, and likelihood ratio methods: a case study at Izmir, Turkey. Landslides. 9(1):93–106. doi: 10.1007/s10346-011-0283-7.
- Allen S, Huggel C. 2013. Extremely warm temperatures as a potential cause of recent high mountain rock fall. Global Planet Change. 107:59–69. doi: 10.1016/j.gloplacha.2013.04.007.
- Allen SA. 1984. Types of land subsidence. In: Poland JF, editor. Guidebook to studies of land subsidence due to ground-water withdrawal. Paris: United Nations Educational Scientific and Cultural Organization; p. 291–305.
- Althuwaynee OF, Pradhan B, Mahmud AR, Yusoff ZM. 2012. Prediction of slope failures using bivariate statistical based index of entropy model. IEEE Colloquium on Humanities, Science and Engineering (CHUSER). doi: 10.1109/chuser.2012.6504340.
- Althuwaynee OF, Pradhan B, Park HJ, Lee JH. 2014a. A novel ensemble bivariate statistical evidential belief function with knowledge-based analytical hierarchy process and multivariate statistical logistic regression for landslide susceptibility mapping. Catena. 114:21–36. doi: 10.1016/j.catena.2013.10.011.
- Althuwaynee OF, Pradhan B, Park HJ, Lee JH. 2014b. A novel ensemble decision tree based CHi-squared Automatic Interaction Detection (CHAID) and multivariate logistic regression models in landslide susceptibility mapping. Landslides. 11(6):1063–1078. doi: 10.1007/s10346-014-0466-0.
- Arora MK, Das Gupta AS, Gupta RP. 2004. An artificial neural network approach for landslide hazard zonation in the Bhagirathi (Ganga) valley, Himalayas. Int J Remote Sens. 25(3):559–572., doi: 10.1080/0143116031000156819.
- Auden JB. 1935. Traverses in the Himalaya. Rec Geol Surv Ind. 69:123–167.
- Ayalew L, Yamagishi H, Ugawa N. 2004. Landslide susceptibility mapping using GIS based weighted linear combination, the case in Tsugawa area of Agano River, Niigata Prefecture, Japan. Landslides. 1(1):73–81. doi: 10.1007/s10346-003-0006-9.
- Bai X, Jian J, He S, Liu W. 2019. Dynamic process of the massive Xinmo landslide, Sichuan (China), from joint seismic signal and morphodynamic analysis. Bull Eng Geol Environ. 78(5):3269–3279. doi: 10.1007/s10064-018-1360-0.
- Barnard PL, Owen LA, Sharma MC, Finkel RC. 2001. Natural and human-induced landsliding in the Garhwal Himalaya of Northern India. Geomorphology. 40(1–2):21–35. doi: 10.1016/S0169-555X(01)00035-6.
- Batar AK, Watanabe T. 2021. Landslide susceptibility mapping and assessment using geospatial platforms and weights of evidence (WoE) method in the Indian Himalayan Region: recent developments, gaps, and future directions. ISPRS Int J Geo-Inf. 10(3):114. doi: 10.3390/ijgi10030114.
- Bhargavi P, Jyothi S. 2009. Applying naive bayes data mining technique for classification of agricultural land soils.
- Bhattacharyya P, DasGupta S, Das S, Paul S. 2020. Landslide susceptibility analysis: a case study of Nainital municipal area. 23 November, Preprint (Version 1) available at Research Square. doi: 10.21203/rs.3.rs-106891/v1.
- Binh Thai P, Dieu TB, Indra P. 2017. Application of classification and regression trees for spatial prediction of rainfall induced shallow landslides in the Uttarakhand Area (India) using GIS. In: Climate change, extreme events and disaster risk reduction. Berlin, Heidelberg: Springer; p. 159–170.
- Birkinshaw SJ, James P, Ewen J. 2010. Graphical user interface for rapid setup of SHETRAN physically-based river catchment model. Environ Modell Softw. 25(4):609–610. doi: 10.1016/j.envsoft.2009.11.011.
- Brenning A. 2005. Spatial prediction models for landslide hazards: review, comparison and evaluation. Nat Hazards Earth Syst Sci. 5(6):853–862. doi: 10.5194/nhess-5-853-2005.
- Brenning A. 2008. Statistical geocomputing combining R and SAGA: the example of landslide susceptibility analysis with generalized additive models. In: Böhner J, Blaschke T, Montanarella L, Böhner J, editors. SAGA—seconds out. Hamburger Beiträge zur Physischen Geographie und Landschafts Ökologie. Vol. 19. Universität Hamburg, Institut für Geographie; p. 23–32, 410.
- Bui DT, Pradhan B, Lofman O, Revhaug I, Dick OB. 2012. Landslide susceptibility mapping at HoaBinh province (Vietnam) using an adaptive neuro-fuzzy inference system and GIS. Comput Geosci. 45:199–211. doi: 10.1016/j.cageo.2011.10.031.
- Calvello M, Cascini L, Mastroianni S. 2013. Landslide zoning over large areas from a sample inventory by means of scale-dependent terrain units. Geomorphology. 182:33–48. doi: 10.1016/j.geomorph.2012.10.026.
- Campbell RH. 1975. Soil slips, debris flows, and rainstorms in the Santa Monica mountains and vicinity, Southern California. U.S. Geological Survey Professional Paper 851; p. 51.
- Carrara A, Cardinali M, Detti R, Guzzetti F, Pasqui V, Reichenbach P. 1991. GIS techniques and statistical models in evaluating landslide hazard. Earth Surf Process Landforms. 16(5):427–445. doi: 10.1002/esp.3290160505.
- Champati Ray PK, Dimri S, Lakhera RC, Sati S. 2007. Fuzzy-based method for landslide hazard assessment in active seismic zone of Himalaya. Landslides. 4(2):101–111. doi: 10.1007/s10346-006-0068-6.
- Chang KT, Merghadi A, Yunus AP, Pham BT, Dou J. 2019. Evaluating scale effects of topographic variables in landslide susceptibility models using GIS-based machine learning techniques. Sci Rep. 9(1):12296. doi: 10.1038/s41598-019-48773-2.
- Chang M, Tang C, Xia C, Fang Q. 2016. Spatial distribution analysis of landslides triggered by the 2013-04-20 Lushan earthquake, China. Earthq Eng Eng Vib. 15(1):163–171. doi: 10.1007/s11803-016-0313-5.
- Chauhan S, Sharma M, Arora MK, Gupta NK. 2010. Landslide susceptibility zonation through ratings derived from artificial neural network. Int J Appl Earth Obs Geoinf. 12(5):340–350. doi: 10.1016/j.jag.2010.04.006.
- Chen T, Niu R, Jia X. 2016. A comparison of information value and logistic regression models in landslide susceptibility mapping by using GIS. Environ Earth Sci. 75(10):1–16. doi: 10.1007/s12665-016-5317-y.
- Chen W, Peng J, Hong H, Shahabi H, Pradhan B, Liu J, Zhu A-X, Pei X, Duan Z. 2018. Duan landslide susceptibility modelling using GIS-based machine learning techniques for Chongren County, Jiangxi Province, China. Sci Total Environ. 626:1121–1135. doi: 10.1016/j.scitotenv.2018.01.124.
- Chen W, Shahabi H, Shirzadi A, Hong H, Akgun A, Tian Y, Liu J, Zhu AX, Li S. 2019. Novel hybrid artificial intelligence approach of bivariate statistical-methods-based kernelogistic regression classifier for landslide susceptibility modeling. Bull Eng Geol Environ. 78(6):4397–4419. doi: 10.1007/s10064-018-1401-8.
- Chen W, Shirzadi A, Shahabi H, Ahmad BB, Zhang S, Hong H, Zhang N. 2017. A novel hybrid artificial intelligence approach based on the rotation forest ensemble and naïve Bayes tree classifiers for a landslide susceptibility assessment in Langao County, China. Geomatics Nat Hazards Risk. 8(2):1955–1977. doi: 10.1080/19475705.2017.1401560.
- Choi J, Lee YK, Lee M, Kim K, Park Y, Kim S, Goo S, Cho M, Sim J, Won JS. 2011. Landslide susceptibility mapping by using an adaptive neuro-fuzzy inference system (ANFIS). IEEE International Geoscience and Remote Sensing Symposium. New York (NY): IEEE; p. 1989–1992.
- Chung CJF, Fabbri AG. 2003. Validation of spatial prediction models for landslide hazard mapping. Nat Hazards. 30(3):451–472. doi: 10.1023/B:NHAZ.0000007172.62651.2b.
- Ciampalini A, Raspini F, Lagomarsino D, Catani F, Casagli, N, 2016. Landslide susceptibility map refinement using PSInSAR data. Rem Sens Environ. 184:302–315. doi: 10.1016/j.rse.2016.07.018.
- Conoscenti C, Ciaccio M, Caraballo-Arias NA, Gomez-Gutierrez A, Rotigliano E, Agnesi V. 2015. Assessment of susceptibility to earth-flow landslide using logistic regression and multivariate adaptive regression splines: a case of the Belice River basin (western Sicily, Italy). Geomorphology. 242:49–64. doi: 10.1016/j.geomorph.2014.09.020.
- [C3S] Copernicus Climate Change Service. 2017. ERA5: fifth generation of ECMWF atmospheric reanalyses of the global climate. Copernicus Climate Change Service Climate Data Store (CDS). (date of access). https://cds.climate.copernicus.eu/cdsapp#!/home.
- Corominas J, van Westen C, Frattini P, Cascini L, Malet J-P, Fotopoulou S, Catani F, Van Den Eeckhaut M, Mavrouli O, Agliardi F, et al. 2013. Recommendations for the quantitative analysis of landslide risk. Bull Eng Geol Environ. 73(2):209–263. doi: 10.1007/s10064-013-0538-8.
- Crozier MJ. 1986. Landslides: causes, consequences & environment. London: Croom Helm Publication.
- Crozier MJ. 2010. Deciphering the effect of climate change on landslide activity: a review. Geomorphology. 124(3–4):260–267. doi: 10.1016/j.geomorph.2010.04.009.
- Das SR, Ganguli P. 2022. Predictability of rainfall induced-landslides: the case study of Western Himalayan Region. EGU Sphere :1–32. doi: 10.5194/egusphere-2022-243.
- Devkota KC, Regmi AD, Pourghasemi HR, Yoshida K, Pradhan B, Ryu IC, Dhital MR, Althuwaynee OF. 2013. Landslide susceptibility mapping using certainty factor, index of entropy and logistic regression models in GIS and their comparison at Mugling–Narayanghat road section in Nepal Himalaya. Nat Hazards. 65(1):135–165. doi: 10.1007/s11069-012-0347-6.
- Devoli G, Strauch W, Chávez G, Høeg K. 2007. A landslide database for Nicaragua: a tool for landslide-hazard management. Landslides. 4(2):163–176., doi: 10.1007/s10346-006-0074-8.
- Dewey JF, Burke K. 1973. Tibetan, Variscan and Precambrian basement reactivation: products of continental collision. J Geol. 81(6):683–692. doi: 10.1086/627920.
- Dickson ME, Perry GLW. 2016. Perry identifying the controls on coastal cliff landslides using machine-learning approaches. Environ Model Softw. 76:117–127. doi: 10.1016/j.envsoft.2015.10.029.
- Dikshit A, Sarkar R, Pradhan B, Segoni S, Alamri AM. 2020. Rainfall induced landslide studies in Indian Himalayan region: a critical review. Appl Sci. 10(7):2466. doi: 10.3390/app10072466.
- Dikshit A, Satyam N. 2017. Rainfall thresholds for the prediction of landslides using empirical methods in Kalimpong, Darjeeling, India. Workshop on Advances in Landslide Understanding, JTC1; Barcelona; p. 255–259.
- Dimri AP, Chevuturi A, Niyogi D, Thayyen RJ, Ray K, Tripathi SN, Pandey AK, Mohanty UC. 2017. Cloudbursts in Indian Himalayas: a review. Earth Sci Rev. 168:1–23. volumedoi: 10.1016/j.earscirev.2017.03.006.
- Ding Q, Chen W, Hong H. 2016. Application of frequency ratio, weights of evidence and evidential belief function models in landslide susceptibility mapping. Geocarto Int. 32:6, 619–639. doi: 10.1080/10106049.2016.1165294.
- Ellen SD, Mark RK, Cannon SH, Knifong DL. 1993. Map of debris-flow hazard in the Honolulu District of Oahu, Hawaii. U.S. Geological Survey Open-File Report 93-2 13, 25 pp. Entropy. 20(11):884.
- Ellen SD, Wieczorek GF, Brown WM III, Herd DG. 1988. Introduction. In: Ellen SD, Wieczorek GF, editors. Landslides, floods, and marine effects of the storm of January 3–5, 1982, in the San Francisco Bay Region, California—Introduction, U.S. Geological Survey Professional Paper 1434; p. 1–5.
- Ermini L, Casagli N. 2003. Prediction of the behavior of landslide dams using a geomorphological dimensionless index. Earth Surf Process Landforms. 28(1):31–47. doi: 10.1002/esp.424.
- Ewen J, Parkin G, O’Connell P. 2000. SHETRAN: distributed river basin flow and transport modeling system. J Hydrol Eng. 5(3):250–258. doi: 10.1061/(ASCE)1084-0699(2000)5:3(250).
- Fan W, Wei XS, Cao YB, Zheng B. 2017. Landslide susceptibility assessment using the certainty factor and analytic hierarchy process. J Mt Sci. 14(5):906–925. doi: 10.1007/s11629-016-4068-2.
- Fan X, Scaringi G, Korup O, West AJ, van Westen CJ, Tanyas H, Hovius N, Hales TC, Jibson RW, Allstadt KE, et al. 2019. Earthquake‐induced chains of geologic hazards: patterns, mechanisms, and impacts. Rev Geophys. 57(2):421–503. doi: 10.1029/2018RG000626.
- Feizizadeh B,Blaschke T. 2012. Comparing GIS-multicriteria decision analysis for landslide susceptibility mapping for the lake basin, Iran. 2012 IEEE International Geoscience and Remote Sensing Symposium. doi: 10.1109/igarss.2012.6352388.
- Feizizadeh B, Blaschke T, Nazmfar H. 2014. GIS-based ordered weighted averaging and Dempster–Shafer methods for landslide susceptibility mapping in the Urmia Lake Basin, Iran. Int J Digit Earth. 7(8):688–708. doi: 10.1080/17538947.2012.749950.
- Feizizadeh B. 2013. Integrating GIS based fuzzy set theory in multicriteria evaluation methods for landslide susceptibility mapping. Int J Geoinformatics. 9:49–57.
- Feizizadeh B, Blaschke T, Nazmfar H, Rezaei Moghaddam M. 2013. Landslide susceptibility mapping for the Urmia Lake basin, Iran: a multi-criteria evaluation approach using GIS. Int J Environ Res. 7(2):319–336. doi: 10.22059/ijer.2013.610.
- Felicísimo A, Cuartero A, Remondo J, Quirós E. 2013. Mapping landslide susceptibility with logistic regression, multiple adaptive regression splines, classification and regression trees, and maximum entropy methods: a comparative study. Landslides. 10(2):175–189. doi: 10.1007/s10346-012-0320-1.
- Fischer L, Huggel C, Kääb A, Haeberli W. 2013. Slope failures and erosion rates on a glacierized high‐mountain face under climatic changes. Earth Surf Process Landforms. 38(8):836–846. doi: 10.1002/esp.3355.
- García-Rodríguez MJ, Malpica JA, Benito B, Díaz M. 2008. Susceptibility assessment of earthquake triggered landslides in El Salvador using logistic regression. Geomorphology. 95(3–4):172–191. doi: 10.1016/j.geomorph.2007.06.001.
- Goetz JN, Brenning A, Petschko H, Leopold P. 2015. Evaluating machine learning and statistical prediction techniques for landslide susceptibility modeling. Comput Geosci. 81:1–11. doi: 10.1016/j.cageo.2015.04.007.
- Goetz JN, Cabrera R, Brenning A, Heiss G, Leopold P. 2015. Modelling landslide susceptibility for a large geographical area using weights of evidence in lower Austria, Austria. In: Engineering geology for society and territory. Vol. 2. Cham, Switzerland: Springer International Publishing; p. 927–930. doi: 10.1007/978-3-319-09057-3_160.
- Goetz JN, Guthrie RH, Brenning A. 2011. Integrating physical and empirical landslide susceptibility models using generalized additive models. Geomorphology. 129(3–4):376–386. doi: 10.1016/j.geomorph.2011.03.001.
- Gruber S, Hoelzle M, Haeberli W. 2004. Permafrost thaw and destabilization of Alpine rock walls in the hot summer of 2003. Geophys Res Lett. 31(13):L13504. doi: 10.1029/2004GL020051.
- GSI and NRSC. 2012. National geomorphological and Lineament mapping on 1:50,000 scale, Natural Resources Census Project. Hyderabad: National Remote Sensing Centre, ISRO.
- GSI. 2021. Geological map, Geological Survey of India. Government of India, Kolkata, India. Geologists. 27(1):73–78.
- Guettouche MS. 2013. Modeling and risk assessment of landslides using fuzzy logic. Application on the slopes of the Algerian Tell (Algeria). Arab J Geosci. 6(9):3163–3173. doi: 10.1007/s12517-012-0607-5.
- Gupta K, Satyam N. 2022. Seismically induced Landslide hazard assessment based on the spatial distribution of the slope strength demand in the Western Himalayas. EGU General Assembly; May; Vienna, Austria, EGU22-7328; p. 23–27. doi: 10.5194/egusphere-egu22-7328.
- Guzzetti F,Mondini AC,Cardinali M,Fiorucci F,Santangelo M,Chang KT. 2012. Landslide inventory maps: new tools for an old problem. Earth-Science Reviews 112(1-2):42–66. doi: 10.1016/j.earscirev.2012.02.001. ISSN 0012–8252.
- Guzzetti F, Carrara A, Cardinali M, Reichenbach P. 1999. Landslide hazard evaluation: a review of current techniques and their application in a multi-scale study, central Italy. Geomorphology. 31(1–4):181–216. doi: 10.1016/S0169-555X(99)00078-1.
- Guzzetti F, Reichenbach P, Ardizzone F, Cardinali M, Galli M. 2006. Estimating the quality of landslide susceptibility models. Geomorphology. 81(1–2):166–184. doi: 10.1016/j.geomorph.2006.04.007.
- Guzzetti F. 2002. Landslide hazard assessment and risk evaluation: limits and prospectives. Proceedings of the 4th EGS Plinius Conference; Mallorca, Spain; p. 2–4.
- Hammond C, Hall D, Miller S, Swetick P. 1992. Level I Stability Analysis (LISA) Documentationfor Version 2.0. General Technical Report INT-285, U. S. Dept. of Agriculture, Forest Service, Intermountain Research Station, Moscow, ID; p. 130.
- Heim A, Gansser A. 1939. Central Himalaya geological observations of Swiss.
- Holland TH. 1908. On the occurrence of striated boulders in the Blaini Formation of Simla with a discussion on the geological age of the beds. Rec Geol Surv India. 81:129–185.
- Hong H, Liu J, Bui DT, Pradhan B, Acharya TD, Pham BT, Zhu AX, Chen W, Ahmad BB. 2018. Landslide susceptibility mapping using J48 Decision Tree with AdaBoost, Bagging and Rotation Forest ensembles in the Guangchang area (China). Catena. 163:399–413. doi: 10.1016/j.catena.2018.01.005.
- Huggel C, Salzmann N, Allen S, Caplan-Auerbach J, Fischer L, Haeberli W, Larsen C, Schneider D, Wessels R. 2010. Recent and future warm extreme events and high mountain slope stability. Philos Trans A Math Phys Eng Sci. 368(1919):2435–2459. doi: 10.1098/rsta.2010.0078.
- Hungr O, McDougall S. 2009. Two numerical models for landslide dynamic analysis. Comput Geosci. 35(5):978–992. doi: 10.1016/j.cageo.2007.12.003.
- Hutchinson CM. 1991. A preliminary landslide hazard zonation of the undercliff of the Isle of Wight. London: Slope Stability Engineering, Thomas Telford; p. 197–205.
- Hutchinson JN. 1995. Keynote paper: landslide hazard assessment. In: Bell DH, editor. Landslides. Rotterdam: Balkema; p. 1805–1841.
- Jain AK. 1971. Stratigraphy and tectonics of lesser Himalayan region of Uttarkashi, Garhwal Himalaya. Himal Geol. 1:25–58.
- Jain S, Khosa R, Gosain AK. 2022. Impact of landslide size and settings on landslide scaling relationship: a study from the Himalayan regions of India. Landslides. 19(2):373–385. doi: 10.1007/s10346-021-01794-3.
- Javed IT, Ningsheng C, Regmi AD, Jun L. 2017. Spatial distribution analysis and susceptibility mapping of landslides triggered before and after mw7.8 Gorkha earthquake along upper Bhote Koshi, Nepal. Arab J Geosci. 10(13):1–24.
- Jibson RW. 1989. Debris flows in southern Puerto Rico. In: Schultz AP, Jibson RW, editors. Landslide processes of the eastern United States and Puerto Rico. Geological Society of America Special Paper 236; p. 29–56. doi: 10.1130/SPE236-p29.
- Jomelli V, Pech VP, Chochillon C, Brunstein D. 2004. Geomorphic variations of debris flows and recent climatic change in the French Alps. Clim Change. 64(1/2):77–102. doi: 10.1023/B:CLIM.0000024700.35154.44.
- Juliev M, Mergili M, Mondal I, Nurtaev B, Pulatov A, Hubl J. 2019. Comparative analysis of statistical methods for landslide susceptibility mapping in the Bostanlik District, Uzbekistan. Sci Total Environ. 653:801–814. doi: 10.1016/j.scitotenv.2018.10.431.
- Kainthura P, Sharma N. 2022. Hybrid machine learning approach for landslide prediction, Uttarakhand, India. Sci Rep. 12(1):20101. doi: 10.1038/s41598-022-22814-9.
- Kamp U, Growley BJ, Khattak GA, Owen LA. 2008. GIS-based landslide susceptibility mapping for the 2005 Kashmir earthquake region. Geomorphology. 101(4):631–642. doi: 10.1016/j.geomorph.2008.03.003.
- Kanungo DP, Arora MK, Sarkar S, Gupta RP. 2009. A fuzzy set based approach for integration of thematic maps for landslide susceptibility zonation. Georisk. 3(1):30–43. doi: 10.1080/17499510802541417.
- Kanungo DP, Sarkar S, Sharma S. 2011. Combining neural network with fuzzy, certainty factor and likelihood ratio concepts for spatial prediction of landslides. Nat Hazards. 59(3):1491–1512. doi: 10.1007/s11069-011-9847-z.
- Kanungo DP, Sharma S. 2014. Rainfall thresholds for prediction of shallow landslides around Chamoli-Joshimath region, Garhwal Himalayas, India. Landslides. 11(4):629–638. doi: 10.1007/s10346-013-0438-9.
- Kargel JS, Leonard GJ, Shugar DH, Haritashya UK, Bevington A, Fielding EJ, Fujita K, Geertsema M, Miles ES, Steiner J, et al. 2016. Geomorphic and geologic controls of geohazards induced by Nepal’s 2015 Gorkha earthquake. Science. 351(6269):aac8353. doi: 10.1126/science.aac8353.
- Kayastha P, Dhital MR, De Smedt F. 2012. Landslide susceptibility mapping using the weight of evidence method in the Tinau watershed, Nepal. Nat Hazards. 63(2):479–498. doi: 10.1007/s11069-012-0163-z.
- Kayastha P. 2015. Landslide susceptibility mapping and factor effect analysis using frequency ratio in a catchment scale: a case study from Garuwa sub-basin, East Nepal. Arab J Geosci. 8(10):8601–8613. doi: 10.1007/s12517-015-1831-6.
- Khanduri S. 2017. Landslide hazard around Mussoorie: the Lesser Himalayan tourist destination of Uttarakhand, India. J Geogr Nat Disast. 7(2):1000200. doi: 10.4172/2167-0587.1000200.
- Khandurı S. 2022. Disastrous events of 2021 in Uttarakhand province of India: causes, consequences and suggestions for disaster risk reduction (DRR). IJESKA. 4(2):178–188.
- Kornejady A, Ownegh M, Bahremand A. 2017. Landslide susceptibility assessment using maximum entropy model with two different data sampling methods. Catena. 152:144–162. doi: 10.1016/j.catena.2017.01.010.
- Kumar R, Anbalagan R. 2016. Landslide susceptibility mapping using analytical hierarchy process (AHP) in Tehri reservoir rim region, Uttarakhand. J Geol Soc India. 87(3):271–286. doi: 10.1007/s12594-016-0395-8.
- Larsen MC, Torres Sanchez AJ. 1992. Landslides triggered by hurricane Hugo in eastern Puerto Rico, September 1989. Carib J Sci. 28(3–4):113–125.
- Lee JM. 2004. An efficient algorithm for Naive Bayes with matrix transposition.
- Lee S, Choi J, Min K. 2004. Probabilistic landslide hazard mapping using GIS and remote sensing data at Boun, Korea. Int J Rem Sens. 25(11):2037–2052. doi: 10.1080/01431160310001618734.
- Lee S, Choi J. 2004. Landslide susceptibility mapping using GIS and the weight-of-evidence model. Int J Geogr Inf Sci. 18(8):789–814. doi: 10.1080/13658810410001702003.
- LeForte P. 1975. Himalayas: the collided range. Present Knowledge of the continental arc. Am J Sci. 275A:1–44.
- Li M, Ge D, Liu B, Zhang L, Wang Y, Guo X, Wang Y, Zhang D. 2019. Research on development characteristics and failure mechanism of land subsidence and ground fissure in Xi’an, monitored by using time-series SAR interferometry. Geomat Nat Haz Risk. 10(1):699–718. doi: 10.1080/19475705.2018.1542350.
- Liu CN. 2008. Landslide hazard mapping using Monte Carlo simulation–a case study in Taiwan. In: Liu H, Deng A, Chu J, editors. Geotechnical engineering for disaster mitigation and rehabilitation. Berlin; Heidelberg: Springer. doi: 10.1007/978-3-540-79846-0_14.
- Liu X, Miao C. 2018. Large-scale assessment of landslide hazard, vulnerability and risk in China. Geomat Nat Hazards Risk. 9(1):1037–1052. doi: 10.1080/19475705.2018.1502690.
- Mandal S, Mandal K. 2018. Bivariate statistical index for landslide susceptibility mapping in the Rorachu River Basin of eastern Sikkim Himalaya, India. Spat Inf Res. 26(1):59–75. doi: 10.1007/s41324-017-0156-9.
- Marin RJ, Mattos ÁJ. 2020. Physically-based landslide susceptibility analysis using Monte Carlo simulation in a tropical mountain basin. Georisk. 14(3):192–205. doi: 10.1080/17499518.2019.1633582.
- Mathewson CC, Keaton JR, Santi PM. 1990. Role of bedrock ground water in the initiation of debris flows and sustained post-storm stream discharge. Bull Assoc Eng. XXVII(1):73–83. doi: 10.2113/gseegeosci.xxvii.1.73.
- McDougall S, Hungr O. 2005. Dynamic modelling of entrainment in rapid landslides. Can Geotech J. 42(5):1437–1448. doi: 10.1139/t05-064.
- Metha RL, Koli SR, Koli VR. 2015. Landslide hazard zonation using remote sensing and GIS technology. A case study of landslide prone area near Mahabaleshwar, Maharashtra. Int J Eng Res Gen Sci. 3(4):6–16.
- Micheletti N, Foresti L, Robert S, Leuenberger M, Pedrazzini A, Jaboyedoff M, Kanevski M. 2014. Machine learning feature selection methods for landslide susceptibility mapping. Math Geosci. 46(1):33–57. doi: 10.1007/s11004-013-9511-0.
- Middlemess CS. 1885. A fossiliferous series in the Lower Himalaya in Garhwal. Rec Geol Surv India. 18:73–77.
- Mihaela C, Martin B, Marta CJ, Marius V. 2011. Landslide susceptibility assessment using the bivariate statistical analysis and the index of entropy in the Sibiciu Basin (Romania). Environ Earth Sci. 63:397–406.
- Milaghardan AH, Delavar M, Chehreghan A. 2016. Uncertainty in landslide occurrence prediction using Dempster–Shafer theory. Model Earth Syst Environ. 2(4):1–10. doi: 10.1007/s40808-016-0240-5.
- Misra RC, Sharma RP. 1967. Geology of Devidhura area Almora UP. J Geol Soc India. 8:110–118.
- Montgomery DR, Dietrich WE. 1994. A physically based model for the topographic control on shallow landsliding. Water Resour Res. 30(4):1153–1171. doi: 10.1029/93WR02979.
- Mustafa RM, Pradhan B, Helmi ZMS, Yusoff ZM. 2017. Automatic landslide detection using Dempster–Shafer theory from LiDAR-derived data and orthophotos. Geomat Nat Hazards Risk. 8(2):1935–1954. doi: 10.1080/19475705.2017.1401013.
- Nefeslioglu HA, Sezer E, Gokceoglu C, Bozkir AS, Duman TY. 2010. Assessment of landslide susceptibility by decision trees in the metropolitan area of Istanbul, Turkey. Math Probl Eng. 2010:901095. doi: 10.1155/2010/901095.
- Norouzi Banis Y, Bathurst JC, Walling DE. 2004. Use of caesium-137 data to evaluate SHETRAN simulated long-term erosion patterns in arable lands. Hydrol Process. 18(10):1795–1809. doi: 10.1002/hyp.1447.
- Nsengiyumva JB, Luo G, Amanambu AC, Mind’je R, Habiyaremye G, Karamage F, Ochege FU, Mupenzi C. 2019. Comparing probabilistic and statistical methods in landslide susceptibility modeling in Rwanda/Centre-Eastern Africa. Sci Total Environ. 659:1457–1472. doi: 10.1016/j.scitotenv.2018.12.248.
- Numada M, Konagai K, Ito H, Johansson J. 2003. Material point method for run-out analysis of earthquake-induced long-traveling soil flows.
- Oh HJ, Pradhan B. 2011. Application of a neuro-fuzzy model to landslide-susceptibility mapping for shallow landslides in a tropical hilly area. Comput Geosci. 37(9):1264–1276. doi: 10.1016/j.cageo.2010.10.012.
- Ozdemir A, Altural T. 2013. A comparative study of frequency ratio, weights of evidence and logistic regression methods for landslide susceptibility mapping: sultan Mountains, SW Turkey. J Asian Earth Sci. 64:180–197. doi: 10.1016/j.jseaes.2012.12.014.
- Pachauri AK. 2010. Landslide hazard mapping and assessment in Himalayas. Fifth Int Conf on Recent Advances in Geotechnical Earthquake Engineering and Soil Dynamics; May 24–29; San Diego, CA, USA. http:scholarsmine.mst.edu/icrageesd/05Sicrageesd/session04b/22.
- Pack RT, Tarboton DG, Goodwin CN. 1998. The SINMAP approach to terrain stability mapping. 8th Congress of the International Association of Engineering Geology; Vancouver, Canada.
- Pack RT, Tarboton DG, Goodwin CN. 2001. Assessing terrain stability in a GIS using SINMAP. 15th Annual GIS Conference; Vancouver, British Columbia, Canada.
- Pal M, Mather PM. 2003. An assessment of the effectiveness of decision tree methods for land cover classification. Rem Sens Environ. 86(4):554–565. doi: 10.1016/S0034-4257(03)00132-9.
- Paranunzio R, Laio F, Nigrelli G, Chiarle M. 2015. A method to reveal climatic variables triggering slope failures at high elevation. Nat Hazards. 76(2):1039–1061. doi: 10.1007/s11069-014-1532-6.
- Park NW. 2015. Using maximum entropy modeling for landslide susceptibility mapping with multiple geo environmental data sets. Environ Earth Sci. 73(3):937–949. doi: 10.1007/s12665-014-3442-z.
- Park S, Choi C, Kim B, Kim J. 2013. Landslide susceptibility mapping using frequency ratio, analytic hierarchy process, logistic regression, and artificial neural network methods at the Inje area, Korea. Environ Earth Sci. 68(5):1443–1464. doi: 10.1007/s12665-012-1842-5.
- Parkin G. 1995. [SHETRAN water flow component, equations and algorithms] [Ph.D. thesis]. Newcastle upon Tyne: Newcastle University.
- Pasuto A, Silvano S. 1998. Rainfall as a trigger of shallow mass movements. A case study in the Dolomites, Italy. Environ Geol. 35(2–3):184–189. doi: 10.1007/s002540050304.
- Petley DN, Hearn GJ, Hart A, Rosser NJ, Dunning SA, Oven K, Mitchell WA. 2007. Trends in landslide occurrence in Nepal. Nat Hazards. 43(1):23–44. doi: 10.1007/s11069-006-9100-3.
- Pham BT, Tien Bui D, Dholakia MB, Prakash I, Pham HV. 2016. A comparative study of least square support vector machines and multiclass alternating decision trees for spatial prediction of rainfall-induced landslides in a tropical cyclones area. Geotech Geol Eng. 34(6):1807–1824. doi: 10.1007/s10706-016-9990-0.
- Pham BT, Tien Bui D, Pourghasemi HR, Indra P, Dholakia MB. 2015. Landslide susceptibility assessment in the Uttarakhand area (India) using GIS: a comparison study of prediction capability of naïve bayes, multilayer perceptron neural networks, and functional trees methods. Theor Appl Climatol. 128(1–2):255–273. doi: 10.1007/s00704-015-1702-9.
- Pham BT, Tien Bui D, Prakash I, Dholakia MB. 2015. A comparison study of predictive ability of support vector machine and Naive Bayes tree methods in landslide susceptibility assessment at an area between Tehri Garhwal and Pauri Garhwal, Uttarakhand State (India) using GIS. Proceedings of the National Symposium on Geomatics for Digital India Conventions of ISG & ISRS; Jaipur, India.
- Polykretis C, Chalkias C, Ferentinou M. 2019. Adaptive neuro-fuzzy inference system (ANFIS) modeling for landslide susceptibility assessment in a Mediterranean hilly area. Bull Eng Geol Environ. 78(2):1173–1187. doi: 10.1007/s10064-017-1125-1.
- Pourghasemi HR, Kerle N. 2016. Random forests and evidential belief function‐based landslide susceptibility assessment in Western Mazandaran Province, Iran. Environ Earth Sci. 75:185.
- Pourghasemi HR, Mohammady M, Pradhan B. 2012. Landslide susceptibility mapping using index of entropy and conditional probability models in GIS: Safarood Basin, Iran. Catena. 97:71–84. doi: 10.1016/j.catena.2012.05.005.
- Pourghasemi HR, Rahmati O. 2018. Prediction of the landslide susceptibility: which algorithm, which precision? Catena. 162:177–192. doi: 10.1016/j.catena.2017.11.022.
- Pradhan AM, Kim Y. 2017. Spatial data analysis and application of evidential belief functions to shallow landslide susceptibility mapping at Mt. Umyeon, Seoul, Korea. Bull Eng Geol Environ. 76(4):1263–1279. doi: 10.1007/s10064-016-0919-x.
- Pradhan AMS, Dawadi A, Kim YT. 2012. Use of different bivariate statistical landslide susceptibility methods: a case study of Khulekhani Watershed, Nepal. J Nepal Geol Soc. 44:1–12. doi: 10.3126/jngs.v44i0.24483.
- Pradhan B, Lee S, Buchroithner MF. 2010. A GIS-based backpropagation neural network model and its cross-application and validation for landslide susceptibility analysis. Comput Environ Urban Syst. 34(3):216–235. doi: 10.1016/j.compenvurbsys.2009.12.004.
- Pradhan B, Lee S. 2010. Landslide susceptibility assessment and factor effect analysis: backpropagation artificial neural networks and their comparison with frequency ratio and bivariate logistic regression modelling. Environ Model Softw. 25(6):747–759. doi: 10.1016/j.envsoft.2009.10.016.
- Pradhan B, Youssef AM. 2010. Manifestation of remote sensing data and GIS on landslide hazard analysis using spatial-based statistical models. Arab J Geosci. 3(3):319–326. doi: 10.1007/s12517-009-0089-2.
- Pradhan B. 2010. Landslide susceptibility mapping of a catchment area using frequency ratio, fuzzy logic and multivariate logistic regression approaches. J Indian Soc Remote Sens. 38(2):301–320. doi: 10.1007/s12524-010-0020-z.
- Pradhan B. 2013. A comparative study on the predictive ability of the decision tree, support vector machine and neuro-fuzzy models in landslide susceptibility mapping using GIS. Comput Geosci. 51:350–365. doi: 10.1016/j.cageo.2012.08.023.
- Rai DK, Xiong D, Zhao W, Zhao D, Zhang B, Dahal NM, Wu Y, Baig MA. 2022. An investigation of landslide susceptibility using logistic regression and statistical index methods in Dailekh District, Nepal. Chin Geogr Sci. 32(5):834–851. doi: 10.1007/s11769-022-1304-2.
- Ram P, Gupta V, Devi M, Vishwakarma N. 2020. Landslide susceptibility mapping using bivariate statistical method for the hilly township of Mussoorie and its surrounding areas, Uttarakhand Himalaya. J Earth Syst Sci. 129(1):1–18.
- Regmi AD, Devkota KC, Yoshida K, Pradhan B, Pourghasemi HR, Kumamoto T, Akgun A. 2014. Application of frequency ratio, statistical index, and weights-of-evidence models and their comparison in landslide susceptibility mapping in Central Nepal Himalaya. Arab J Geosci. 7(2):725–742. doi: 10.1007/s12517-012-0807-z.
- Richards A, Argles T, Harris N, Parrish R, Ahmad T, Darbyshire F, Draganits E. 2005. Himalayan architecture constrained by isotopic tracers from clastic sediments. Earth Planet Sci Lett. 236(3–4):773–796. doi: 10.1016/j.epsl.2005.05.034.
- Robinson TR, Rosser NJ, Densmore AL, Williams JG, Kincey ME, Benjamin J, Bell HJA. 2017. Rapid post-earthquake modelling of coseismic landslide magnitude and distribution for emergency response decision support. Nat Hazards Earth Syst Sci Discuss. 17:1521–1540. doi: 10.5194/nhess-2017-83.
- Roşian G, Horváth C, Muntean L, Mihăiescu R, Arghiuş V, Maloş C, Baciu N, Măcicăşan V, Mihăiescu T. 2016. Analysing landslides spatial distribution using GIS. Case study: Transylvanian Plain. Proenvironment. 9:366–372.
- Rossi M, Guzzetti F, Reichenbach P, Mondini AC, Peruccacci S. 2010. Optimal landslide susceptibility zonation based on multiple forecasts. Geomorphology. 114(3):129–142. doi: 10.1016/j.geomorph.2009.06.020.
- Rupke J. 1974. Stratigraphic and structural evolution of the Kumaon Lesser Himalaya. Sediment Geol. 11(2–4):81–265. doi: 10.1016/0037-0738(74)90027-X.
- Saha A, Mandal S, Saha S. 2020. Geo-spatial approach-based landslide susceptibility mapping using analytical hierarchical process, frequency ratio, logistic regression and their ensemble methods. SN Appl Sci. 2(10):1647. doi: 10.1007/s42452-020-03441-3.
- Saha AK, Gupta RP, Sarkar I, Arora MK, Csaplovics E. 2005. An approach for GIS-based statistical landslide susceptibility zonation with a case study in the Himalayas. Landslides. 2(1):61–69. doi: 10.1007/s10346-004-0039-8.
- Salimah A, Hasan R. 2020. Stability analysis and landslide countermeasures using Plaxis2d in the Cigentis Watersheds, Karawang, West Jawa. doi: 10.4108/eai.18-10-2019.2289904.
- Sangeeta, Maheshwari BK. 2019. Earthquake-induced landslide hazard assessment of Chamoli District, Uttarakhand using relative frequency ratio method. Indian Geotech J. 49, 108–123. doi: 10.1007/s40098-018-0334-2.
- Sarkar S, Kanungo D. 2004. An integrated approach for landslide susceptibility mapping using remote sensing and GIS. Photogramm Eng Rem Sens. 70(5):617–625. doi: 10.14358/PERS.70.5.617.
- Sarkar S, Roy AK, Raha P. 2016. Deterministic approach for susceptibility assessment of shallow debris slide in the Darjeeling Himalayas, India. Catena. 142:36–46. doi: 10.1016/j.catena.2016.02.009.
- Searle MP, Simpson RL, Law RD, Parrish RR, Waters DJ. 2003. The structural geometry, metamorphic and magmatic evolution of the Everest massif, High Himalaya of Nepal–south Tibet. J Geol Soc. 160(3):345–366. doi: 10.1144/0016-764902-126.
- Sezer EA, Pradhan B, Gokceoglu C. 2011. Manifestation of an adaptive neuro-fuzzy model on landslide susceptibility mapping: Klang valley, Malaysia. Exp Syst Appl. 38(7):8208–8219. doi: 10.1016/j.eswa.2010.12.167.
- Sharma G, Sanjeevi S. 2015. Landslide hazard zonation using remote sensing, ground penetrating radar surveys and geographical information system in Katteri. Int J Curr Eng Technol. 5(2):1160–1169.
- Sharma LP, Nilanchal P, Ghose MK, Debnath P. 2013. Synergistic application of fuzzy logic and geo-informatics for landslide vulnerability zonation – a case study in Sikkim Himalayas, India. Appl Geomat. 5(4):271–284. doi: 10.1007/s12518-013-0115-7.
- Simon A, Larsen MC, Hupp CR. 1990. The role of soil processes in determining mechanisms of slope failure and hillside development in a humid-tropical forest, Eastern Puerto Rico. Geomorphology. 3(3–4):263–286. doi: 10.1016/0169-555X(90)90007-D.
- Solaimani K, Mousav SZ, Kavian A. 2013. Landslide susceptibility mapping based on frequency ratio and logistic regression models. Arab J Geosci. 6(7):2557–2569. doi: 10.1007/s12517-012-0526-5.
- Srivastava P, Mitra G. 1994. Thrust geometries and deep structure of the outer and lesser Himalaya, Kumaon and Garhwal (India): implications for evolution of the Himalayan fold and thrust belt. Tectonics. 13(1):89–109. doi: 10.1029/93TC01130.
- Steorts RC. 2014. Linear and quadratic discriminant analysis; p. 1–21.
- Sur U, Singh P, Meena SR. 2020. Landslide susceptibility assessment in a lesser Himalayan road corridor (India) applying fuzzy AHP technique and earth-observation data. Geomat Nat Hazards Risk. 11(1):2176–2209. doi: 10.1080/19475705.2020.1836038.
- Suzen ML, Doyuran V. 2004. Data driven bivariate landslide susceptibility assessment using geographical information systems: a method and application to Asarsuyu catchment, Turkey. Eng Geol. 71(3–4):303–321. doi: 10.1016/S0013-7952(03)00143-1.
- Süzen ML, Kaya B. 2012. Evaluation of environmental parameters in logistic regression models for landslide susceptibility mapping. Int J Digit Earth. 5(4):338–355. doi: 10.1080/17538947.2011.586443.
- Tang Y, Feng F, Guo Z, Feng W, Li Z, Wang J, Sun Q, Ma H, Li Y. 2020. Integrating principal component analysis with statistically-based models for analysis of causal factors and landslide susceptibility mapping: a comparative study from the Loess Plateau Area in Shanxi (China). J Clean Prod. 277:124159. doi: 10.1016/j.jclepro.2020.124159.
- Tanoli JI,Chen N,Regmi A,Jun L. 2017. Spatial distribution analysis and susceptibility mapping of landslides triggered before and after Mw7.8 Gorkha earthquake along upper Bhote Koshi, Nepal. Arabian J. Geosci. doi: 10.10.1007/s12517-017-3026-9.
- Tien Bui D, Pradhan B, Lofman O, Revhaug I. 2012. Landslide susceptibility assessment in Vietnam using support vector machines, decision tree, and Naive Bayes models. Math Probl Eng. 2012:974638. doi: 10.1155/2012/974638.
- Tien Bui D, Tuan TA, Klempe H, Pradhan B, Revhaug I. 2016. Spatial prediction models for shallow landslide hazards: a comparative assessment of the efficacy of support vector machines, artificial neural networks, Kernel logistic regression, and logistic model tree. Landslides. 13(2):361–378. doi: 10.1007/s10346-015-0557-6.
- Tiwari VN, Pandey VHR, Kainthola A, Singh PK, Singh KH, Singh TN. 2020. Assessment of Karmi Landslide Zone, Bageshwar, Uttarakhand, India. J Geol Soc India. 96(4):385–393. doi: 10.1007/s12594-020-1567-0.
- Trigila A, Iadanza C, Esposito C, Scarascia Mugnozza G. 2015. Comparison of logistic regression and random forests techniques for shallow landslide susceptibility assessment in Giampilieri (NE Sicily, Italy). Geomorphology. 249:119–136. doi: 10.1016/j.geomorph.2015.06.001.
- Turner AK, Schuster RL. 1996. Landslides: investigation and mitigation. Special Report 247. Washington (DC): Transportation Research Board, The National Academies Press.
- Vahidnia MH, Alesheikh AA, Alimohammadi A, Hosseinali F. 2010. A GIS-based neuro-fuzzy procedure for integrating knowledge and data in landslide susceptibility mapping. Comput Geosci. 36(9):1101–1114. doi: 10.1016/j.cageo.2010.04.004.
- Vakhshoori V, Zare M. 2016. Landslide susceptibility mapping by comparing weight of evidence, fuzzy logic, and frequency ratio methods. Geomat Nat Hazards Risk. 7(5):1731–1752. doi: 10.1080/19475705.2016.1144655.
- Valdiya KS. 1979. Outline of the structure of the Kumaun Himalaya. J Geol Soc India 20:147–157.
- Valdiya KS. 1980. Geology of Kumaun Lesser Himalaya, Interim Record: Dehradun, Wadia Institute of Himalayan Geology.
- Van Westen CJ. 1997. Statistical landslide hazard analysis, ILWIS 2.1 for Windows application guide. Enschede: ITC Publication; p. 73–84.
- Varnes DJ, IAEG. 1984. Commission on landslide and other mass movement on slopes, landslide hazard zonation: a review of principles and practice. Paris: The UNESCO Press; p. 63.
- Varnes DJ. 1978. Slope movement types and processes. In: Schuster RL, Krizek RJ, editors. Special report 176: landslides: analysis and control. Washington (DC): Transportation and Road Research Board, National Academy of Science; p. 11–33.
- Vijith H, Madhu G. 2008. Estimating potential landslide sites of an upland sub-watershed in Western Ghat’s of Kerala (India) through frequency ratio and GIS. Environ Geol. 55(7):1397–1405. doi: 10.1007/s00254-007-1090-2.
- Vorpahl P, Elsenbeer H, Märker M, Schröder B. 2012. How can statistical models help to determine driving factors of landslides? Ecol Model. 239:27–39. doi: 10.1016/j.ecolmodel.2011.12.007.
- Wang Y, Fang Z, Hong H. 2019. Comparison of convolutional neural networks for landslide susceptibility mapping in Yanshan County, China. Sci Total Environ. 666:975–993. doi: 10.1016/j.scitotenv.2019.02.263.
- Watari M. 1986. Mechanism and mitigation measures of slope disasters. Sankaido, Japan Landslide Society; p. 170.
- Weidner L, DePrekel K, Oommen T, Vitton S. 2019. Investigating large landslides along a river valley using combined physical, statistical, and hydrologic modeling. Eng Geol. 259:105169. doi: 10.1016/j.enggeo.2019.105169.
- Wilson RC, Torikai JD, Ellen SD. 1992. Development of rainfall warning thresholds for debris flows in the Honolulu District, Oahu. U.S. Geological Survey Open-File Report 92-521; p. 45.
- Wu W, Sidle RC. 1997. Application of a distributed shallow landslide analysis model (dSLAM) to managed forested catchments in Oregon, USA.
- Yalcin A, Reis S, Aydinoglu AC, Yomralioglu T. 2011. A GIS-based comparative study of frequency ratio, analytical hierarchy process, bivariate statistics and logistics regression methods for landslide susceptibility mapping in Trabzon, NE Turkey. Catena. 85(3):274–287. doi: 10.1016/j.catena.2011.01.014.
- Yesilnacar E, Topal T. 2005. Landslide susceptibility mapping: a comparison of logistic regression and neural networks methods in a medium scale study, Hendek region (Turkey). Eng Geol. 79(3–4):251–266. doi: 10.1016/j.enggeo.2005.02.002.
- Yilmaz I, Keskin I. 2009. GIS based statistical and physical approaches to landslide susceptibility mapping (Sebinkarahisar, Turkey). Bull Eng Geol Environ. 68(4):459–471. doi: 10.1007/s10064-009-0188-z.
- Yilmaz I. 2010. Comparison of landslide susceptibility mapping methodologies for Koyulhisar, Turkey: conditional probability, logistic regression, artificial neural networks, and support vector machine. Environ Earth Sci. 61(4):821–836. doi: 10.1007/s12665-009-0394-9.
- Yin A. 2005. Cenozoic evolution of the Himalayan orogen as constrained by a long-strike variations of structural geometry, exhumation history, and foreland sedimentation. Earth Sci Rev. 76(1–2):1–131. ISSN 0012-8252. doi: 10.1016/j.earscirev.2005.05.004.
- Youssef AM, Pourghasemi HR, Pourtaghi ZS, Al Katheeri MM. 2016. Landslide susceptibility mapping using random forest, boosted regression tree, classification and regression tree and general linear models and comparison of their performance at Wadi Tayyah Basin, Asir Region, Saudi Arabia. Landslides. 13(5):839–856. doi: 10.1007/s10346-015-0614-1.
- Zhang T, Han L, Chen W, Shahabi H. 2018. Hybrid integration approach of entropy with logistic regression and support vector machine for landslide susceptibility modelling.