
 ?Mathematical formulae have been encoded as MathML and are displayed in this HTML version using MathJax in order to improve their display. Uncheck the box to turn MathJax off. This feature requires Javascript. Click on a formula to zoom.
Abstract
The formulation of nationwide goals, strategic plans, and specifically zoned areas for typhoon hazard mitigation and prevention is paramount for addressing the threat in a spatially explicit manner. Utilizing historical rainfall and wind speed data associated with typhoon disasters in the Northwest Pacific and South China Sea from 1949 to 2017, we proposed a comprehensive typhoon hazard zoning delineated based on the assessment of typhoon disaster risks, considering hazard-causing factors, hazard-formative environments, and hazard-bearing bodies through an Analytic Hierarchy Process. High-risk areas were primarily located in the coastal regions of South and Southeast China. Medium-risk areas were situated in the Yangtze River Delta and towns adjacent to Bohai Bay. Low-risk areas were primarily located in the central region of Guangxi, the Guangdong-Hong Kong-Macao Greater Bay Area, the vicinity of Fuzhou, the majority of southern Jiangsu and northern Zhejiang, all of Shanghai, the northern and southern parts of the Shandong Peninsula, the area around Bohai Bay in Tianjin, a minor portion of Hebei, and the three northeastern provinces. Appropriate mitigation measures were proposed to address the threats posed by typhoons in these regions. This information is instrumental in providing reliable support for China in addressing the challenges posed by typhoons.
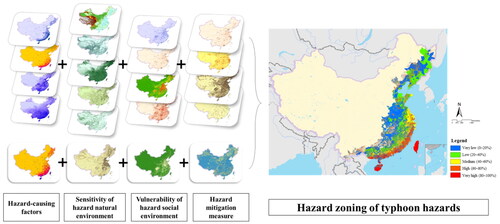
Graphical Abstract
Highlights
The risk associated with typhoon hazards was evaluated utilizing the Analytic Hierarchy Process (AHP) method.
Contributing factors and the prevailing environment were incorporated into the risk assessment.
The delineation of hazard zones for typhoons across China was conducted through Geographic Information System (GIS) technology.
Zoning for resilient cities was established, with considerations for climate change, to fortify urban areas against the impacts of typhoon hazards.
1. Introduction
Typhoons are among the costliest extreme weather hazards, presenting a significant climate challenge globally (Heidarzadeh et al. Citation2023). Particularly, as a country situated along the western Pacific Ocean, China is frequently affected by these storm systems. Between 1949 and 2017, the Northwest Pacific Ocean and the South China Sea experienced over 1,600 typhoons, averaging 25 annually, the majority of which made landfall in China, causing considerable damage (Yao et al. Citation2020). Typically characterized by widespread heavy precipitation and strong winds, typhoons often lead to severe damage to fisheries, agriculture, water facilities, and urban infrastructure (Guo et al. Citation2017; Wang et al. Citation2016). Direct economic losses attributed to typhoons have escalated from an average of approximately 10 billion yuan per year in the 1990s to 30 billion yuan in the early twenty first century (Duan et al. Citation2012). The challenges are amplified in the context of global climate change (Heidarzadeh et al. Citation2018, Citation2021; Heidarzadeh and Rabinovich Citation2021; Le et al. Citation2019), with numerous models suggesting that a rise in sea surface temperature could intensify typhoons, potentially increasing the frequency of storms in specific ocean basins (Knutson et al. Citation2015; Lei Citation2011; Mendelsohn et al. Citation2012; Wu et al. Citation2014). Scholars have delved into the evolving patterns and regional distribution characteristics of typhoon landfalls in China across varying time scales, employing evaluation indicators like wind speed and precipitation intensity (Cai et al. Citation2018; Qi and Du Citation2018; Yin et al. Citation2013). Alongside the research on typhoon patterns per se, that focused on typhoon hazard mitigation in China has also drawn consistent attention from both government agencies and the academic community, attributable to the nation’s prolonged vulnerability to such hazards (Dinan Citation2017; Li et al. Citation2016; Ye et al. Citation2011), which requires the scrutiny not only for typhoon’s inherent risks (such as path and intensity) but also for the susceptibility of the impacted regions (Peduzzi et al. Citation2012). This includes considerations of ecosystem status (Lange et al. Citation2016), population density (Zhang et al. Citation2021), economic development level (X. Xu et al. Citation2015), and urban mitigation capacity (Revi Citation2008). In assessing environmental vulnerability, research has approached regional typhoon hazard exposure through the lens of ecosystem sensitivity and urban response, quantifying shifts in regional vulnerability via socio-economic and ecological indicators (Wang et al. Citation2016; Yin et al. Citation2015). Various methodologies, including monitoring, remote sensing, and statistical data, have been integrated into typhoon hazard assessments, with multivariate joint probability analyses conducted to formulate assessment models (Kuo and Lu Citation2013). These models often incorporate a spectrum of causative factors such as extreme wind speeds and rainfall, with a primary focus on statistical meteorology and the potential impacts on populations and economic assets (Conte and Kelly Citation2018; H. Xu et al. Citation2018).
From a spatial planning perspective, the above-synthesized studies have explicit implications. Indeed, one of the present emphases in China’s territorial planning is on enhancing the safety and resilience of urban systems (Shi et al. Citation2021; Si et al. Citation2021). Improving the resilience, adaptability, and recuperative capacity of cities in the face of disasters is imperative in construction projects, necessitating the fortification of rational regulation and guidance within territorial planning (Johnson and Blackburn Citation2014). For refining the calibration of planning development and execution, the formulation of a scientifically robust and comprehensive natural disaster mitigation system is instrumental in diminishing the likelihood of cascading urban damage (Eadie Citation2019; Jones Citation2001). Consequently, a thorough assessment of typhoon disasters, grounded in historical data, furnishes critical insights for the evolution of disaster resilience and management and establishes a vital framework for governmental steering of disaster prevention and mitigation initiatives in the national territorial planning (Y. Feng and Xiang-Yang Citation2018; Shultz et al. Citation2018). Nonetheless, the majority of existing studies have executed typhoon hazard zoning at provincial or municipal levels, rather than a national scale. Furthermore, numerous evaluation models have overlooked aspects such as causative factors, gestation, disaster-bearing bodies, and hazard mitigation strategies (Yin et al. Citation2013), and thus a comprehensive analytical framework is needed.
In light of the knowledge gaps, this study proposes a methodological framework that delineates a comprehensive typhoon hazard zoning for China which bases itself on historical data. Incorporating meteorological, ecological, and diverse sociometric historical data, and considering an array of factors influencing typhoon hazards such as hazard-inducing elements, hazard-formative environments, hazard-bearing entities, and disaster resilience simultaneously, the method utilizes the Analytic Hierarchy Process (AHP) to establish a multi-indicator typhoon hazard zoning model and recommends specialized strategies for different hazard zones hence yielded with a particular focus on high-risk areas. Notably, the research introduces resilient city zoning, taking climate change into account, to strengthen urban areas against the impacts of typhoons. The study’s distinctive feature lies in its holistic approach, blending AHP, GIS, historical typhoon data, and climate change considerations, offering not just a comprehensive assessment of current risks but also a forward-looking framework for enhancing urban resilience.
2. Methodology
2.1. Data sources
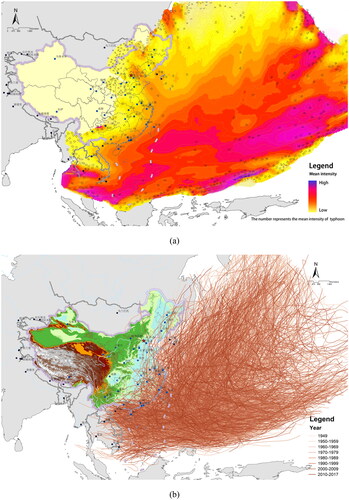
Historical typhoon track data for the Western Pacific and South China Sea regions were sourced from the Northwest Pacific Basin Tropical Cyclone Data Center of the China Meteorological Administration (http://tcdata.typhoon.org.cn/). This dataset, spanning from 1949 to 2017, included records commencing in 1825. It encompassed the 6-hourly track of the typhoon center (longitude and latitude), central minimum pressure information, and typhoon wind strength details. Additionally, the dataset contained the typhoon number, typhoon name, standard time code of date and time, latitude (0.1°N), longitude (0.1°E), minimum pressure near the tropical cyclone center (hPa), and 2-min average sustained wind (m/s). To verify the range affected by typhoons, historical daily wind and rain data from 1949 to 2017 were acquired from 577 weather stations at the National Climate Center of the China Meteorological Administration (CMA) (http://bcc.ncc-cma.net/), encompassing all typhoon paths. Within this range, data on wind speed, high wind frequency, and rainfall were procured (Ying et al. Citation2014). illustrates the mean intensity of typhoon monitoring points and the spatial distribution of typhoon paths from 1949 to 2017, based on the tropical cyclone database of the China Meteorological Administration. This dataset serves as a cornerstone for the article’s model, offering essential historical data crucial for developing a comprehensive multi-indicator typhoon hazard zoning model. It enables the identification of specialized strategies tailored to distinct hazard zones, with a particular emphasis on high-risk areas. Furthermore, the dataset supports accurate prediction and simulation, providing invaluable insights that can significantly inform future territorial planning and the formulation of urban disaster prevention and mitigation strategies.
Figure 1. Typhoon mean intensity and paths based on historical data from 1949 to 2017: (a) the mean intensity distribution of typhoon monitoring points from 1949 to 2017; (b) the typhoon paths from 1949 to 2017.
2.2. Methods
Under standard conditions, typhoon hazards arise from the interplay among hazard-inducing factors, the formative environment, and exposure. Consequently, a thorough typhoon hazard assessment necessitates considering both the environment’s sensitivity and vulnerability, along with the dynamic mechanisms of the hazard chain. Numerous meteorological studies have scrutinized the formation and associative mechanisms of hazard-inducing factors, emphasizing elements such as elevated sea levels, sustained storm surge gains, and astronomical tides, which amplify the disaster risk associated with typhoon landfall (Almazan et al. Citation2019; L. Feng and Luo Citation2011; Wang et al. Citation2016). In selecting quantitative evaluation indicators, various factors have been contemplated by scholars to assess typhoon hazards (Cutter et al. Citation2008; Gallina et al. Citation2016). Nonetheless, these studies either overlooked the sensitivity of geographic and environmental factors or analyzed them independently, neglecting regional characteristics in disaster assessment. Typhoons manifest as a multifaceted system influenced by myriad factors at a regional scale (Knutson et al. Citation2010). In this study, we employed national-scale time-series data to capture the cumulative impact of typhoons in China. The selection of typhoon impact factors was guided by the works of Yin et al. (Citation2013), Wang et al. (Citation2016), and Hernández et al. (Citation2018). Focusing on representativeness and comprehensiveness, we identified hazard-inducing factors, sensitivity of the natural environment, vulnerability of the social environment, and disaster resilience as the principal determinants of typhoon disasters. Consequently, a four-tiered typhoon disaster assessment model comprising the destination level, affected level, index level, and subindex level was developed ().
Figure 2. Typhoon disaster assessment model.
Notes: The addition and subtraction signs near the index represent the positive and negative correlation indexes, respectively.
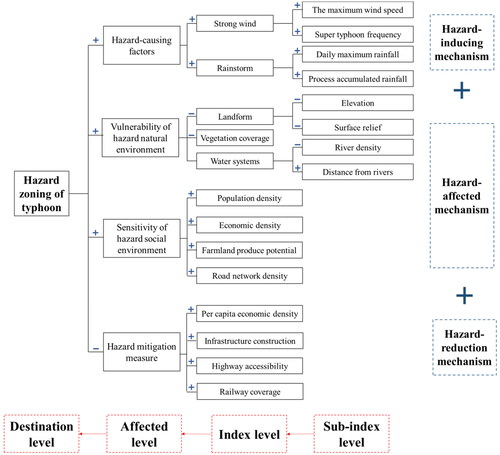
Type of hazard-inducing factor: The intense wind and rain associated with typhoons can result in heightened hazards. Accordingly, the hazard-inducing factors account for the typhoon’s peak wind speed, the occurrence of severe typhoons, cumulative precipitation, and maximum daily precipitation. As the wind speed, frequency of severe typhoons, and precipitation increase, so does the risk and vulnerability to typhoon-related disasters.
Type of Natural Hazard Environment: The causative factors are pivotal in shaping typhoon hazards, and variations in regional geographic patterns contribute to differing levels of exposure and vulnerability, thereby rendering the hazard-formative environment a key determinant of hazard risk. This environment takes into account topography, vegetation cover, and water system conditions. Areas characterized by lower elevation, flatter topography, denser river networks, and proximity to water bodies exhibit increased environmental sensitivity and a higher risk of flooding. Conversely, regions with abundant vegetation cover demonstrate enhanced ecological stability, greater resilience to typhoon effects, reduced propensity for surface runoff formation, and diminished sensitivity.
Type of Hazardous Social Environment: Beyond the influence of natural factors, assessments of towns and villages as entities bearing disaster risks must also take into account their levels of socioeconomic development. Losses incurred from typhoons are typically quantified in terms of impacts on crops, population, and the economy. The higher the exposure of the entities bearing disaster risks, the more substantial the corresponding losses. Consequently, four indicators were selected to represent the vulnerability of population, production, and land: population density, economic density, average farmland production potential, and sub-county road network density. Higher values of these indicators—population density, economic density, and farmland production potential, along with road network density—correlate with increased losses in the event of a typhoon.
Type of Disaster Resilience: The resilience level signifies the preparedness of cities and towns in the face of typhoons. Variables such as GDP per capita, infrastructure development, and road network accessibility are indicative of urban resilience and robustness. Municipalities characterized by robust economies, comprehensive infrastructure, developed transportation networks, and easy accessibility usually demonstrate strong overall urban vitality. Typically, these areas are equipped with a series of emergency plans and systematic measures constituting their disaster prevention and rescue systems.
Regarding the assignment of indicator weights in hierarchical models, a plethora of weight determination methods are prevalently employed. These methods aim to elucidate relationships by contrasting the relative significance of two factors, incorporating techniques such as expert scoring methods, the Analytical Hierarchy Process (AHP), and gray correlation models. A thorough review of existing literature, including works by Niu et al. (Citation2011), Yin et al. (Citation2013), Wang et al. (Citation2016), and Hernández et al. (Citation2018) informed the determination of reasonable indicator in this study, as detailed in . The weights of the indicators were determined through an expert questionnaire. Causal factors emerge as paramount determinants of typhoon disasters, with strong winds and heavy rainfall leading to considerable losses. In particular, maximum daily rainfall poses a risk of urban flooding, jeopardizing the lives and properties of residents. The sensitivity of the hazard-inducing environment, the vulnerability of the social environment, and disaster resistance are deemed to be of equivalent importance.
Table 1. The indicators in the typhoon hazard assessment model.
To achieve index quantification and establish a standard, we employed linear transformation for raw data normalization. This step was crucial to eliminating the dimensions of indicators and aligning the orders of magnitude. It is observed that a higher value of the positive correlation index results in an elevated comprehensive index value; conversely, a negative correlation index displays an inverse trend. Consequently, utilizing the subsequent formula ensures that the index value is confined within the 0 to 1 range, and all standardized index values maintain a uniform direction.
(1)
(1)
(2)
(2)
where
is the standardized value of index level
in affected level
is the value of index level
in affected level
and
are the minimum and maximum values of index level
respectively, and
and
are positive and negative correlation indexes, respectively.
According to , weighted values in the affected level and index level were calculated, and the formula is as follows:
(3)
(3)
where
is the total number of index levels considered in the calculation,
is the index weight of index level
in affected level
and Z is the comprehensive hazard index of typhoon hazard, that is, the sum of all index levels in each affected level; the higher the value is, the higher the risk is.
2.3. Data processing
Initially, we transformed the raw monitoring point data of typhoons and rainfall into spatial polygon data utilizing the kriging interpolation method in ArcGIS across all index layers. The calculation of a comprehensive risk index necessitates the superposition of index layers corresponding to various disaster levels, ensuring compatibility between different layers. Utilizing the spatial analysis tool of ArcGIS, we aggregated the values of diverse factors. Subsequently, the characteristics of each disaster layer were represented in a novel layer, designated as the national typhoon disaster comprehensive evaluation index layer. Given the high precision of the original vector data and the accuracy of the raster data not surpassing 1 km2, the risk assessment model for typhoon disasters was distinguished by its high accuracy and rationality. We employed the natural break (Jenks) classification method to attain accurate visualization results, categorizing the integrated hazard values into five classes: very high-risk zone, high-risk zone, medium-risk zone, low-risk zone, and very low-risk zone. Lastly, to preserve the integrity of cellular space patterns, the connectivity of image elements in the raster was calculated based on the values of their eight neighboring image elements, using the majority filter (mode filter) tool. After several iterations of the majority filter, the output raster achieved stability and exhibited a smoother appearance, facilitating the observation of differentiation at the national scale.
3. Results
3.1. Results from AHP and expert questionnaires
Based on AHP and expert questionnaires, we established the indicator system and weights for the typhoon hazard assessment model. shows the statistics of questionnaire results and the computed weights for the indices. The computed values for both the Consistency Index (CI) and the Consistency Ratio (CR) in the judgment matrix are below 0.1. This implies that the consistency test for the judgment matrix is satisfied, and the calculated weights exhibit consistency (further details can be found in the supplementary materials).
Table 2. Statistics of questionnaire results and index weights.
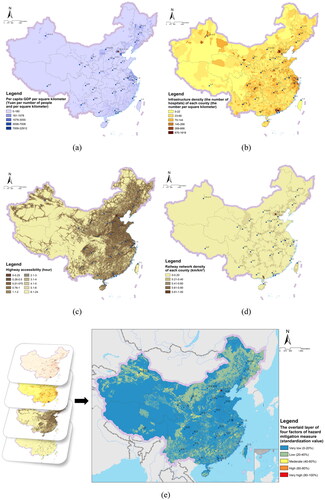
3.2. Zoning based on hazard-causing factors
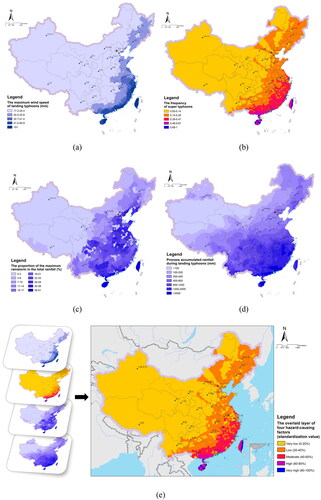
According to typhoon data for the Northwest Pacific and South China Sea from 1949 to 2017, areas subjected to high wind speeds and frequent super typhoons were predominantly located in the coastal regions of South and East China, specifically in Taiwan, Guangdong, and Hainan Provinces. The external impact areas of typhoons were centralized in Central and Northeast China (). When integrated with the data on maximum daily and cumulative precipitation (), a consistent geographical correlation between heavy rainfall and strong winds was discerned. Due to the abundance of mountainous terrains in northern and northwestern China, the majority of the areas affected by typhoons were categorized within the third-order terrain. Furthermore, cities situated along flared estuaries and harbor areas on the coastline were more susceptible to storm surges. , superimposed on the hazard-causing factor layer, illustrates the spatial distribution characteristics, exhibiting a downward trend from southeast to northwest. With the exception of Hebei Province and Tianjin City, nearly all cities in the coastal provinces, including Guangdong, Taiwan, Hainan, Fujian, and Zhejiang, were categorized as high- and very high-risk areas impacted by typhoons. Conversely, inland provinces like Jiangxi, Hunan, Hubei, Anhui, Henan, and Shanxi faced lower risk levels, primarily influenced by rainfall intensity and precipitation.
Figure 3. Zoning based on hazard-causing factors in China: (a) the maximum wind speed of landing typhoons from 1949 to 2017 (m/s); (b) the frequency of super typhoons per year from 1949 to 2017; (c) the proportion of the maximum rainstorm in the total rainfall in each city from 1961 to 2015 (%); (d) Process accumulated rainfall during landing typhoons from 1961 to 2017 (mm); (e) the overlaid layer of four hazard-causing factors (standardized value).
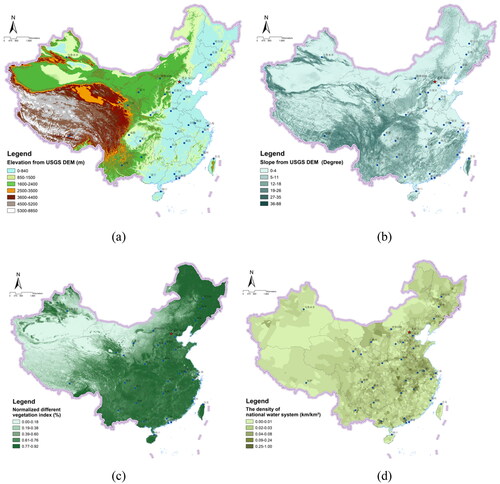
3.3. Zoning based on the sensitivity of the hazard-formative environment
From a geographical perspective, the sensitivity of the hazard-formative environment pertains to areas affected by typhoons. As depicted in , the overall region exhibited pronounced regional characteristics. Areas demonstrating very high sensitivity include the Shandong Peninsula, Jiangsu, Zhejiang, Shanghai, and the vicinities of Wuhan and Nanchang cities. Conversely, the coastal regions of Hainan, Guangdong, and Fujian manifested high sensitivity. The central region displayed moderate sensitivity, predominantly encompassing areas in eastern, northeastern, and central China. The Yellow and Huaihai Plain, characterized by its wealth of rivers and lush vegetation, represents an economically advanced and densely populated region in China. It has witnessed the swift progression of plain towns, yet it is also subjected to frequent droughts and floods.
Figure 4. Zoning based on the sensitivity of hazardous natural environments in China: (a) elevation from USGS DEM (mapping precision: 100 m) in 2017 (m); (b) slope from USGS DEM (mapping precision: 100 m) in 2017 (degree); (c) normalized difference vegetation index in 2015 (%); (d) the density of national water system in 2017 (km/km2); (e) the distance from the rivers and Lakes based on landform (km); (f) the overlaid layer of five factors of natural hazard environment (standardized value).
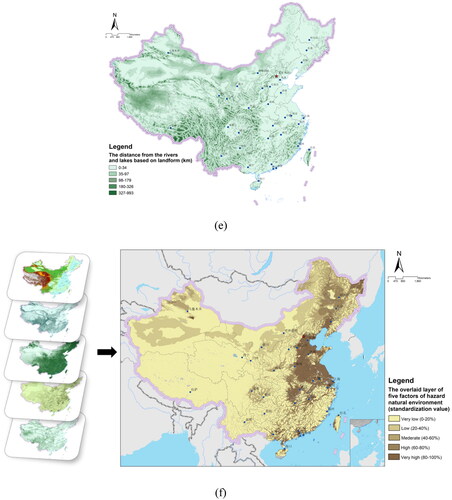
3.4. Zoning based on the vulnerability of the hazardous social environment
The vulnerability of the entity bearing the disaster is correlated with the losses and damages ensuing from the typhoon hazard chain. As depicted in , the vulnerability of the said entity demonstrated a spatial zoning trend analogous to the sensitivity of the hazard-formative environment. The Yellow and Huaihai Plains, critical granaries, were identified as highly vulnerable areas. Regions such as Sichuan, Chongqing, southern Henan, and western Anhui exhibited high vulnerability, whereas areas of low vulnerability were primarily situated in northeastern China. This includes developed regions characterized by dense populations, extensive urbanization, and advanced agriculture and industry, rendering the built environment more susceptible to natural hazards compared to other regions.
Figure 5. Zoning based on the vulnerability of hazardous social environment in China: (a) population density per square kilometer in 2015 (number of people per square kilometer); (b) economic density per square kilometer in 2015 (GDP per square kilometer); (c) Farmland produce potential from global agro-ecological zones in 2015 (kg/ha); (d) road network density of each county from Google map in 2018 (km/km2); (e) the overlaid layer of four factors of hazard social environment (standardized value).
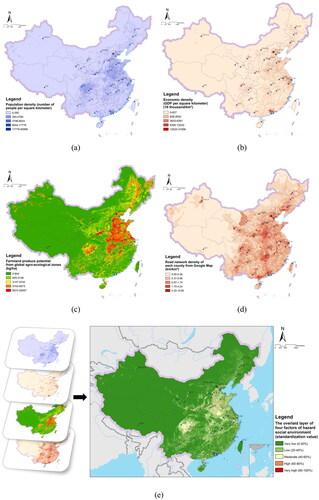
3.5. Zoning based on disaster resilience
The resilience of a city is directly proportional to the number of disaster mitigation measures it implements. illustrates those regions with high GDP per capita consistently correspond to developed cities and provincial capitals, characterized by advanced urban infrastructure and convenient transportation. These cities, with their competitive edge, allocate substantial financial investments towards enhancing disaster resilience and mitigation. Conversely, regions with fewer disaster mitigation measures tend to be less developed, often situated in geographical challenges such as mountainous areas.
Figure 6. Regionalization based on hazard mitigation measures in China: (a) per capita GDP per square kilometer in 2015 (yuan per number of people and square kilometer); (b) infrastructure density (the number of hospitals) of each county from Google Maps in 2018 (the number per square kilometer); (c) highway accessibility in 2018 (h); (d) railway network density of each county from Google Maps in 2018 (km/km2); (e) the overlaid layer of four factors of hazard mitigation measures (standardized value).
3.6. Comprehensive typhoon hazard zoning in China
The standardized indicators of the impact layer were overlaid in accordance with their weights to execute comprehensive typhoon hazard zoning (). On a national scale, there was a discernible trend in typhoon impact zones; the risk level of typhoon hazards progressively diminished from the east to the northwest. Areas with a moderate or higher risk level were predominantly situated in the coastal regions of South and Southeast China, the Yangtze River Delta, and towns adjacent to Bohai Bay. Coastal regions such as Hainan, Guangdong, Guangxi, Fujian, Jiangsu, Shanghai, and Zhejiang were under severe threat. However, some inland areas, characterized by low resilience, high sensitivity, and vulnerability, including Shandong, Hunan, Jiangxi, Anhui, and Liaoning, distanced from the coast, were susceptible to typhoons of varying intensities. A detailed analysis of typhoon hazards at divergent risk levels is delineated in the subsequent sections.
Figure 7. Comprehensive hazard zoning of typhoon hazards in China.
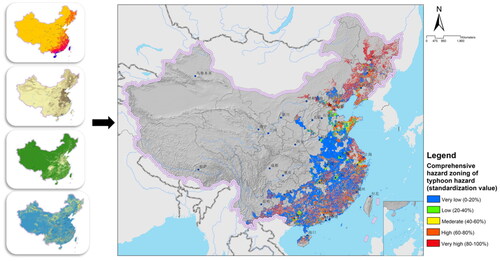
Very High-Risk Areas: The principal areas impacted encompassed most of Fujian, coastal Jiangsu, central Hainan, western Guangxi, southern Guangdong, northwestern and eastern Jiangxi, northeastern Hubei and Hunan, southern Yunnan, and the majority of small towns in southeastern Zhejiang. Concurrently, numerous inland cities remained unthreatened by typhoon hazards. This is attributable to the fact that high-risk coastal areas generally exhibit high sensitivity and vulnerability and are characterized by significant population density, extensive built-up areas, economic development, and vast farmland. Most of these areas are located in plains with dense river networks, exhibiting high environmental sensitivity and limited disaster prevention and mitigation capacity, which culminates in a significantly elevated risk of post-typhoon damage. illustrates that Northeast China, despite being distant from typhoon landfalls, contained many high-risk areas and was susceptible to hazards owing to the absence of typhoon-resistant urban infrastructure. For instance, in August 2016, three severe super typhoons, namely ‘Lionrock,’ ‘Kompasu,’ and ‘Namtheun,’ made landfall in China, inflicting extensive casualties and property damage in both coastal and northeastern regions.
High- and Medium-Risk Areas: Both categories exhibited similar spatial distributions, predominantly located in the Shandong Peninsula, eastern Hebei and Tianjin, central Guangxi, northern Zhejiang, several coastal areas in southern China, and inland cities such as Wuhan, Changsha, Nanchang, Nanning, and Guiyang. In comparison to high-risk areas, these regions demonstrated elevated hazard-causing risks and increased vulnerability. However, a lower disaster prevention and mitigation capacity, particularly in the provincial capitals of inland provinces, was more prevalent in these areas compared to surrounding towns and cities possessing more comprehensive and robust disaster mitigation systems. Consequently, the comprehensive risk was deemed moderate.
Low-Risk Areas: These areas were primarily situated in the central region of Guangxi, the Guangdong-Hong Kong-Macao Greater Bay Area, the vicinity of Fuzhou, the majority of southern Jiangsu and northern Zhejiang, all of Shanghai, the northern and southern parts of the Shandong Peninsula, the area around Bohai Bay in Tianjin, a minor portion of Hebei, and the three northeastern provinces. While these areas manifested a medium to low level of hazard-causing risk, they exhibited a heightened level of environmental sensitivity and vulnerability, particularly in townships surrounding the provincial capitals. These areas typically possessed relatively inferior disaster prevention and protection capabilities, rendering the overall risk as low.
Very Low-Risk Areas: Given the extensive range of typhoon influence, areas classified as very low-risk were predominantly located in Central China and certain inland regions of coastal provinces. These areas commonly exhibited a low likelihood of hazard occurrence, heightened sensitivity to disaster-prone environments, increased vulnerability in socio-environmental contexts related to hazards, and a minimal degree of hazard mitigation measures, resulting in an aggregate risk that was notably low.
The comprehensive typhoon hazard zoning, particularly in very high-risk areas, exhibits a strong correlation with the destructive impact of some of the most damaging typhoons in the mentioned regions. High-risk coastal areas, characterized by high sensitivity, vulnerability, and limited disaster prevention capacity, closely align with regions prone to severe typhoon impact. A notable example is seen in the severe super typhoons ‘Lionrock,’ ‘Kompasu,’ and ‘Namtheun’ in August 2016, which made landfall in China. These typhoons significantly affected areas identified as very high-risk, including most of Fujian, coastal Jiangsu, central Hainan, western Guangxi, southern Guangdong, northwestern and eastern Jiangxi, northeastern Hubei and Hunan, southern Yunnan, and the majority of small towns in southeastern Zhejiang. The observed casualties and extensive property damage in both coastal and northeastern regions substantiate the correlation between the very high-risk areas identified in the typhoon hazard zoning and the actual impact of these destructive typhoons. This zoning also aligns with the concept that areas with high population density, extensive built-up areas, economic development, and vast farmland in plains with dense river networks are at an elevated risk of post-typhoon damage. Such characteristics are evident in the identified high-risk and very high-risk areas, particularly in the coastal regions of South and Southeast China.
4. Discussion
4.1. Targeted disaster prevention and mitigation strategies
Based on the China’s comprehensive typhoons hazard zoning, we propose targeted disaster prevention and mitigation strategies:
Most high-risk zones are situated in coastal areas characterized by elevated hazard levels, notably the densely populated and economically developed Yangtze River Delta and Pearl River Delta regions. Typhoon prevention projects in these regions should be designed according to varying typhoon hazard levels, local topography, and other susceptible environments, aligning with urban development needs and land function zoning. The Netherlands has successfully implemented several traditional water conservation techniques, including low-lying water fields enclosed by dikes and diverse coastal landscapes such as salt marsh plants, wetlands, and mangroves, aiming to form multilevel intertidal zones and mitigate typhoon hazards (Van Der Brugge et al. Citation2005; de Graaf et al. Citation2009). Multilevel systems in typhoon prevention refer to the implementation of a combination of protective measures at different levels, taking into account factors such as hazard levels and local conditions. While inspired by practices in the Netherlands, adapting this concept to China involves tailoring strategies to its diverse geography, such as implementing coastal protection in densely populated regions and developing ecological infrastructure. The underlying principle remains relevant but requires customization to address China’s specific challenges. Additionally, high-risk coastal areas should adopt sustainable management models, emphasizing robust construction and differentiated maintenance. Inland cities and villages with substantial arable land exposure and low disaster resilience should focus on constructing multilevel wind and flood prevention systems, enhancing human and material resources, and fortifying the emergency response system.
Medium- and high-risk areas are predominantly found in the southern, eastern, and central regions of China. These areas exhibit similar hazards but differ in disaster perception and urban resilience. Hence, it is imperative to establish ecological infrastructure, undertake ecological protection and restoration of wetlands and damaged river networks, formulate land-use planning according to typhoon disaster levels, strengthen disaster monitoring and early warning systems, and develop strategies for safe evacuation or building safety (Yu Citation1996; Yu et al. Citation2006). Special attention should be paid to areas with a high degree of surface undulation, narrow river channels, and inadequate transportation systems, where secondary disasters such as floods and landslides are frequent, particularly in the northeast with lower disaster prevention capabilities.
In low-risk and very low-risk areas, enhancement of urban disaster mitigation capabilities is essential to protect ecologically sensitive areas and guide settlements effectively. Urban infrastructure construction, drainage, flood control projects, and the layout of emergency shelters should all factor in the impact of typhoon disasters.
4.2. Climate change impact on typhoon hazard zoning
The United Nations Intergovernmental Panel on Climate Change (IPCC) Special Report on Managing the Risks of Extreme Events and Disasters for Climate Change Adaptation, released in 2014, highlights an increase in extreme events since the 1950s. There is high confidence that this escalation in risk has contributed to augmented direct economic losses from typhoons and an increase in the maximum mean wind speed of typhoons. However, there is lower confidence in the upward trend observed in typhoon intensity, frequency, and duration. Recent analyses of historical typhoon data suggest a robust correlation between the maximum wind speed and the duration of super typhoons making landfall in China in the last 20 years (R-squared approximately 0.40, significance F below 0.005). Moreover, numerous studies indicate that climate change is likely to cause a substantial increase in average storm intensity in the North Atlantic, an elevation in the number of severe typhoons (categories 4 and 5), and a 20% increase in rainfall within 100 km from the typhoon center (Bhatia et al. Citation2019; Emanuel et al. Citation2008; Knutson et al. Citation2015). Additionally, global warming has resulted in elevated seawater temperatures and rising sea levels in China’s coastal areas (Chen et al. Citation2014), heightening storm surge base levels and consequently, risk (Landsea et al. Citation2006; Mendelsohn et al. Citation2012). China-specific evidence supporting the increase in typhoon intensity in the Northwest Pacific includes studies by Yao et al. (Citation2021) and Liu & Chan (Citation2020). These studies found a rise in the proportion of strong typhoons in the region over the past few decades, linking this trend to warming sea surface temperatures. The increasing intensity of extreme weather events due to climate change has profound implications for our zoning work, particularly when considering climate-related factors.
Climate change heightens the impact of hazard-causing factors, such as extreme rainfall and strong winds, intensifying weather extremes like typhoons (Li et al. Citation2023).
Climate change directly transforms hazard-formative environments through rising temperatures and sea levels (Allan et al. Citation2020), potentially enhancing conditions for typhoon formation and intensification, thereby increasing the likelihood of extreme weather events.
Climate change exposes both individuals and properties to extreme weather hazards, necessitating a comprehensive reassessment of vulnerable populations and at-risk assets for improved protective and evacuation planning (Lawrence et al. Citation2020).
Climate change directly affects the requirements and effectiveness of hazard mitigation measures (Cui et al. Citation2021), necessitating increased investments in protective infrastructure like flood barriers and stormwater drainage systems due to the heightened frequency and intensity of weather extremes.
4.3. Territorial planning for typhoon resilience in China
The profound impact of climate change on zoning schemes is undeniable, ushering in a new era of complexity, demanding enhanced data, analysis, and resources to navigate the evolving climate landscape. It is essential to recognize that rather than rendering zoning schemes obsolete, climate change amplifies their significance by promoting proactive planning and preparedness amidst ever-shifting risks. This reinforces community and city resilience while mitigating potential losses from extreme weather events (Bhatia et al. Citation2019; Murray & Ebi Citation2012; Meerow et al. Citation2016).
In the context of China, a nation with an extensive coastline vulnerable to typhoons, climate change introduces a heightened level of complexity to the risk landscape. To effectively adapt to this evolving challenge and bolster typhoon resilience, the imperative lies in adopting a comprehensive approach to territorial planning. This approach encompasses various critical elements, including localized risk assessments that incorporate historical typhoon data, anticipated climate change impacts, and the inherent coastal vulnerability. These assessments enable the prioritization of precise and targeted interventions (Murray & Ebi Citation2012). Paramount among these measures is the investment in resilient infrastructure, which involves the implementation of climate-resistant designs, such as elevated buildings, flood barriers, and reinforced structures. This is particularly essential in high-risk coastal areas (Meerow et al. Citation2016; Pilkington and Mahmoud Citation2017). Furthermore, the incorporation of nature-based solutions, such as the preservation and restoration of vital ecosystems like mangrove forests and wetlands, yields substantial benefits by serving as effective barriers against storm surges and coastal erosion. These nature-based strategies should be seamlessly integrated into territorial planning (Kumar et al. Citation2021; Wedding et al. Citation2022). Active engagement of local communities through well-designed public awareness campaigns and community-based disaster risk reduction programs plays a pivotal role in strengthening resilience, ensuring that communities are both well-informed and equipped to respond effectively to typhoon threats (Meerow et al. Citation2016). Concurrently, enforcing stringent zoning regulations to restrict construction in high-risk coastal zones and promoting climate-adaptive land use practices, including sustainable urban development, constitute indispensable facets of territorial planning (Bhatia et al. Citation2019; Emanuel et al. Citation2008).
4.4. Limitations and future work
While this study provides a comprehensive typhoon hazard zoning for China, based on historical records and an AHP evaluation, it is essential to acknowledge certain limitations inherent in the research. The AHP method demonstrates limitations such as subjectivity, susceptibility to input changes, and a potential for rank reversal (Tu and Wu Citation2023). Challenges emerge from its reliance on subjective judgments, the possibility of inconsistency, and complexity in large-scale applications. AHP assumes criteria independence, lacks robust sensitivity analysis, and may not consistently encourage consensus. While AHP can provide value, its usage should be cautious, recognizing its drawbacks. The reliance on historical records may introduce uncertainties due to potential variations in data accuracy and completeness. Additionally, the study did not explicitly consider the dynamic nature of climate change, which could lead to deviations in future typhoon patterns from historical trends. Although the identified causal factors, including strong winds and heavy rainfall, offer valuable insights, the complex interplay of environmental variables may not be fully captured. The proposed risk management policies and plans, while foundational, should be subject to contextual adaptation based on the specific conditions of individual regions.
Looking forward, it is essential for future work to address these limitations and explore new research avenues. The incorporation of advanced modeling techniques that consider climate change dynamics has the potential to enhance the accuracy of hazard zoning. A more nuanced analysis of the interplay between various causal factors is necessary for a more robust understanding of typhoon hazards. Future research endeavors could focus on the development of multidimensional urban construction performance indicators, refining the proposed indices to encompass a broader spectrum of factors affecting resilience. Additionally, the integration of emerging technologies and data sources could further enhance prediction and simulation capabilities.
5. Conclusion
This study presents a comprehensive typhoon hazard zoning for China based on historical records and an Analytic Hierarchy Process (AHP) evaluation. The results show that the degree of typhoon hazards varies across different regions, with the coastal areas being the most vulnerable. The study identifies the causal factors of typhoon disasters, including strong winds, heavy rainfall, and maximum daily rainfall, which pose a risk of urban flooding and jeopardize the lives and properties of residents. To address the challenges posed by typhoons, the study proposes a series of risk management policies and unique plans for the typhoon disaster chain. The study also suggests developing multidimensional urban construction performance indicators involving socioeconomic, infrastructure, ecological environment, and disaster management to build a comprehensive, flexible, and resilient city. Moving forward, the findings of this study hold the potential to further refine the spatial delineation of typhoon hazards in the context of climate change, enhance evaluation indices, and facilitate effective prediction and simulation, thereby contributing valuable insights for future territorial planning. Overall, this study provides a valuable reference point for regions to devise comprehensive urban disaster prevention and mitigation strategies and enhance their resilience to typhoon hazards.
Supplemental Material
Download MS Word (37.9 KB)Disclosure statement
No potential conflict of interest was reported by the authors(s).
Data availability statement
All datasets used in this study are open-source and freely available from the sources cited in the text.
Additional information
Funding
References
- Allan RP, Barlow M, Byrne MP, Cherchi A, Douville H, Fowler HJ, Gan TY, Pendergrass AG, Rosenfeld D, Swann ALS, et al. 2020. Advances in understanding large-scale responses of the water cycle to climate change. Ann N Y Acad Sci. 1472(1):49–75. doi: 10.1111/nyas.14337.
- Almazan JU, Albougami AS, Alamri MS, Colet PC, Adolfo CS, Allen K, Gravoso R, Boyle C. 2019. Disaster-related resiliency theory among older adults who survived Typhoon Haiyan. Int J Disaster Risk Reduct. 35(February):101070. doi: 10.1016/j.ijdrr.2019.101070.
- Bhatia KT, Vecchi GA, Knutson TR, Murakami H, Kossin J, Dixon KW, Whitlock CE. 2019. Recent increases in tropical cyclone intensification rates. Nat Commun. 10(1):635. doi: 10.1038/s41467-019-08471-z.
- Cai Y, Li L, Elahi E, Qiu Y. 2018. Selection of policies on typhoon and rainstorm disasters in China: a content analysis perspective. Sustainability (Switzerland). 10(2):387. doi: 10.3390/su10020387.
- Chen Y, Huang W, Xu S. 2014. Frequency analysis of extreme water levels affected by sea-level rise in East and Southeast Coasts of China. J Coast Res. 68(sp1):105–112. doi: 10.2112/SI68-014.1.
- Conte MN, Kelly DL. 2018. An imperfect storm: fat-tailed tropical cyclone damages, insurance, and climate policy. J Environ Econ Manage. 92:677–706. doi: 10.1016/j.jeem.2017.08.010.
- Cui M, Ferreira F, Fung TK, Matos JS. 2021. Tale of two cities: how nature-based solutions help create adaptive and resilient urban water management practices in Singapore and Lisbon. Sustainability (Switzerland). 13(18):10427. doi: 10.3390/su131810427.
- Cutter SL, Barnes L, Berry M, Burton C, Evans E, Tate E, Webb J. 2008. A place-based model for understanding community resilience to natural disasters. Global Environ Change. 18(4):598–606. doi: 10.1016/j.gloenvcha.2008.07.013.
- de Graaf R, van de Giesen N, van de Ven F. 2009. Alternative water management options to reduce vulnerability for climate change in the Netherlands. Nat Hazards. 51(3):407–422. doi: 10.1007/s11069-007-9184-4.
- Dinan T. 2017. Projected increases in hurricane damage in the United States: the role of climate change and coastal development. Ecol Econ. 138:186–198. doi: 10.1016/j.ecolecon.2017.03.034.
- Duan Y, Chen L, Xu Y, Qian C. 2012. The status and suggestions of the improvement in the typhoon observation, forecasting and warning systems in China. Eng Sci. 14(9):4–9. (in Chinese).
- Eadie P. 2019. Typhoon Yolanda and post-disaster resilience: problems and challenges. Asia Pac Viewp. 60(1):94–107. doi: 10.1111/apv.12215.
- Emanuel K, Sundararajan R, Williams J. 2008. Hurricanes and global warming: results from downscaling IPCC AR4 simulations. Bull Amer Meteor Soc. 89(3):347–368. https://go.exlibris.link/q3v7LQFC. doi: 10.1175/BAMS-89-3-347.
- Feng L, Luo G. 2011. Application of possibility-probability distribution in risk analysis of landfall hurricane - a case study along the east coast of the United States. Appl Soft Comput J. 11(8):4563–4568. doi: 10.1016/j.asoc.2011.08.007.
- Feng Y, Xiang-Yang L. 2018. Improving emergency response to cascading disasters: applying case-based reasoning towards urban critical infrastructure. Int J Disaster Risk Reduct. 30(2):244–256. doi: 10.1016/j.ijdrr.2018.04.012.
- Gallina V, Torresan S, Critto A, Sperotto A, Glade T, Marcomini A. 2016. A review of multi-risk methodologies for natural hazards: consequences and challenges for a climate change impact assessment. J Environ Manage. 168:123–132. doi: 10.1016/j.jenvman.2015.11.011.
- Guo G, Zhao F, Wang D. 2017. A method research of house damage in typhoon-flood disaster chian based on vulnerability curve. J Catastrophol. 32(4):94–97. (in Chinese).
- Heidarzadeh M, Iwamoto T, Takagawa T, Takagi H. 2021. Field surveys and numerical modeling of the August 2016 Typhoon Lionrock along the northeastern coast of Japan: the first typhoon making landfall in Tohoku region. Nat Hazards. 105(1):1–19. doi: 10.1007/s11069-020-04112-7.
- Heidarzadeh M, Rabinovich AB. 2021. Combined hazard of typhoon-generated meteorological tsunamis and storm surges along the coast of Japan. Nat Hazards. 106(2):1639–1672. doi: 10.1007/s11069-020-04448-0.
- Heidarzadeh M, Teeuw R, Day S, Solana C. 2018. Storm wave runups and sea level variations for the September 2017 Hurricane Maria along the coast of Dominica, eastern Caribbean sea: evidence from field surveys and sea-level data analysis. Coastal Eng J. 60(3):371–384. doi: 10.1080/21664250.2018.1546269.
- Heidarzadeh M, Iwamoto T, Šepić J, Mulia IE. 2023. Normal and reverse storm surges along the coast of Florida during the September 2022 Hurricane Ian: observations, analysis, and modelling. Ocean Model. (Oxford). 185:102250. doi: 10.1016/j.ocemod.2023.102250.
- Hernández ML, Carreño ML, Castillo L. 2018. Methodologies and tools of risk management: hurricane risk index (HRi). Int J Disaster Risk Reduct. 31:926–937. doi: 10.1016/j.ijdrr.2018.08.006.
- Murray V, Ebi KL. 2012. IPCC special report on managing the risks of extreme events and disasters to advance climate change adaptation (SREX). J Epidemiol Community Health. 66(9):759–760. doi: 10.1136/jech-2012-201045.
- Jie Y, Shaohong W, Erfu D. 2012. Assessment of economic damage risks from typhoon disasters in Guangdong, China. J Resource Ecol. 3 (2):144–150. doi: 10.5814/j.issn.1674-764x.2012.02.006.
- Johnson C, Blackburn S. 2014. Advocacy for urban resilience: UNISDR’s making cities resilient campaign. Environ Urban. 26(1):29–52. doi: 10.1177/0956247813518684.
- Jones RN. 2001. An environmental risk assessment/management framework for climate change impact assessments. Nat Hazards (Dordrecht). 23(2/3):197–230. doi: 10.1023/A:1011148019213.
- Knutson TR, McBride JL, Chan J, Emanuel K, Holland G, Landsea C, Held I, Kossin JP, Srivastava AK, Sugi M. 2010. Tropical cyclones and climate change. Nat Geosci. 3(3):157–163. doi: 10.1038/ngeo779.
- Knutson TR, Sirutis JJ, Zhao M, Tuleya RE, Bender M, Vecchi GA, Villarini G, Chavas D. 2015. Global projections of intense tropical cyclone activity for the late twenty-first century from dynamical downscaling of CMIP5/RCP4.5 scenarios. J Clim. 28(18):7203–7224. doi: 10.1175/JCLI-D-15-0129.1.
- Kumar P, Debele SE, Sahani J, Rawat N, Marti-Cardona B, Alfieri SM, Basu B, Basu AS, Bowyer P, Charizopoulos N, et al. 2021. An overview of monitoring methods for assessing the performance of nature-based solutions against natural hazards. Earth Sci Rev. 217(March). :103603. doi: 10.1016/j.earscirev.2021.103603.
- Kuo YC, Lu ST. 2013. Using fuzzy multiple criteria decision making approach to enhance risk assessment for metropolitan construction projects. Int J Project Manage. 31(4):602–614. doi: 10.1016/j.ijproman.2012.10.003.
- Landsea CW, Harper BA, Hoarau K, Knaff JA. 2006. Can we detect trends in extreme tropical cyclones? Science. 313(5786):452–454. doi: 10.1126/science.1128448.
- Lange W, Pirzer C, Dünow L, Schelchen A. 2016. Risk perception for participatory ecosystem-based adaptation to climate change in the mata Atlântica of Rio de Janeiro State, Brazil. Adv Nat Technol Hazards Res. 42:483–506. doi: 10.1007/978-3-319-43633-3_21.
- Lawrence J, Blackett P, Cradock-Henry NA. 2020. Cascading climate change impacts and implications. Clim Risk Manage. 29(March):100234. doi: 10.1016/j.crm.2020.100234.
- Le TA, Takagi H, Heidarzadeh M, Takata Y, Takahashi A. 2019. Field surveys and numerical simulation of the 2018 Typhoon Jebi: impact of high waves and storm surge in semi-enclosed Osaka Bay, Japan. Pure Appl Geophys. 176(10):4139–4160. doi: 10.1007/s00024-019-02295-0.
- Lei X. 2011. The main assessment conclusions and issues on ti-ie impacts of global climate change on tropical cyclone activities. Bull Nat Nat Sci Found China. 25(2):85–89 + 104.
- Li M, Wang J, Sun X. 2016. Scenario-based risk framework selection and assessment model development for natural disasters: a case study of typhoon storm surges. Nat Hazards. 80(3):2037–2054. doi: 10.1007/s11069-015-2059-1.
- Li Y, Zhao S, Zhao D, Gao G, Xu H, Jiang Y. 2023. Changes in tropical cyclone disasters over China during 2001–2020. Earth Space Sci. 10(6):1–15. doi: 10.1029/2022EA002795.
- Liu KS, Chan, JCL. 2020. Recent increase in extreme intensity of tropical cyclones making landfall in South China. Clim Dyn. 55(5-6):1059–1074. doi: 10.1007/s00382-020-05311-5.
- Meerow S, Newell JP, Stults M. 2016. Defining urban resilience: a review. Landscape Urban Plann. 147:38–49. doi: 10.1016/j.landurbplan.2015.11.011.
- Mendelsohn R, Emanuel K, Chonabayashi S, Bakkensen L. 2012. The impact of climate change on global tropical cyclone damage. Nat Clim Change. 2(3):205–209. doi: 10.1038/nclimate1357.
- Niu H, Liu M, Lu M, Quan R, Zhang L, Wang J. 2011. Risk assessment of typhoon hazards in China coastal area during last 20 years. Sci Geogr Sin. 31(6):764–768. (in Chinese).
- Peduzzi P, Chatenoux B, Dao H, De Bono A, Herold C, Kossin J, Mouton F, Nordbeck O. 2012. Global trends in tropical cyclone risk. Nat. Clim Change. 2(4):289–294. doi: 10.1038/nclimate1410.
- Pilkington S, Mahmoud H. 2017. Spatial and temporal variations in resilience to tropical cyclones along the United States coastline as determined by the multi-hazard hurricane impact level model. Palgrave Commun. 3(1):1–8. doi: 10.1057/s41599-017-0016-1.
- Qi P, Du M. 2018. Multi-factor evaluation indicator method for the risk assessment of atmospheric and oceanic hazard group due to the attack of tropical cyclones. Int J Appl Earth Obs Geoinf. 68(September 2017):1–7. doi: 10.1016/j.jag.2018.01.015.
- Revi A. 2008. Climate change risk: an adaptation and mitigation agenda for Indian cities. Environ Urban. 20(1):207–229. doi: 10.1177/0956247808089157.
- Shi Y, Zhai G, Xu L, Zhou S, Lu Y, Liu H, Huang W. 2021. Assessment methods of urban system resilience: from the perspective of complex adaptive system theory. Cities. 112(January):103141. doi: 10.1016/j.cities.2021.103141.
- Shultz JM, Kossin JP, Galea S. 2018. The need to integrate climate science into public health preparedness for hurricanes and tropical cyclones. JAMA - J Am Med Assoc. 320(16):1637–1638. doi: 10.1001/jama.2018.16006.
- Si Y, Fang J, Xu L. 2021. Review of ecological infrastructure planning practices based on the ecological security pattern theory in China (1997 ∼ 2019). Landsc Archit Front. 9(3):28–47. doi: 10.15302/J-LAF-0-020013.
- Tu J, Wu Z. 2023. Analytic hierarchy process rank reversals: causes and solutions. Ann Oper Res. 2023:1–25. doi: 10.1007/s10479-023-05278-6.
- Van Der Brugge R, Rotmans J, Loorbach D. 2005. The transition in Dutch water management. Reg Environ Change. 5(4):164–176. doi: 10.1007/s10113-004-0086-7.
- Wang R, Lian F, Yu H, Shi P, Wang J. 2016. Classification and regional features analysis of global typhoon disaster chains based on hazard-formative environment. Geogr. Res. 35(5):836–850. (in Chinese)
- Wedding LM, Reiter S, Moritsch M, Hartge E, Reiblich J, Gourlie D, Guerry A. 2022. Embedding the value of coastal ecosystem services into climate change adaptation planning. PeerJ (San Francisco, CA). 10:e13463. doi: 10.7717/peerj.13463.
- Wu L, Chou C, Chen CT, Huang R, Knutson TR, Sirutis JJ, Garner ST, Kerr C, Lee CJ, Feng YC. 2014. Simulations of the present and late-twenty-first-century western north pacific tropical cyclone activity using a regional model. J Clim. 27(9):3405–3424. doi: 10.1175/JCLI-D-12-00830.1.
- Xu H, Xu K, Bin L, Lian J, Ma C. 2018. Joint risk of rainfall and storm surges during typhoons in a coastal city of Haidian Island, China. Int J Environ Res Public Health. 15(7):1377. doi: 10.3390/ijerph15071377.
- Xu X, Sun D, Guo T. 2015. A systemic analysis of typhoon risk across China. Nat Hazards. 77(1):461–477. doi: 10.1007/s11069-015-1586-0.
- Yao C, Xiao Z, Yang S, Luo X. 2021. Increased severe landfall typhoons in China since 2004. Int J.of Climatol. 41(S1):E1018–E1027. doi: 10.1002/joc.6746.
- Yao X, Zhao D, Li Y. 2020. Autumn tropical cyclones over the Western North Pacific during 1949-2016: a statistical study. J Meteorol Res. 34(1):150–162. doi: 10.1007/s13351-020-9019-8.
- Ye J, Zhang M, Lin G, Yu S. 2011. Agriculture risk assessment of typhoon disaster based on GIS and entropy weight theory: A case study of Fujian, China. Proceedings - 2011 19th International Conference on Geoinformatics, Geoinformatics 2011. doi: 10.1109/GeoInformatics.2011.5980859.
- Yin J, Dai E, Wu S. 2013. Integrated risk assessment and zoning of typhoon hazards in China. Scientia Geographica Sinica. 33(11):1370–1376. (in Chinese)
- Yin J, Wu S, Dai E. 2015. Analysis of typhoon hazard-informative environment sensitivity based on historical data in China(in Chinese). Geogr Geo-Inform Sci. 31(1):101–105.
- Ying M, Zhang W, Yu H, Lu X, Feng J, Fan YX, Zhu Y, Chen D. 2014. An overview of the China meteorological administration tropical cyclone database. Journal of Atmospheric and Oceanic Technology. 31(2):287–301. doi: 10.1175/JTECH-D-12-00119.1.
- Yu K. 1996. Security patterns and surface model in landscape ecological planning. Landscape Urban Plann. 36(1):1–17. doi: 10.1016/S0169-2046(96)00331-3.
- Yu K, Li D, Li N. 2006. The evolution of Greenways in China. Landscape Urban Plann. 76(1-4):223–239. doi: 10.1016/j.landurbplan.2004.09.034.
- Zhang X, Nie J, Cheng C, Xu C, Zhou L, Shen S, Pei Y. 2021. Natural and socioeconomic factors and their interactive effects on house collapse caused by typhoon Mangkhut. Int J Disaster Risk Sci. 12(1):121–130. doi: 10.1007/s13753-020-00322-6.