
 ?Mathematical formulae have been encoded as MathML and are displayed in this HTML version using MathJax in order to improve their display. Uncheck the box to turn MathJax off. This feature requires Javascript. Click on a formula to zoom.
Abstract
Ponds are a unique agricultural irrigation method with a long history in the Taoyuan area. However, most of them lack accurate spatial information, such as water depth, water surface area, and effective water storage capacity. In this study, the water depth of pond was measured using an unmanned surface vehicle, which has the advantage of being able to operate in shallow waters and in areas that are inaccessible to manned boats. The results show that it can rapidly provide 3D point cloud and an underwater 50 cm gridded digital elevation model with an accuracy of 6.7 cm, which can be used to identify structural defects at the pond bed and the embankment and to accurately estimate the water surface area and effective water storage capacity. The nests with diameters of 30 to 70 cm dug by male tilapia to attract female tilapia for spawning can also be found. In addition, the ground-penetrating radar and electrical resistivity tomography were carried out to successfully investigate the electricity-related properties of the internal structure of the embankment and the leakage locations of pond. In conjunction with the maintenance experience of the Taoyuan Management Office, a risk reference index was proposed for the safety management.
SUBJECT CLASSIFICATION CODES:
Introduction
Taoyuan is known as the "Hometown of Thousand Ponds". Due to the plateau topography and river capture on the plateau, the cultivated land in Taoyuan lacks a stable water source. Therefore, the ancestors built thousands of ponds for water storage and crop irrigation. Despite having many ponds, ineffective irrigation remained a problem due to insufficient water sources and the absence of proper irrigation systems. To address this issue, the Taoyuan Canal was completed in 1928. The water intake of the canal was set up at Shimen in the upper reaches of the former Takekan Creek (now Dahan River) for water abstraction and the tunnels were dug along the canal to divert water. The trunk, branch, and subbranch waterways were constructed to divert water to irrigate the farmland on the Taoyuan plateau (Hwang Citation2019). This approach increased the rice yield severalfold. The irrigation system integrating reservoirs, rivers, canals, and ponds has a history of nearly a hundred years and has contributed to the special natural ecosystem and settlement culture in the Taoyuan area. With the development of Taoyuan City, many ponds have lost their irrigation function and have been filled for construction, resulting in a rapid growth in population (Yu et al. Citation2013).
At present, there are still 284 ponds under the jurisdiction of the Taoyuan Management Office, Irrigation Agency, Council of Agriculture, Executive Yuan. With increasing attention to issues of water shortage and water resource recycling, many parties have discussed the regulation, storage, and development of water resources in ponds. The proposed solutions include using the feasibility assessment of ponds to improve people’s livelihood and industrial water use (Northern Region Water Resources Office (NRWRO), Citation2006), transforming ponds into flood detention ponds or using them for disaster prevention, and the Project for Installing Solar Photovoltaic Facilities over Ponds in Taoyuan proposed by the Council of Agriculture to promote the installation of solar photovoltaic systems in agricultural water areas (Song et al. Citation2018; Council of Agriculture (COA), Citation2023). However, there is limited spatial information available for most ponds, such as water depth and water surface area, which makes it challenging for further development, renovation, and changes in use. These parameters must be remeasured and investigated before implementing integrated improvement plans. Traditionally, the water depths of the ponds were measured by leveling rods and float-based sonar device. Hung et al. (Citation2019) used an unmanned aerial vehicle (UAV) carrying a float-based sonar device to measure the water depth of these ponds and found that the standard deviation of the measured water depth reached 15 cm and that the standard error of the measured water surface area was 3.2–8.9%. The UAV failed to measure the water depths in the near-bank areas with plant coverage and therefore could not cover the entire area. Due to environmental factors such as the small size of the water area and the inconspicuous underwater features, it is also difficult to measure the water quality and water depths of the ponds with bathymetric light detection and ranging (LIDAR) or remote-sensing satellite images (Su and Lo Citation2021). Although single-beam bathymetry systems can be used to measure shallow water areas (John et al. Citation2010; Nicole et al. Citation2010), the data coverage is still not comparable to multibeam systems.
In recent years, there has been a significant increase in the use of unmanned vehicles equipped with automatic navigation functions. Unmanned surface vehicles (USVs) are the latest development in this field, following UAVs and unmanned ground vehicles. With a small- or medium-sized USV mounted with a small and lightweight multibeam echo sounder (MBES), a global navigation satellite system (GNSS), and an inertial navigation system (INS), it is possible to obtain detailed underwater topography and gain insights into underwater features through multibeam detection. With the above configuration, Seto and Crawford (Citation2015) assessed the environmental status and navigation safety in the Canadian Arctic, including ship navigation assistance and automated bathymetry in unfamiliar waters. The results of USV were instantly transmitted to the host ship to ensure that it could safely pass through unfamiliar waters or waters with dynamic obstacles. Similarly, Rowley (Citation2018) performed underwater scanning imaging at the Keokuk Dam on the Mississippi River in Iowa to check for structural or other damages to the dam and pipelines. The results showed that the use of USV can improve operational efficiency, reduce the time of operators (divers) in hazardous areas, and minimize the occurrence of industrial safety accidents. In addition, data from UAV photogrammetry and USV MBES can be integrated to generate seamless terrain data from nearshore to shallow waters (Lubczonek et al. Citation2021; Lewicka et al. Citation2022), or individual wave-dissipating blocks can be detected from MBES point cloud data based on deep learning–based object detection (Xu et al. Citation2022). The MBES point-cloud data can also be used for the 3D reconstruction of underwater objects (Kim et al. Citation2020; Maurell et al. Citation2022).
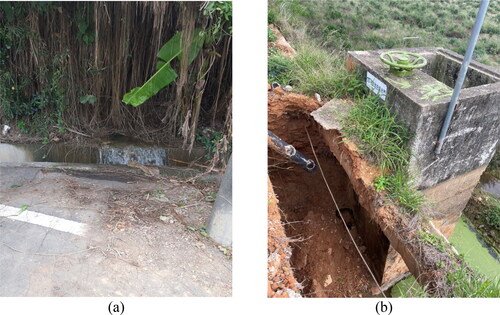
Most of the ponds in Taoyuan have raised embankments. These embankments were early made of clay and covered by stacked stones, but in recent years they have been renovated into cement embankments, and clear roads at least two meters wide have been left above the embankments for management, maintenance, and dredging. The pond depth is mainly limited by the geological soil because the depth of the red soil in the Taoyuan area is approximately 3 to 5 m; beyond this depth, water cannot be stored due to the presence of pebble layers, so the pond depth is mostly 2 to 3 m. The height difference between the terrain outside the embankment and the pond bed (i.e. the sum of the embankment height and the pond depth) can exceed 6 m (Fang and Chang Citation2004). According to the regulation of inspection and safety assessment of water conservancy structures, water storage, and water diversion structures should undergo regular and irregular inspections to collect necessary safety information and to compile safety maintenance manuals according to the content and features of water conservancy structures (Ministry of Justice (MOJ), Citation2021). Therefore, the main task of the Taoyuan Management Office is not only to manage the irrigation water source of the ponds but also to perform safety maintenance of the ponds. At present, the pond embankments were mainly inspected visually, but most of the damage to an embankment starts from the erosion of the internal soil. In the early stage of embankment damage, leakage is the most common. As shown in , the seepage water outside the embankment indicates that the soil underneath the embankment has been already saturated with water, which flows out from a fragile external structure. Since it is impossible to judge the position of the hollowed-out spot underneath the embankment based solely on the seepage point, to prevent any collapse caused by the hollowing out of the embankment, the general protocol is to first reduce the water storage capacity to reduce the pressure, then dig down and around from the top of the embankment above the seepage point until the hollowed-out spot is found, and fill with soil and compact it while observing whether the water seepage outside the embankment is reduced (Lee Citation2021). shows a collapse situation near a water supply riser due to failure to detect the underwater hollowed-out spot early. If there is more than one hollowed-out spot, water seepage may reoccur. In other words, when the embankment damage is visually found, there is usually at least one hollowed-out spot underneath the embankment. At this time, the use of local coring to detect the hollowed-out situation of the embankment can neither accurately find all hollowed-out spots nor achieve high operation efficiency. A noninvasive detection method can be used to quickly determine the possible location of the hollowed-out spot, or regular inspection should be conducted to prevent the embankment from hollowing out. Currently, the applicable rapid detection methods include ground-penetrating radar (GPR) detection and electrical resistivity tomography (ERT) detection (Wang et al. Citation2015; Liu et al. Citation2016; Zhou Citation2019).
Figure 1. (a) The seepage water outside the embankment; (b) the collapse situation near a water supply riser due to failure to detect the underwater hollowed-out spot.
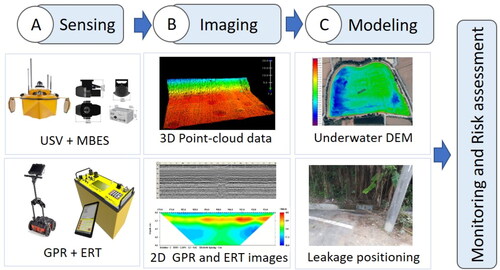
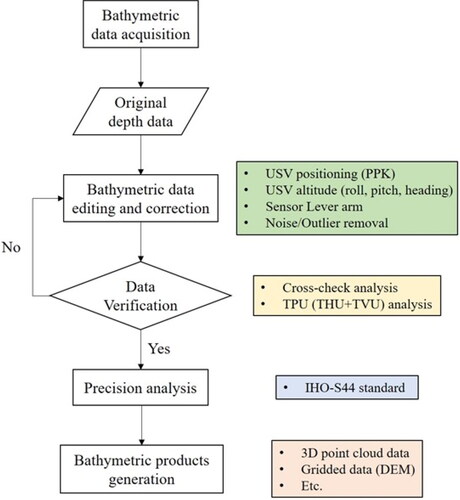
The geographical locations of the Ponds 9-6 and 9-8 in this study are shown in . The USV equipped with a MBES is used to measure the water depths and the appearances of the underwater embankment slopes of Pond 9-8 in the Taoyuan Canal. GPR detection and ERT detection are performed on top of the embankments of Ponds 9-6 and 9-8 in the Taoyuan Canal to investigate the electrical properties and leakage positions of the internal structures of the embankments. The workflow of this study is shown in . According to the abovementioned procedures, an implementation plan is proposed, and the results are analyzed and discussed. In addition, risk reference indicators for pond safety management are proposed to align with the business execution experience and needs of the Taoyuan Management Office to facilitate daily pond inspection work.
Figure 2. The Geographical location of the two ponds in this study: (a) Pond 9-6; (b) pond 9-8. The green triangle shows the ground control points around the ponds.
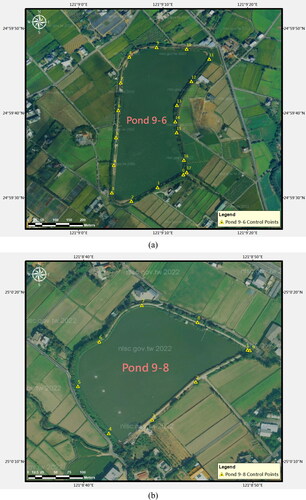
Figure 3. The workflow of integrating USV with MBES, GPR and ERT for monitoring and risk assessment of irrigation ponds.
Data and methods
Bathymetric survey using USV with MBES
The water depths of ponds were measured by a USV equipped with a NORBIT iWBMS MBES system. The system integrates a MBES, a GNSS/INS and a sound velocity sensor, as shown in (NORBIT Citation2023), with a weight of 8.5 kg. Therefore, it is suitable for USVs or other small floating carriers. The maximum scanning angle of the system is 210°, which is conducive to obtaining more underwater information and improving data coverage. The relevant parameters are listed in (NORBIT Citation2023).
Figure 4. NORBIT iWBMS MBES system (NORBIT Citation2023).
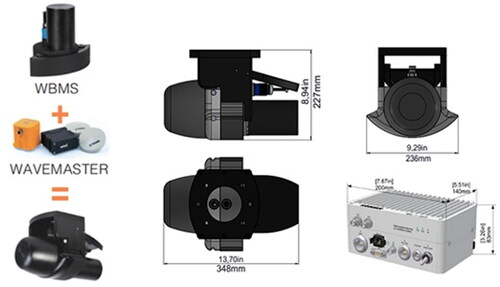
Table 1. Technical parameters of the NORBIT iWBMS MBES system (NORBIT Citation2023).
The length and width of the USV are 1.8 and 0.55 m, respectively, and its maximum payload is 50 kilograms (CHCNAV Citation2024). The MBES was embedded into the USV and was protected by a deflector on its front. The addition of balance floats on both sides of the hull increased the width of the USV to 92 cm and enhanced the balance of the USV, so that the attitude would be more stable during the data collection process, thus improving the accuracy of the results.
The steps of the bathymetric survey are based on the Specification of Bathymetric Surveys (Ministry of Interior (MOI), Citation2022), formulated by the Ministry of Interior, Executive Yuan and adapted to meet the requirements of this study. For example, since a pond is not influenced by tidal effects, it is unnecessary to observe and correct them. Additionally, because ponds are shallow and freshwater, the underwater sound speed does not change as drastically as it does in seawater due to low spatial variability on temperature and salinity. Therefore, the sound velocity profile does not need to be measured separately, and the sound speed observed by the surface sound velocimeter will be used to represent the average underwater sound speed. The bathymetric system inspection, the bathymetric measurements, and the underwater digital elevation model (DEM) are based on these datums. According to the International Hydrology Organization (IHO) Standards for Hydrographic Surveys (S-44 6th Edition) (International Hydrographic Organization (IHO), Citation2020), the standards of hydrographic surveys depending on the measured water depth are classified into orders of exclusive, special, grade 1 (1a and 1b), and grade 2. The orders were determined by the total propagated uncertainty (TPU), which consists of two depth-related parts: total horizontal uncertainty (THU) and total vertical uncertainty (TVU). The allowable THU for the orders of exclusive, special, and grade 1 range from 1 to 5 m, so it was relatively easy to achieve in this study. However, the maximum allowable TVU is given by IHO (Citation2020):
(1)
(1)
where a and b represent the portion of uncertainty related to the order, d is the depth and the unit is meter. The values of [a, b] in the special and grade 1 orders are [0.5, 0.013] and [0.25, 0.075], respectively. As most ponds are shallower than 10 m, we expected that the results of the bathymetric survey would be evaluated using the special and grade 1 specifications.
In this study, a USV bathymetric survey was conducted in Pond 9-8 of the Taoyuan Canal. The exterior operations involved the positioning of the GNSS base station, survey line planning, and bathymetric operations, while the interior operations focus on processing and editing bathymetric point cloud data using the software CARIS HIPS and SIPS 11.3. The horizontal datum used is Taiwan Datum 1997 [2020] (TWD97[2020]), while the vertical datum is Taiwan Vertical Datum 2001 (TWVD2001) in this study. The e-GNSS real-time kinematic positioning system of the National Land Surveying and Mapping Center was used to obtain the NEH of the GNSS base station in the above-mentioned datums as [2766238.356, 264765.538, 84.636] and the NEH of the highest point (highest water level) of the spillway as [2766129.408, 264647.871, 83.691] in meters. The depth at the bottom of the riser is 2.9 m, as measured by using a leveling rod. This is considered the lowest water level for supplying water through the riser, and the water stored below this level is not included in the effective storage capacity and can only be pumped out.
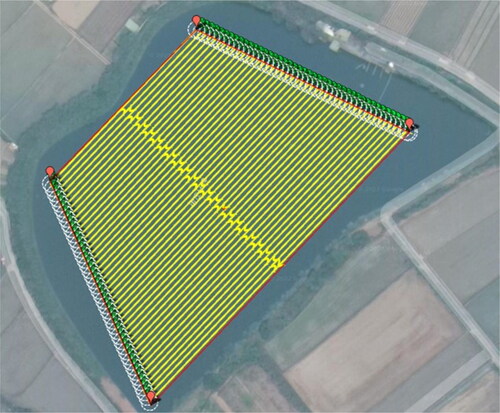
The ultra-shallow draught of USVs allows them to navigate in areas inaccessible to manned boats. Another advantage of USVs is their automatic navigation and measurement capabilities. The GNSS base station on the bank provided real-time navigation and positioning, enabling the USV to automatically follow the planned survey line and conduct the survey, which improved operation efficiency (Chung et al. Citation2016). After initial exploration, we found that the depth of the pond is approximately 3 m, so the planned distance between survey lines was set at 3 m, and the rout distribution was based on the principle of covering the largest area of the pond. shows the survey line planning of Pond 9-8, in which the estimated point cloud density is 3500 points/m2. Manual control was used to survey the edge areas of the pond. However, the actual situation revealed the presence of structures in the pond, including waterwheel motors (for water circulation and increased oxygen exchange rate), cables, sampans, bamboo poles, etc. Due to the USV's automatic avoidance function, it was unable to follow the planned route. To ensure equipment safety, the USV was manually controlled.
Figure 5. The survey line planning of pond 9-8 in the Taoyuan Canal.
illustrates the process of collecting bathymetric data, processing multibeam point cloud data, and generating bathymetric products. Following a field survey using an USV, the initial depth data is acquired. Subsequently, corrections are applied to the bathymetric data, addressing factors such as USV positioning, altitude information, and the lever arms among sensors (GNSS antenna, IMU, and the transducer). These measurements are then used to correct the bathymetric data into the coordinate systems of TWD97[2020] in Horizontal and TWVD 2001 in Vertical. The data editing involves eliminating noise and outliers from the raw data, and commercial software CARIS HIPS and SIPS 11.3 is employed for data processing. Criteria, such as depth range (e.g. shallower than 0.5 or 1 m), are set to enhance efficiency in the time-consuming noise removal process. Nevertheless, manual inspection remains crucial to ensuring data completeness and quality. Following data editing and correction, cross-check analysis and TPU analysis are conducted for data verification. Independent cross-check track lines perpendicular to main track lines are surveyed to assess the consistency of bathymetric data, while TPU analysis evaluates whether if the precision of bathymetric data is within horizontal and vertical error limits or not. The IHO S-44 standard is then introduced to evaluate the bathymetric results. The final step involves generating bathymetric products, which may include 3D point cloud data and gridded data (DEM) for subsequent applications. In this study, Combined Uncertainties and Bathymetry Estimators (CUBE) algorithm proposed by Calder and Mayer (Citation2003) is utilized to generate the underwater DEM.
Figure 6. The flow chart of bathymetric data collecting and processing.
The underwater DEM with the form of (x, y, z) was used to calculate the water volume V of the pond. The surfaces of the pond at a contour interval of 0.1 m were first calculated. The volume calculation was carried out using the “grdvolume” module in the Generic Mapping Tools (Wessel Citation2016; Wessel et al. Citation2019) (https://docs.generic-mapping-tools.org/6.4/grdvolume.html). Each grid surface defined by four grid nodes will be approximated using a bilinear expression for the z-value:
(2)
(2)
where the first term
is the grid value at the lower left corner of the cell (where our relative coordinates x = y = 0), and the
and
are the derivatives of z in x, y and both directions, respectively. The analytically integrate of this expression within each grid box allows for straight line contour intersections to go through a box and affect the integration domain and limits.
Embankment inspection using GPR and ERT
The electrical investigation of pond embankment structures includes GPR and ERT. The principle of GPR is to transmit radar wave signals and use the radar wave to meet the stratum interface to generate reflected waves due to the difference in the dielectric constant (dielectric permittivity) between the upper and lower strata, and analyze the travel time, waveform, amplitude, and other data of the reflected wave to determine the nature and position of the reflector (Harry Citation2009). Since radar waves have different wave propagation speeds in different media, the data can be used to study and judge the distribution of underground structures, layers, and underground anomalies (Wang et al. Citation2015; Liu et al. Citation2016; Rhee et al. Citation2021).
In this study, GGSI SIR-4000 GPR with a frequency setting of 400 MHz was used to perform detection operations in Ponds 9-6 and 9-8 of the Taoyuan Canal. A complete GPR survey line was first collected along the top of the embankment as the initial state assessment of the embankment structure. Then, advanced detection (such as adding parallel GPR survey lines on the top of the embankment or performing ERT detection) was performed on areas with abnormal signals. When conducting GPR inspection, the measurement results are stored every 50 m, and the visually observed on-site defects (such as defects in pavement materials, pipelines, and structures) were written on the record sheet to facilitate the characteristic identification of the radar reflection waveform. Then, Rad-Explore professional processing software was used to analyse the radar reflection signal, and a 2D GPR stratigraphic profile from the surface to a depth of 3.5 m was produced. According to the features of the radar reflection waveform, such as holes and subsidence, the position of the abnormal signal of the embankment structure was marked in the profile.
In ERT, a pair of electrodes (current electrodes) was inserted into the ground surface and injected with current, which flows through the interior of the formation to generate an artificial electric field, then the electric potential difference is measured by another pair of electrodes (potential electrodes) on the ground surface or in the probe hole. Based on the electrostatic theory, the magnitude of the current, the measured potential difference and the relative distance of the current and potential electrodes were used to calculate the apparent resistivity at the measured point. In addition, the location of the apparent resistivity is related to the spacing of the current and potential electrodes. By measuring the apparent resistivity according to a pre-designed array, the apparent resistivity at different locations can be combined into a 2D or even 3D ERT profiles (Zhou Citation2019).
Since the external survey of the northern embankment of Pond 9-6 in the Taoyuan Canal has found obvious leakage, to further determine the locations of leakage in the embankment, three additional ERT survey lines were arranged on the top of the embankment of the pond. Each survey line was 100 m long. One of the survey lines was set on the leakage-free top section of the embankment, which represented the sample of the embankment with complete structure. The other two survey lines were arranged in the section where leakage occurred. The ERT detection was performed using the Super Sting R8 (eight-channel) Marine/IP earth resistivity meter and the software of Earthimager2D (developed by Advanced Geosciences, Inc., USA). The Wenner-Schlumberger array was used to form the ERT survey line. The choice of such an arrangement was due to the study areas in which both lateral and vertical variations of resistivity are present. The resulting horizontal distribution of the underground data points in the pseudo-section is comparable with the Wenner array, but their vertical resolution is better (Filomena et al. Citation2014; Wang et al. Citation2015).
Results
Bathymetry, water area and water volume
Using the edited bathymetric point cloud data, an underwater DEM with a grid interval of 0.5 m was created, and the isobaths with an interval of 0.2 m were drawn in . The rectangular coordinates used are the TWD97 [2020] coordinate system. The pond 9-8 distributed within 300 square meters.
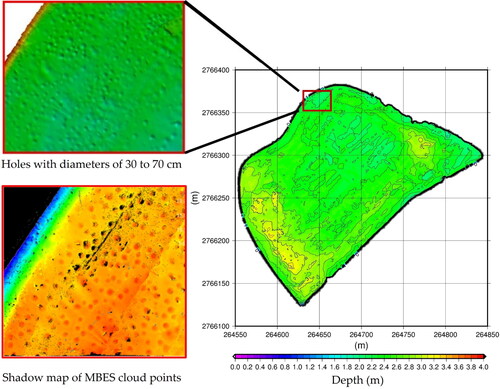
Figure 7. DEM of the bed of Pond 9-8 in the Taoyuan Canal, the distribution of isobaths at intervals of 0.2 m, and the 3D point cloud display of the holes at the pond bed.
This study referred to the IHO Standards for Hydrographic Surveys (S-44 6th Edition) and evaluated the relative accuracy with the special and grade 1 specifications. The report produced by CARIS software is shown in . The qualified rate of the total propagated uncertainty (TPU) of each grid approached 95% according to the special specifications and exceeded 99% according to the grade 1 (including 1a, 1b) specifications. In addition, three validation lines were carried out to evaluate the accuracy of the bathymetric point cloud data, and the validation lines were in principle perpendicular to most of the straight survey lines. Fledermaus CrossCheck software was used to do calculations on the inspection. The mean of differences between the original point cloud data of the validation lines and the grid data of the whole area is −3.5 cm, and the standard deviation of differences is 6.7 cm (see for details). The distribution of differences is shown in , and the differences range from −0.97 to 0.37 m. Generally, the accuracy of the bathymetric point data on the straight survey lines is relatively high because the attitude of the USV is relatively stable. However, due to the influence of the structures in the pond, the measurement results included the bathymetric point data of the imperfectly straight survey lines. In addition, fish in the pond caused difficulties in data editing, which decreased the accuracy of bathymetric point data.
Figure 8. The distribution of differences between the point cloud data of the inspection lines and the grid data of ponds.
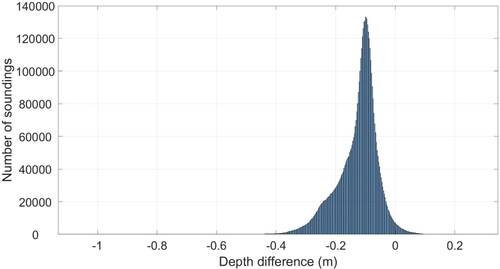
Table 2. Qualified rates for TPU according to special and grade 1 (1a, 1b) specifications.
Table 3. Statistics of differences between the original point cloud data of the inspection lines and the grid data of the whole area (unit: m).
The bathymetric point cloud data revealed the presence of dense holes with diameters ranging from 30 to 70 cm in the northern section of the pond, as can be seen in . These holes were identified as a result of tilapia being raised in the pond. The mating season for tilapia is between March and July every year, with peak activity observed between March and April, during which male fish construct nests to attract female fish for spawning. This is called the breeding behaviour or nesting behaviour of tilapia species in natural waters (Lowe Citation1956). These nests were identified as the holes in the point cloud data. This finding demonstrates the high-precision and high-resolution mapping capabilities of the MBES system. Regular inspections using the MBES system can be conducted in the future to identify any cracks or hollowing-out spots in the ponds.
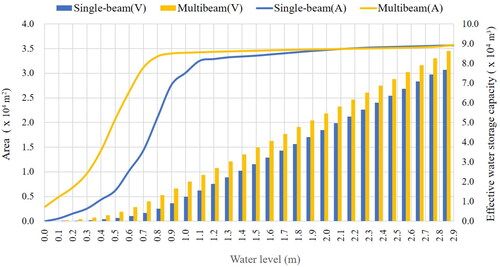
The water surface area and water storage capacity of layers with an elevation interval of 0.1 m were calculated using the DEM of the pond. When the calculation range is from the pond bed to the highest point of the spillway (the height difference is 3.3 m), the water surface area of Pond 9-8 in the Taoyuan Canal at the full water level is 35,757.31 m2, and the total water storage capacity is 86,555.93 m3 (taking the water level at the pond bed as 0); when the calculation range is from the lowest point of the riser to the highest point of the spillway (the height difference is 2.9 m), after subtracting the water storage capacity below the lowest point of the riser (311.39 m3), the effective water storage capacity of the pond is 86,244.54 m3 (the water level at the lowest point of the riser was 0). The relationship between the water level and water surface area of the pond (H-A curve) and the relationship between the water level and effective water storage capacity of the pond (H-V curve) are shown in . The results were compared with those from single-beam measurements and discussed in the subsequent section.
Figure 9. The relationship between water level (H) and water area (a), and the relationship between water level (H) and effective water storage capacity (V) based on single-beam and multibeam measured results (with the lowest water abstraction level as the starting point for elevation).
Electrical properties of the embankment structures
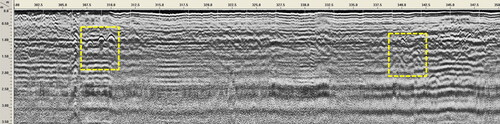
The cumulative distance for GPR detection of Ponds 9-6 and 9-8 in the Taoyuan Canal were shown in . According to the 2D GPR stratigraphic profile, the damage to the embankment structure of Pond 9-6 in the Taoyuan Canal was mainly caused by holes and subsidence, and there were relatively dense holes in some areas (Wang et al. Citation2015; Liu et al. Citation2016; Rhee et al. Citation2021). In fact, leaking water was found in the ditches and the nearby soil outside the embankment in the Pond 9-6 GPR detection distance from 0K + 950 to 1K + 000. The GPR stratigraphic profile also show dense diffraction signals of holes at a depth of 0.5 to 2 m from 0K + 950 to 0K + 975.0 and from 0K + 975.0 to 0K + 985.0, which could easily cause subsidence and cracks in the embankment and might be the cause of the leakage. As shown in , from 0K + 972.5 to 0K + 980.0, subsidence or signs of backfilling after excavation were found within 0.5 m under the surface layer. In contrast, the damage to the embankment structure of Pond 9-8 in the Taoyuan Canal was mainly holes. In the distance of the Pond 9-8 GPR detection from 0K + 300 to 0K + 350, two areas of relatively dense holes were found at depths of 1 to 2 m from 0K + 307 to 0K + 311 and from 0K + 340 to 0K + 345 (). Since the signals of the holes were distributed close to the riser (0K + 345), we recommend keeping track of them to determine whether they have a tendency to expand.
Figure 10. Distance (K: km) of GPR detection of ponds in the Taoyuan Canal, as well as Sections E1, E2, and E3 of the ERT survey lines: (a) pond 9-6; (b) pond 9-8.
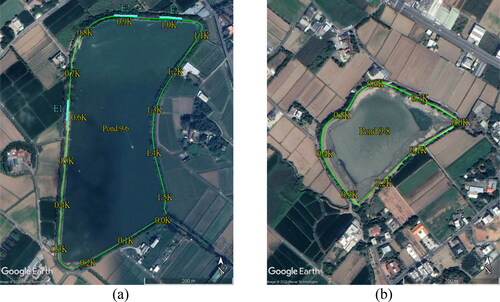
Figure 11. The GPR profile from 0K + 950 to 1K + 000 (K: km) of pond 9-6. The yellow rectangle encloses the section with densely distributed hole diffraction signals.
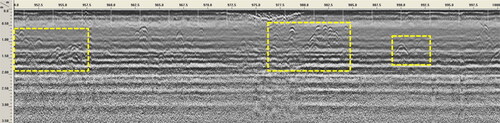
Figure 12. The GPR profile from 0K + 300 to 0K + 350 (K: km) of pond 9-8. The yellow rectangle encloses the section with densely distributed hole diffraction signals.
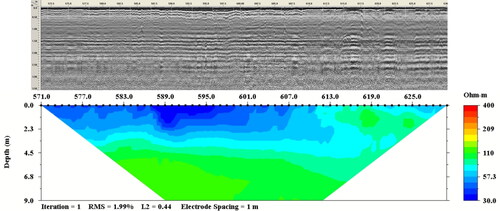
To further understand the leakage location of the embankment structure of Pond 9-6 in the Taoyuan Canal, three ERT survey lines were arranged on the top of the embankment. The first survey line (E1) was arranged on the leakage-free embankment, while the second and third survey lines (E2 and E3) were arranged on the embankment where the leakage occurred. The survey line configuration was shown in . The results of GPR and ERT detection were superimposed for cross-comparison. shows the ERT profile and the 2D GPR stratigraphic profile (from 0K + 571 to 0K + 630) of Section E1 of the pond. The GPR signal within a depth of 3 m was flat and had no obvious diffraction response, and the change in resistivity was divided into upper and lower blocks with the interface between the two at a depth of 3 m. The resistivity of the upper block was 20 to 90 Ωm. Since the mixture of construction waste, soil, and rock could be seen on the road along the top of the embankment, and the survey line was close to the fishery facilities, we speculate that the uneven mixing of materials caused the resistivity of the upper block to vary greatly. The resistivity of the lower block was 90 to 120 Ωm, with a relatively uniform distribution, which indicted the electrical response of the normal formation, and the small variability in resistivity indicates that the formation material was homogeneous and that the structure was intact, so the detection results of Section E1 were set as the control group.
Figure 13. The 2D GPR stratigraphic profile from 0K + 571 to 0K + 630 and the ERT profile of Section E1 (K: km).
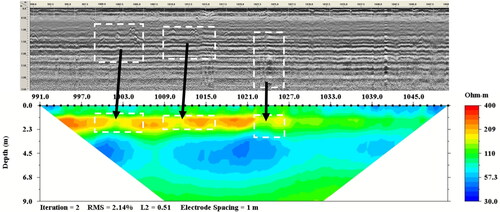
shows ERT profile and the 2D GPR stratigraphic profile of Section E2 (0K + 870 to 0K + 929) of the pond. The depths were 0.5 to 3 m from 0K + 879 to 0K + 892 and 0.3 to 3.2 m from 0K + 914 to 0K + 930. The radar reflection signals were all diffracted and disturbed, which might have been caused by the presence of cavities and pores in the formation. The resistivity changed at depths of 0.7 and 3 m, so the formation was divided into three blocks from top to bottom. The resistivity of the block within a depth of 0.7 m was 40 to 90 Ωm, which indicated that the material is composed of fine-grained sand and gravel. The resistivity of the block at depths from 0.7 to 3 m was 120 to 400 Ωm, which indicated that the material is composed of coarse-grained sand and gravel with large pores. The resistivity of the block deeper than 3 m was 30 to 120 Ωm, lower than the resistivity of the control group at two spots, which indicated that the water content of the formation material is significantly higher. In addition, the low-resistivity area was located below the abnormal area marked by the GPR (the white rectangle). shows the ERT profile and 2D GPR stratigraphic profile (from 0K + 991 to 1K + 050) of Section E3 of the pond. The depths were 0.5 to 3 m in the vicinity of 0K + 998 to 1K + 027. The radar reflection signal showed multiple diffractions and disturbances, which might have been caused by the presence of holes and pores in the formation. In terms of ERT detection, the shallow formation (within a depth of 3 m) in the first half of the survey line showed a higher resistivity response than the control group. The resistivity of the shallow formation in the second half of the survey line was the same as the background value, which might have been caused by the increase in resistivity due to the loose structural material of the embankment or by the inhomogeneity of the backfill material. In addition, three low-resistivity areas appeared at depths deeper than 3 m, whose resistivity was lower than that of the control group, which indicated that the water content of the formation material was significantly higher there. In addition, the low-resistivity areas were also located below the abnormal area marked by the GPR (the white rectangle). Therefore, the abnormal areas marked by the GPR signals in Sections E1 and E2 should be the locations of leakage on the embankment, which caused the embankment structure below this area to have a significantly higher water content (water flowing to a lower place) and consequently causing leakage outside the embankment.
Figure 14. The 2D GPR stratigraphic profile from 0K + 870 to 0K + 929 and the ERT profile of Section E2 (K: km). The white rectangle encloses the abnormal areas marked by the GPR signals and its corresponding area in the ERT profile.
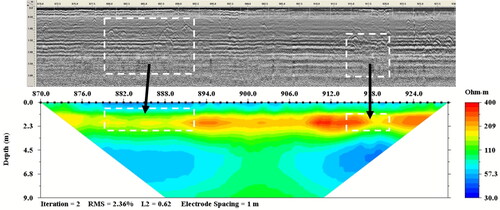
Figure 15. The 2D GPR stratigraphic profile from 0K + 991 to 1K + 050 and the ERT profile of Section E3 (K: km). The white rectangle encloses the abnormal areas marked by the GPR signals and its corresponding area in the ERT profile.
Discussion
In this study, a bathymetric survey of Pond 9-8 in the Taoyuan Canal was conducted using a USV equipped with a MBES. The relevant bathymetric point cloud data were processed, and accuracy analysis was performed. This marks the first time a USV equipped with a MBES has been used to measure water depths in ponds. After comparing with the validation lines, the underwater DEM's accuracy is found to be 6.7 cm, and the qualified rate according to the IHO Standards for Hydrographic Surveys (S-44 6th Edition) is 94.83%. Compared to the traditional method of using manned boats such as sampans and fishing rafts, USVs not only have relatively flexible control in confined spaces such as ponds, but also have a smaller turning radius, reducing the difficulty of manoeuvring. Additionally, USVs can perform relevant operations in areas closer to the bank due to their shallow draught. If there are few obstacles in the pond, the automatic navigation function allows USVs to take measurements along the planned survey line. According to the real-world experience of the team, the use of USVs has reduced operation time by approximately half. For example, it only took 1 h to complete the measurement of about half the water surface area of Pond 9-8 of the Taoyuan Canal using automatic navigation. Although manual control was later used due to obstacles, the total operation time was only 3 to 4 h. Moreover, surveying with USVs required less manpower. However, a disadvantage of USVs is that garbage floating on the water can easily damage their propellers, which may be overcome by changing some part of the design or adding new mechanisms.
The use of multibeam detection in this study allowed for more precise underwater topography and a deeper understanding of the features present. This was exemplified by the identification of holes in the pond bed using the bathymetric point cloud data. Additionally, the underwater DEM constructed from the multibeam data allowed for accurate estimation of the water surface area and effective water storage capacity of the ponds, which was compared to the results obtained from single-beam measurements. The differences in water surface area and effective water storage capacity between the two methods (single-beam and multibeam) at the highest water level were 93 m2 and 9,444.5 m3, respectively. Since the embankment of the pond was steep (approximately 70°) and the embankment height was approximately 2.2 m, the water surface area from the lowest water abstraction level to 0.7 m above was close to 95% of the maximum area. Therefore, the relationship between the water surface area and the water level calculated from the multibeam results was more in line with the pond’s true structure. Moreover, the effective water storage capacity estimated by single-beam results had a discrepancy of approximately 10 to 20% from that estimated by multibeam results. This discrepancy is to be expected since the bathymetric survey using single-beam sonar and manned boats cannot cover the entire water area (John et al. Citation2010; Shyue et al. Citation2014; Hung et al. Citation2019).
In addition to the above bathymetric operations, this study conducted GPR detection on the embankments of Ponds 9-6 and 9-8 in the Taoyuan Canal and conducted ERT detection in three areas on the top of the embankment of Pond 9-6, two of which were on the northern embankment where leakage had been found. According to the GPR detection, the total length of the embankment of Pond 9-8 is approximately 804 m, of which the cumulative length of structural damage was approximately 90.5 m, and the conversion percentage was 5.8%. The damages were in the form of holes, mainly distributed in the embankment adjacent to the water outlet of the pond, which was easily eroded by water flow during water abstraction. Therefore, we recommend keeping track of these holes to know whether they are expanding. The embankment of Pond 9-6 was approximately 1,552 m long, the cumulative length of structural damage was approximately 258.5 m, a percentage of 16.7%. The damages were in the form of holes and subsidence, mainly distributed near the inlets of the north embankment and the south embankment. In addition, by determining the type, quantity, and spatial distribution of damage to the embankment structure, the accident risk of the embankment structure at the damaged sites was assessed. Based on inspection experience of and previous literatures, the risk classification of the embankment structure using the GPR method and the maintenance recommendations are detailed in (Caselle et al. Citation2020; Alsharahi et al. Citation2021). If the risk is high, there is visually obvious damage such as cracks, subsidence, or fractured zones at the site, and the depth of the hole indicated by the GPR signal exceeds 1 m, the repair works should be carried out as soon as possible. If the risk is relatively high, even if there is no obvious damage at the site and if the large holes caused by water scouring can be ruled out, then the hole signal is caused by local soil loosening or the gradation of pores and gravel inside the embankment. As a result, the hole area should be tracked to continuously observe whether the hole area has an expanding trend. It is recommended that parallel GPR survey lines or ERT detection can be done around the hole area.
Table 4. Risk classification of the embankment structure according to the type of GPR abnormal signal.
After classification according to the above principles, the damage to the embankment structure of Pond 9-8 has a mild risk level and needs to be tracked regularly, whereas the embankment of Pond 9-6 has at a relatively high-risk level. The distance, depths, types, and risk of damage to the embankment structure of the two ponds are listed in and . By superimposing the GPR and ERT profiles, we found that ERT yielded significantly higher water contents of the embankment structure below the locations marked with dense holes and subsidence than GPR did. This is likely because the pond water penetrated into the embankment structure through the holes and propagated downward and outward, eventually leading to leakage on the outside of the embankment. To this end, the USV was used to collect bathymetric point cloud data along the inner side of the north embankment of Pond 9-8, which indicated that the embankment structure had collapsed. This finding was verified when the pond was at a low water level, which evidenced the ability of MBES point cloud data to identify damage to underwater structures ().
Figure 16. (a) The distribution of bathymetric point cloud data on the Northern embankment of pond 9-6; (b) the collapse location shown by the point cloud data (the red rectangle); (c) the photo of the collapse at low water level taken on 15 Nov 2022.
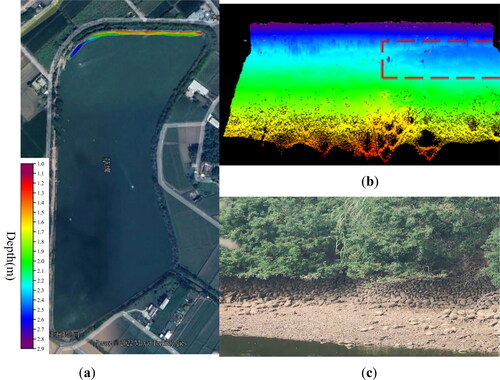
Table 5. The distance, depth, feature identification, and risk classification based on the GPR detection results of Pond 9-6 in the Taoyuan Canal.
Table 6. The distance, depth, feature identification, and risk classification based on the GPR detection results of Pond 9-8 in the Taoyuan Canal.
Conclusions
To improve the utilization efficiency of water resources, existing ponds are redeveloped to introduce functions other than agricultural irrigation to them, including solar power generation, flood detention, and industrial water use. However, there is limited spatial information available for most ponds, such as water depth and water surface area, causing difficulties in subsequent development, renovation and changes in use. In this study, underwater scanning imaging through multibeam detection not only accurately estimated the water area and effective water storage capacity of the pond but also was used to inspect the structural and other damage under the water surface, showing it can be used for improvement projects such as pond leakage reduction, dredging, and embankment enhancement. What is surprising is the potential of MBES for ecological investigation. These show that USV equipped with MBES has outstanding applicability. The risk level of the embankment structure is classified based on the GPR method. In addition, the GPR and ERT detections successfully determined the leakage positions under the embankment structures. From a management perspective, the use of USV equipped with MBES, GPR and ERT provide a more efficient, automated and precise method to monitor an irrigation pond and conduct a risk assessment. This cannot easily be accomplished through visual inspection in the past. Since there is no other relevant evidence for the direct relationship between the risk level and the pond safety, more data are needed to further verify this relationship. Hence, the above risk classification does not cover the overall pond safety but mainly facilitates the Taoyuan Management Office in its daily inspection work.
Data availability statement
The data that support the findings of this study are available from the corresponding author, H. C. Shih, with the permission of Taoyuan Management Office, Irrigation Agency, Ministry of Agriculture, Republic of China (Taiwan). Restrictions apply to the availability of these data, which were used under license for this study.
Disclosure statement
No potential conflict of interest was reported by the author(s).
Additional information
Funding
References
- Alsharahi G, Bouami MF, Faize A, Louzazni M, Khamlichi A, Atounti M. 2021. Contribution of analysis and detection the risks appearing in roads using GPR method: a case study in Morocco. Ain Shams Eng J. 12(2):1435–1450. doi: 10.1016/j.asej.2020.10.014.
- Calder BR, Mayer LA. 2003. Automatic processing of high‐rate, high‐density multibeam echosounder data. Geochem Geophys Geosyst. 4(6):1048. doi: 10.1029/2002GC000486.
- Caselle C, Bonetto S, Comina C, Stocco S. 2020. GPR surveys for the prevention of Karst Risk in underground gypsum quarries. Tunn. Undergr. Space Technol. 95:103137. doi: 10.1016/j.tust.2019.103137.
- CHCNAV. 2024. Apache 6 Multibeam marine drone. Shanghai. China: CHC Navigation Inc. [accessed 15 January 2024]. https://chcnav.com/uploads/APACHE%206_DS_EN.pdf.
- Chung Y-D, Yeh T-K, Xu G, Chen C-S, Hwang C, Shih H-C. 2016. GPS height variations affected by ocean tidal loading along the coast of Taiwan. IEEE Sensors J. 16(10):3697–3704. doi: 10.1109/JSEN.2016.2538325.
- Council of Agriculture (COA). 2023. Agricultural Green Energy Development Information. Republic of China (Taiwan): Council of Agriculture. Executive Yuan. [accessed 15 March 2023]. https://age.triwra.org.tw/.
- Fang W-T, Chang T-K. 2004. The landscape ecological design of Taoyuan Plateau and ponds. In Proceedings of Taoyuan Canal Water Resources and Operation Academic Symposium. Republic of China (Taiwan): Taoyuan Irrigation Association. Council of Agriculture. Executive Yuan. (in Chinese).
- Filomena D, Anna D, Lorenza E, Flavia F, Francesco S, Anna S, Stefania S, Giuseppe C, Vincenzo DF, Michele P, et al. 2014. Application of ERT and GPR Geophysical Testing to the Geotechnical Characterization of Historical Sites. In 20th IMEKO TC4 International Symposium and 18th International Workshop on ADC Modelling and Testing Research on Electric and Electronic Measurement for the Economic Upturn. Benevento. Italy. September 15–17.
- Harry MJ. 2009. Ground penetrating radar theory and applications. Amsterdam: Elsevier Science. doi: 10.1016/B978-0-444-53348-7.X0001-4.
- Hung Y-C, Wan H-H, Tsai P-Y, Liao W-T, Tseng K-H. 2019. Using UAV with low-cost sonar to measure parameters of ponds. ISPRS J Photogramm Remote Sens. 24(2):135–146. doi: 10.6574/JPRS.201906_24(2).0005.(in Chinese).
- Hwang J-C. eds 2019. Centennial history of the Taoyuan Irrigation Association. Republic of China (Taiwan): Taoyuan Irrigation Association. Council of Agriculture. Executive Yuan. [accessed 15 March 2023]. https://tia100.azurewebsites.net/ebook/#/ebook;book=01.
- International Hydrographic Organization (IHO). 2020. International Hydrographic Organization Standards for Hydrographic Surveys (S-44). International Hydrographic Organization eds. 6th ed. Monaco.
- John YT, Isa W, Nicole DA, Scott D, Rachel JG, William MP, Nail KG, Gregory GS, David HS. 2010. Measuring sediment accretion in early tidal marsh restoration. Wetlands Ecol Manage. 18(3):297–305. doi: 10.1007/s11273-009-9170-6.
- Kim B, Kim J, Cho H, Kim J, Yu S-C. 2020. AUV-based multi-view scanning method for 3-D reconstruction of underwater object using forward scan sonar. IEEE Sensors J. 20(3):1592–1606. doi: 10.1109/JSEN.2019.2946587.
- Lee J-Z. 2021. Report on emergency treatment of the hollow part underneath the embankment of pond 9-8 in the Taoyuan Canal. Taoyuan Irrigation Association. Council of Agriculture. Executive Yuan. Republic of China (Taiwan). Tech. Rep. (in Chinese).
- Lewicka O, Specht M, Stateczny A, Specht C, Dardanelli G, Brčić D, Szostak B, Halicki A, Stateczny M, Widźgowski S. 2022. Integration data model of the bathymetric monitoring system for shallow waterbodies using UAV and USV platforms. Remote Sens. 14(16):4075. doi: 10.3390/rs14164075.
- Liu H-C, Yang C-H, Wang T-P. 2016. Geoelectrical mapping of the soil and groundwater contaminated site: case study from Taiwan. In Proceedings of the 7th International Conference on Environment and Engineering Geophysics & Summit Forum of Chinese Academy of Engineering on Engineering Science and Technology. Beijing. China. Jun. 26–29. doi: 10.2991/iceeg-16.2016.110.
- Lowe RH. 1956. The breeding behaviour of Tilapia species (Pisces; Cichlidae) in Natural waters: observations on T. Karomo Poll and T. Variabilis Boulenger. Behaviour. 9(1):140–162. doi: 10.1163/156853956X00282.
- Lubczonek J, Kazimierski W, Zaniewicz G, Lacka M. 2021. Methodology for combining data acquired by unmanned surface and aerial vehicles to create digital bathymetric models in shallow and ultra-shallow waters. Remote Sens. 14(1):105. doi: 10.3390/rs14010105.
- Maurell IP, Dos Santos MM, De Oliveira Evald PJD, Justo BH, Arigony-Neto J, Antônio WV, Botelho SSC, Drews-Jr PLJ. 2022. Volume change estimation of underwater structures using 2-D sonar data. IEEE Sensors J. 22(23):23380–23392. doi: 10.1109/JSEN.2022.3213780.
- Ministry of Interior (MOI). 2022. Specification of bathymetric surveys. Republic of China (Taiwan): Ministry of Interior. Executive Yuan. (in Chinese).
- Ministry of Justice (MOJ). 2021. Regulations on governing the inspection and safety assessment of water conservancy structures. Republic of China (Taiwan): Ministry of Justice. Executive Yuan. [accessed 15 March 2023]. https://law.moj.gov.tw/LawClass/LawAll.aspx?pcode=J0110050.
- Nicole DA, John YT, Bruce J, Brian JH, Amy CF. 2010. Mapping elevations of tidal wetland restoration sites in San Francisco Bay: comparing accuracy of aerial lidar with a Singlebeam Echosounder. J Coast Res. 26(2):312–319. doi: 10.2112/08-1076.1.
- NORBIT. 2023. NORBIT-iWBMS Turnkey Multibeam Sonar System. Trondheim, Norway: NORBIT Inc. [accessed 15 March 2023]. https://norbit.com/media/PS-120006-23_iWBMS_Pn_12004_AACDB4_A4.pdf.
- Northern Region Water Resources Office (NRWRO). 2006. Feasibility Assessment for the Auxiliary Water Supply to Domestic and Industrial Uses through Water Ponds in Taoyuan. Republic of China (Taiwan): Water Resources Agency. Ministry Economic Affairs. (in Chinese).
- Rhee J-Y, Park K-T, Cho J-W, Lee S-Y. 2021. A study of the application and the limitations of GPR investigation on underground survey of the Korean Expressways. Remote Sens. 13(9):1805. doi: 10.3390/rs13091805.
- Rowley J. 2018. Autonomous unmanned surface vehicles (USV): a paradigm shift for harbor security and underwater bathymetric imaging. In Proceedings of the OCEANS 2018 MTS/IEEE. Charleston. SC. USA. May 28-31. doi: 10.1109/OCEANS.2018.8604611.
- Seto ML, Crawford A. 2015. Autonomous shallow water bathymetric measurements for environmental assessment and safe navigation using USVs. In Proceedings of the OCEANS 2015 MTS/IEEE. Washington. DC. USA. Oct. 19-22. doi: 10.23919/OCEANS.2015.7404407.
- Shyue S-W, Shih T-Y, Wu H-Y, Wang W-H, Wang S-H, Liu-Huang T-L. 2014. Research on the errors of single beam echo sounding. J Coast Ocean Eng. 14(2):121–131. doi: 10.6266/JCOE.2014.1402.04.(in Chinese).
- Song L-Y, Yadav R, Liang H-C. 2018. Research on eco-friendly solar energy generation in Taoyuan Pond. In Proceedings of the 2018 IEEE International Conference on Advanced Manufacturing. Yunlin. Republic of China (Taiwan). Nov. 16-18. doi: 10.1109/AMCON.2018.8614887.
- Su P-W, Lo S-L. 2021. Using Landsat 8 imagery for remote monitoring of total phosphorus as a water quality parameter of irrigation ponds in Taiwan. Environ Sci Pollut Res Int. 28(47):66687–66694. doi: 10.1007/s11356-021-15159-9.
- Wang T-P, Chen C-C, Tong L-T, Chang P-Y, Chen Y-C, Dong T-H, Liu H-C, Lin C-P, Yang K-H, Ho C-J, et al. 2015. Applying FDEM, ERT and GPR at a site with soil contamination: a case study. Appl Geophys. 121:21–30. doi: 10.1016/j.jappgeo.2015.07.005.
- Wessel P. 2016. Regional–residual separation of bathymetry and revised estimates of Hawaii plume flux. Geophys J Int. 204(2):932–947. doi: 10.1093/gji/ggv472.
- Wessel P, Luis JF, Uieda L, Scharroo R, Wobbe F, Smith WHF, Tian D. 2019. The generic mapping tools version 6. Geochem Geophys Geosyst. 20(11):5556–5564. doi: 10.1029/2019GC008515.
- Xu Y, Kanai S, Date H, Sano T. 2022. Deep-learning-based three-dimensional detection of individual wave-dissipating blocks from as-built point clouds measured by UAV photogrammetry and multibeam echo-sounder. Remote Sens. 14(21):5575. doi: 10.3390/rs14215575.
- Yu F-C, Chang K-T, Liang L-S. 2013. Multitemporal change analysis of the relationship of water ponds and urban change - Taoyuan, Taiwan. In Proceedings of the 2013 IEEE International Geoscience and Remote Sensing Symposium. Melbourne. VIC. Australia. July 21-26. doi: 10.1109/IGARSS.2013.6723374.
- Zhou B. 2019. Electrical resistivity tomography: a subsurface-imaging technique. In Applied geophysics with case studies on environmental, exploration and engineering geophysics. United Kingdom: IntechOpen. doi: 10.5772/intechopen.81511.