
 ?Mathematical formulae have been encoded as MathML and are displayed in this HTML version using MathJax in order to improve their display. Uncheck the box to turn MathJax off. This feature requires Javascript. Click on a formula to zoom.
Abstract
The primary objective of this paper is to delve into the underlying driving forces behind changes in the ecological environment. To achieve this, the paper not only analyzes the multifaceted social, economic, and natural aspects of the composite ecosystem but also develops an ecological environment change evaluation model employing the topological hierarchy-entropy weight method. This model serves as a valuable tool for assessing trends and determining the drivers of ecological change. As a case study, the paper focuses on Gaoqiao Town, located in Yan’an City, Shaanxi Province. It involves a meticulous process of processing multi-year remote sensing images of the study area,as well as image cropping to extract and decode natural index data. Additionally, the paper utilizes social and economic data alongside survey data from annual reports published by local governments within the study area. These datasets are then subjected to the proposed model to evaluate ecological changes in the region. The results show that the modelling approach introduced in this paper effectively captures the ecological changes and their underlying causes in the selected areas, and can provide valuable references for government departments to formulate wise ecological environmental protection and management policies.
1. Introduction
The ecological environment is a comprehensive system centered on human society, supporting sustainable economic and agricultural development. It comprises ecological and environmental elements within a specific area, including organisms, soil, water, air, geology, and topography (He et al. Citation2018). As human activities increase, resource overuse, and environmental degradation, environmental issues become increasingly pressing. In the context of global environmental protection, many studies have begun to pay attention to the changes in the ecological environment, and then think about how man and nature can live in harmony and achieve sustainable development. This is a global issue that requires us to work together and take effective measures to address the changes in the ecological environment in order to protect our common home on Earth.
Ecological and environmental assessment is one of the more important tasks. It is essential for maintaining ecological balance, reducing environmental stress, promoting sustainable development and safeguarding ecosystems and human health. It also helps to determine the sensitivity of ecosystems to various types of changes and to develop appropriate adaptation strategies.
Ecological and environmental assessment is a method of quantitative and qualitative analysis of environmental quality and ecosystem impacts, aimed at providing a scientific basis for environmental protection and sustainable development. Early assessment methods mainly include field surveys, sample collection and analyses to obtain environmental indicators, such as air, water quality and soil, and to understand their current status and trends. Early results include regional and thematic assessments to reveal the overall state of the environment and specific environmental issues. Although some results were achieved in the early assessments, there were problems such as single indicators and inaccurate results, and with the development of science and technology, modern ecological and environmental assessment methods were gradually formed and widely used.
Since the twentieth century, research on ecosystem assessment has developed rapidly, from single indicators to multi-factor integrated evaluation For instance, Ladson et al. (Citation1999) evaluated the Australian watershed using 22 indicators based on hydrology theory. The Organization for Economic Cooperation and Development (OECD) (Berger and Hodge Citation1998) introduced a pressure-state-response model for assessing Africa’s Sahara region’s ecological quality. In the late 1980s, Earth exploration satellites and 3S technology (RS, GIS, GPS) became essential for ecological environment assessment. Scholars used satellite remote sensing images for quantitative analysis. For example, Basso et al. (Citation2000) used GIS and RS techniques to study Italy’s Agri Basin’s desertification environment. Rhee et al. (Citation2010) introduced the Scaled Drought Condition Index (SDCI) using MODIS data to assess drought effects.Although these studies have made some progress, they still have some limitations, such as neglecting socio-economic factors, lack of long-term monitoring data, and difficulty in adapting to the needs of different regions and scales.
Some studies focused on pollution control and natural disaster monitoring. For example, Ronghua et al. Citation2000, created a comprehensive evaluation map of Hainan Province using landscape ecology theory. Siyuan et al. Citation2002, used principal component analysis to assess Hubei Province’s ecological environment quality. Xu Citation2013, introduced the Remote Sensing Ecological Index RSEI based on remote sensing images.In 2021, Tang Yanwen et al. (Tang Citation2021) applied the remote sensing ecological index RSEI, utilizing the principal component analysis method to comprehensively analyze indicators such as greenness, humidity, dryness, and heat.
In addition, the field of ecosystem assessment continues to evolve, with emerging technologies and methods such as geographic information systems (GIS), remote sensing, ecological modelling and data analysis tools providing more accurate assessment tools (Xuan et al. Citation2022; Turner et al. Citation2015; Pettorelli et al. Citation2014; Zhang et al. Citation2022).
Many other scholars have worked to improve evaluation methods and indicators with the aim of increasing the quality, accuracy and transparency of research and evaluation (Shelar et al. Citation2023). The application of game theory, entropy weight method, and extended analytic hierarchy process to ecological evaluation forms a multidisciplinary research domain that spans various fields, including ecology, mathematics, and environmental science (Yang et al. Citation2016; Jifei and Shuai Citation2022). These endeavors collectively contribute to a more comprehensive and scientifically grounded assessment of ecosystem conditions and health.
Building on the above, many studies have further found that ecosystems are dynamic and constantly changing systems. In addition to the current state at a given time, more attention should be paid to its changes, developmental processes, and the internal mechanisms that drive these changes. Ecosystems can also be viewed as complex socio-economic natural systems, including human societies (Ostrom Citation2009; Farley and Voinov Citation2016; Shuai et al. Citation2018). For policy makers, monitoring and assessing ecosystem quality is crucial, taking into account a variety of factors (Liu et al. Citation2015).
Current ecosystem assessment mainly relies on natural indicators to analyse the current status of objects.In the 1920s, the emergence of new eco-development concepts, such as ‘carbon neutrality’ and ‘green industry,’ put forward new requirements for ecosystem assessment, so relying only on natural indicators for the current status analysis can no longer meet the needs of the current ecosystem assessment.
Therefore, relying only on natural indicators to analyse the current situation can no longer meet the requirements of the current stage. Natural indicators mainly reflect the current state, but ecosystem assessment should also consider the potential drivers of change.
Therefore, this paper classifies ecosystem assessment indicators into three dimensions: social, economic and natural. This not only improves and enriches ecosystem assessment, but also reflects the relationship between humans and nature. This makes the results of environmental assessment more meaningful and can provide a useful reference for the sustainable development of human society.
In order to better understand the article, the organization of the article is described as follows. First is the introduction of data and methods in Chapter 1, in which the driving mechanism can better illustrate the theoretical support for the modelling of the article; the data sources include remotely sensed imagery and socio-economic data; the methods are expressed as a combination of EWA, THA, GT, and TOPSIS applications. Chapter 2 carries out the specific extraction of data and the specific application of the method in Anse District, Yan’an City. Chapter 3, based on the results of this model evaluation, compares the results with another environmental evaluation results to verify the validity of the results of this paper. Finally, further discussion and conclusion are made.
In general, there is a wide variety of environmental assessment methods. However, traditional methods rely on field surveys and measurements, which limit their applicability because of regional differences. Remote sensing ecological indices offer advantages, but their application is constrained by spatial extent and data variability. Existing norms focus on natural indicators and need to consider social, managerial, and economic factors for long-term trend evaluations.In the process of researching the data, it was found that many data before 2001 fluctuated a lot, so in order to increase the temporal variability of the research object and to ensure the extractability and validity of the data,selects remote sensing imagery and socio-economic data from 2001 to 2021, and creates an ecological environment change evaluation model based on topological hierarchy-entropy weights. This method provides a useful reference for government environmental policies based on actual environmental changes.
2. Data and methods
2.1. Data extraction and interpretation
The article utilizes remote sensing image data acquired from the Landsat series of satellites as the primary data source for remote sensing interpretation. This data is obtained from two distinct repositories: the Geographical Space Data Cloud website in China and the United States Geological Survey (USGS) website. presents a selection of satellite image data parameters.
Table 1. Details on satellite landsat images.
The primary components of image pre-processing procedure encompass radiometric correction, atmospheric correction, geometric correction, and image cropping.Following the aforementioned image processing steps, the ultimate remote sensing image was extracted from the Shape file associated with the designated study area. Subsequently, the extraction of ecological remote sensing data was conducted.
Distinct scenic characteristics are associated with various features, and these distinctive features manifest differently in images. These distinctions serve as pivotal indicators for interpreting different features. Among the plethora of recognizable and extracted feature interpretation data, the most indicative metric for assessing the quality of the regional ecological environment is the information pertaining to vegetation cover. In this study, we directly extract the greenness information from the remote sensing image to provide a comprehensive depiction of the current state of vegetation growth within the evaluation area. The process unfolds as follows:
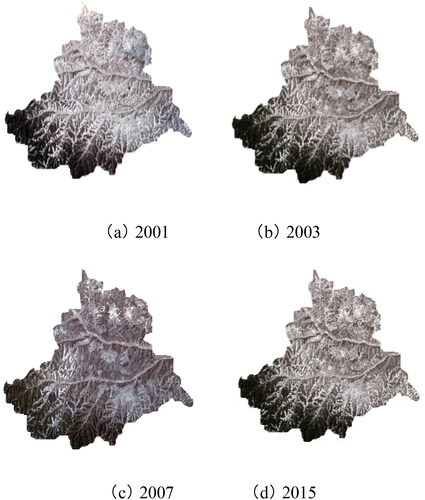
As an illustrative case, this study focuses on Gaoqiao Town in the Anse District of Yan’an City, Shaanxi Province. The research involves the acquisition of remote sensing images from the same season but different years, selecting periods primarily within the June–August time frame, and prioritizing satellite imagery with minimal cloud cover. To prevent redundant processing of remote sensing images beyond the study area, the paper utilizes the vector boundary file of the Anse District in Yan’an City to perform irregular cropping, thereby obtaining image data specific to Gaoqiao Town. displays the resulting remotely sensed cropped images for select time periods.
Figure 1. Town Landsat image data of Gaoqiao Town (a) 2001, (b) 2003, (c) 2005, (d) 2015.
For conveying information related to vegetation cover and its growth status, the prevalent choice is the employment of a greenness index (Wu et al. Citation2012). In this paper, we adopt this index to articulate vegetation cover information, and the calculation formula for extracting this index from remote sensing data is as follows:
(1)
(1)
In the formula: is the value of reflection in the near infrared band, and
is the value of reflection in the mid-infrared band.
The indicators are quantified using EquationEquation (2)(2)
(2) , resulting in evaluation values within the range of [0–1].
(2)
(2)
In the formula: N is the regularized image value, is the original value of image i,
is the maximum value of the image,
and is the minimum value of the image.
Following the pre-processing phase, the remote sensing data processing system, utilizing ENVI 5.3, proceeded to process the image. Subsequently, employing EquationEquation (1)(1)
(1) to calculate the greenness index and applying the regularization as per EquationEquation (2)
(2)
(2) , the system generated the distribution map of the greenness index information for Gaoqiao Town in previous years, as depicted in (a).
Figure 2. Index image of Gaoqiao Town (a) the Greenness index, (b) the dryness index, (c) the humidity index, (d) the heat index.
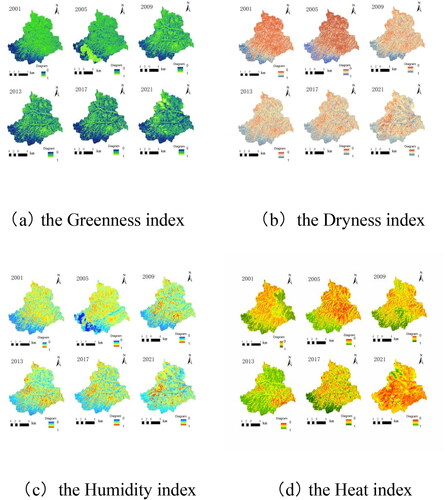
Heat and dryness indices are also extracted in this paper. Among them, for the heat index, the ground temperature needs to be obtained firstly. In this paper, the Landsat-5TM data are corrected for brightness temperature to obtain the ground temperature, and the correction formula is given in EquationEquation (3)(3)
(3) .
(3)
(3)
(4)
(4)
LTIR is the radiation calibration value in the thermal infrared band, K1 and K2 are the calibration coefficients.
T is the brightness temperature, λ is the centre wavelength of the thermal infrared band, and ε is the surface specific emission rate.
For Landsat-8 0LI data, on the other hand, the plug-in in ENVI 5.3 was used to directly perform temperature inversion to obtain thermal indicators.
For the dryness index, the building index IBI and the bare soil index SI were synthesised as in EquationEquation (5)(5)
(5) . where IBI and SI were obtained by spectrally selective calculations using ENVI5.3, which will not be elaborated here.
(5)
(5)
This paper follows the same method to extract the information index of ground humidity in the past years through remote sensing information, and obtains the final index of ground humidity after normalization. The formula is as follows.
The final index image is obtained, see . In the 2005 imagery, some of the images show some patchiness in the lower left corner due to cloud cover. The data have been checked and have no effect on the results.
To validate the remote sensing results, this paper adopts indicator correlation analysis and field validation.
In the indicator correlation analysis, to mitigate the impact of extensive water bodies on the humidity index, an evaluation was conducted involving the application of a water mask. Subsequently, the humidity index was derived from the remote sensing image after undergoing KT transformation processing. This approach enables a more accurate representation of soil water content and surface vegetation humidity, both of which are closely linked to ecological changes, including soil physical and chemical degradation. The results are shown in .
Figure 3. Index and sub index changes.
Humidity levels are higher in regions adorned with vegetation cover, and this humidity distribution is intricately linked to human activities. As shown in , changes in vegetation cover and surface moisture show a degree of correlation, which is more in line with the relationship between vegetation and moisture in real situations (Xiaoting et al. Citation2022), indirectly indicating the validity of the extracted ecological indicators. Similarly, comparing other data on this occasion, such as the dryness index with the humidity index, shows a degree of correlation (inverse relationship).
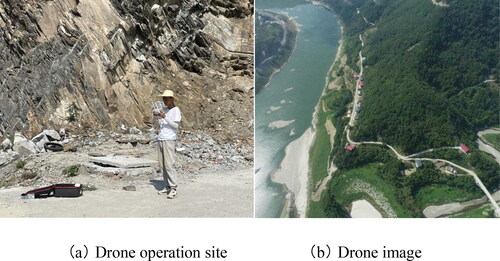
For field validation, fixed-point UAV imagery and ground truth data are taken for validation, as shown in . Corresponding accuracy values have been included in .
Figure 4. Unmanned aerial vehicle verification (a) drone operation, (b) drone image.
2.2. Ecosystem driving mechanisms
Contemporary ecosystem evaluation predominantly hinges on inherent natural indicators of the evaluation subject to analyze its present condition. Nevertheless, ecosystems are dynamic and constantly evolving. Beyond scrutinizing their static state at a given moment, it is imperative to also focus on comprehending the system’s changing trajectory and the intrinsic drivers behind its evolution.
In the context of the entire ecosystem, the influence of the natural dimension on it is direct and immediate, whereas the impact of the social and economic dimension is primarily indirect and gradual (Adger Citation2000; Ostrom Citation2009). The mechanism by which the latter affects the ecology is primarily by influencing certain natural factors first and subsequently impacting the ecosystem through these natural variables. This phenomenon underscores the delayed effect of socio-economic dimensions on the ecological system. As human awareness of natural changes grows, adjustments are made in the social and economic domains, driven by shifts at the natural level. In essence, the natural dimension tends to manifest more immediate outcomes and conditions, while the social and economic dimension serves as an internal catalyst shaping these ‘outcomes and conditions.’ The driving mechanism is illustrated in following the above analysis. Delving into these mechanisms not only enhances our comprehension of the ecosystem but also aids in the selection and modeling of pertinent indicators.
Figure 5. Ecosystem driving mechanisms.
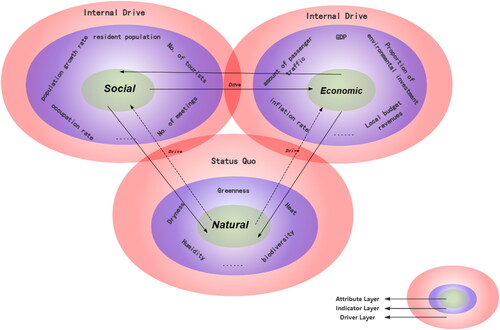
In China, prevailing norms, regulations, and guidelines, such as the Technical Specification for the Evaluation of the State of the Ecological Environment, propose evaluation indicators primarily centered on natural metrics. These indicators are well-suited for assessing the present state of regional ecological environments. However, when the objective is to evaluate the evolving ecological conditions within a region over a defined time frame or to make predictive assessments, it becomes imperative to consider the impact of additional variables on regional environmental changes. Notably, this includes social and economic factors (Yaxian et al. Citation2022).
2.3. Entropy weight method (EWM)
In information theory, entropy primarily serves as a metric for researching the uncertainty of objects. In each index, entropy values are employed to calculate weights. Notably, a smaller entropy value signifies higher informativeness and greater importance in the evaluation process (Huang et al. Citation2017). The entropy weight method is an objective allocation approach.
2.4. Topological hierarchy analysis (THA)
The conventional hierarchical analysis method assesses only a particular scale value. In this paper, an innovation is introduced by incorporating interval numbers to enhance the traditional hierarchical analysis technique. Consequently, a hierarchical analysis framework based on interval numbers, referred to as Improved Topological Hierarchical Analysis (THA), is devised for determining subjective weights. This enhanced approach enables the assessment of indicator significance considering both ‘fuzzy uncertainty’ and ‘stochastic uncertainty’, thereby elevating the credibility of the evaluation method.
2.5. Game-theoretic combination empowerment (GT)
Objective weighting can sometimes yield inaccurate assessment results due to sample data, while subjective weighting can be significantly influenced by human experience. To address these challenges, a combination of subjective Topological Hierarchy Analysis and objective Entropy Weighting is employed, and the resulting evaluation indices are then merged and weighted using game theory principles. This approach not only seeks to achieve consistency in the evaluation indicator weights across various assignment methods but also aims to minimize the deviation between the combined weights of each evaluation indicator and the individual weights determined by each assignment method (Jiahui and Deshan Citation2018).
2.6. TOPSIS
TOPSIS, also known as the Ideal Solution Method, represents a widely employed multi-objective decision analysis technique. It involves calculating the relative ‘distance’ of each solution from the ideal solution, resulting in a ranking that highlights the strengths and weaknesses of each solution. In the context of this study, where the objective is to capture spatio-temporal differential changes, the programmatic ranking outcomes derived from TOPSIS are a suitable basis for evaluation results.
2.7. Method summary
In alignment with the preceding discussion, the concepts and methodologies outlined in this paper are synthesized here, as depicted in , to offer a more comprehensive illustration of the construction of the evaluation model.
Figure 6. Introduction to method flow.
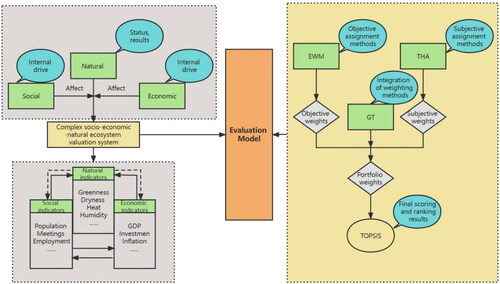
In general, each method has its advantages and disadvantages (Liu et al. Citation2023). The advantage of EWM lies in the fact that the results are based on data analysis and calculation, making them more objective and accurate. However, it cannot take into account subjective feelings and value judgments of individuals. THA, on the other hand, takes into account human value judgments and improves traditional analytical hierarchy process by introducing interval numbers to enhance the credibility of evaluation methods. Nevertheless, sole reliance on subjective evaluations may lack persuasiveness, necessitating the integration of both methods using game theory. This approach has the advantage of considering subjective perspectives while also extracting objective data. Finally, TOPSIS has a unique advantage in evaluating multiple objects with similar attributes, reflecting the differences among various evaluation targets. By combining the aforementioned methods, evaluation work can be conducted more effectively.
3. Example application
3.1. Study area
Gaoqiao Town is located in Ansai District, Yan’an City, Shaanxi Province (), in the middle reaches of the Xichuan River, the south of Ansai District, east of Zaoyuan Town, Baota District, south of Louping Township, west of Brick Yowan Township, and to the north of the townships of Hewan and Zhaoyan. Ansai District covers an area of 25 kilometers from east to west and 24 kilometers from north to south, with a total area of 308.37 square kilometers, under the jurisdiction of a total of 11 administrative villages, which are located in the 36°30′45″—37°19′3″, 108°5′44″—109°26′18″.
Figure 7. Geographical location of Gaoqiao Town.
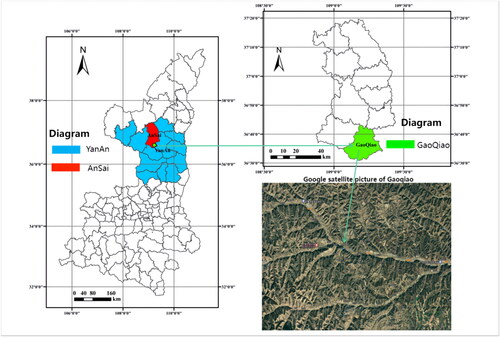
Gaoqiao Town is also situated within the Yellow River Basin and serves as a significant source for the Wei River, necessitating the protection of its water resources. The town boasts a diverse topography and ecological landscape, encompassing mountains, hills, rivers, and lakes, which plays a vital role in preserving ecological equilibrium and biodiversity.
3.2. System application
The study of ecosystem driving mechanisms not only enhances our understanding of ecosystems, but also helps in the selection and modelling of relevant indicators. In the analyses in Chapter 1, we know that natural indicators generally serve as the foundation of the ecology, while social and economic indicators are the driving forces that make the ecology undergo dynamic changes on the foundation. Therefore, the assessment of ecology should not only choose natural indicators, but should also take into account social and economic indicators.
On the basis of the analyses in the previous chapter, we carried out example operations, using the Technical Specification for Ecological Condition Assessment in China as a guide, supplemented by relevant literature (Jørgensen et al. Citation2013; Behling et al. Citation2015; Yang et al. Citation2019), and a large amount of historical survey data over the years in the study area (Rui et al. Citation2015; Xu et al. Citation2019), we extracted a preliminary set of indicators.In the subsequent refinement of indicators, we aimed to reduce subjectivity by minimizing the inclusion of qualitative measures. Building upon this foundation, we established further index scoring principles, assigned scores to each index, and generated an index score map to facilitate filtering and re-extraction, as illustrated in . In the figure, the initial ensemble of indicators is shown on the left, with three different colours corresponding to different categories.In the centre is the process of assigning scores, which are scored according to the principles ①–⑤ in the diagram, with a score range of 0.0 − 2.5. On the right is the final indicator model.
Figure 8. Evaluation model establishment.
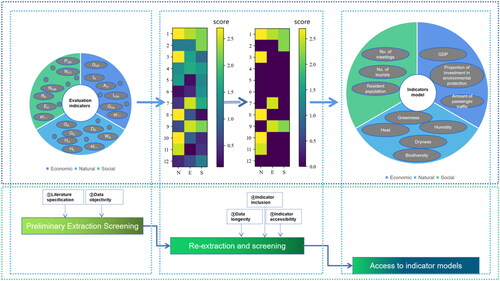
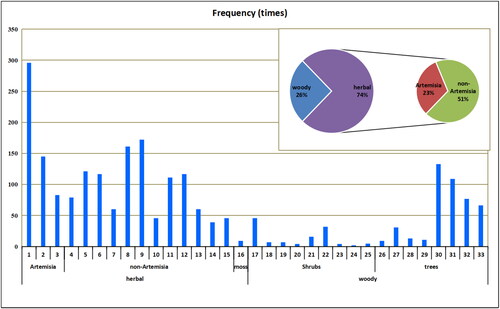
The social-level indicators encompass three key variables: the resident population, tourist numbers, and the number of ecological meeting (Liu and Diamond Citation2005; Liu and Fang Citation2019). The high prevalence of such meetings serves as a testament to the societal emphasis on ecological well-being. Within the economic domain, three critical indicators were chosen: GDP, proportion of environmental investment, and amount of passenger traffic (Cervero Citation2014). These metrics collectively reflect economic growth and its environmental implications. On the natural front, the evaluation incorporated four ecological remote sensing indices and biodiversity indicators obtained through field surveys. The four ecological indicators encompass greenness, humidity, dryness, and heat Shanshan and Fenglei Citation2022; Liu et al. Citation2007). The selection of these 11 quantitative measures was predicated not only on their relevance to the respective dimensions but also on the availability of longitudinal data (Wang et al. Citation2018; Riousset et al. Citation2017). Species diversity in natural indicators mainly refers to plants, and this research team has conducted a continuous survey of plant structural communities in the study area for many years, counting herbaceous and woody plants, as shown in . These data sources, comprising information from official websites, remote sensing statistics, and on-site surveys, collectively underpin the comprehensive evaluation.
Figure 9. Species statistics.
In summary, an environmental evaluation index system has been devised, comprising 3 level 1 indicators and 11 level 2 indicators. Each year’s ecological and environmental status serves as the fundamental unit for assessment, as detailed in .
Table 2. Evaluation index system of environment.
3.3. Method application
The values of the attributes of the ecological environment evaluation indicators of Gaoqiao Town, Anse District are shown in .
Table 3. Attribute value of evaluation index of mine geological environment.
Next we apply these data to the methods mentioned in the first section.The subjective assignment method, specifically the Keto hierarchical analysis method, was employed to ascertain the subjective weight of the evaluation index. In parallel, the objective assignment method, specifically the entropy weight method, was applied to establish the objective weight. Subsequently, a game theory-based approach facilitated the amalgamation of these assignments. The weights assigned to the ecological environment change evaluation indicators are detailed in , and the weight fitting process is illustrated in .
Figure 10. Weight fitting process.
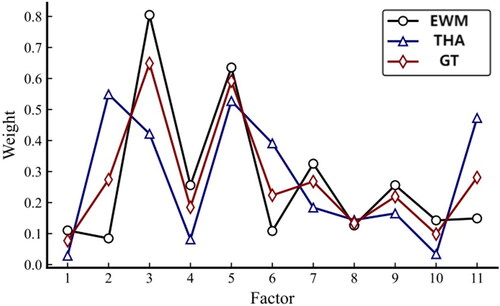
Table 4. Evaluation index weight of ecological environment change.
From the results, it is evident that the number of meetings, the proportion of environmental investment, and the greenness index hold the larger weights within the same category, aligning with the model’s design concept.
4. Results
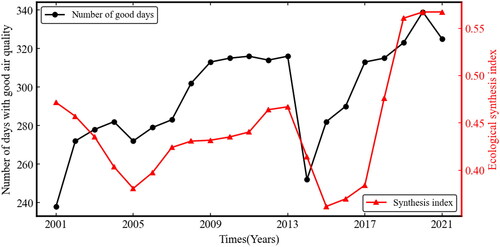
According to the data in and , the TOPSIS method was used to calculate the comprehensive score index of social, economic and ecological indicators for each year of the evaluation object, and then multiple integration was carried out according to the weights to obtain the comprehensive ecological environment change score index. Utilizing the ‘Chronology of Events in the People’s Republic of China’ as a reference, the environmental evaluation culminated in the production of a conclusive map displaying the results (). In numerous research endeavors, the validation of evaluation outcomes serves as a critical yardstick for assessing method accuracy and validity. The number of favorable weather days is a comprehensive data set that focuses on outcomes in terms of environmental change indicators. This explains why this indicator, along with factors such as water quality, was not included in the environmental change assessment but rather reserved for comparative analyses of assessment results (Paoletti et al. Citation2014). Due to the challenge of obtaining historical water quality data for the study area, we compared the final composite scoring index with historical data on the number of favorable air quality days obtained from official sources to assess the accuracy of the evaluation methodology proposed in this paper. shows the consistency between the assessment results and the actual air quality changes, with a clear convergence occurring after 2005. It is worth noting that any differences observed before 2005 can be attributed to factors such as local misreporting and the relatively low level of interest in good air quality days during this period. However, this convergence still emphasis the importance of the methodology presented in this paper as a reference for assessing changes in environmental conditions.
Figure 11. Assessment results of ecological environment change.
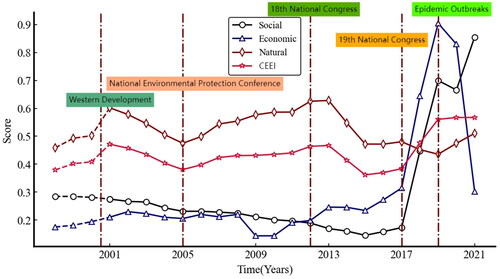
Figure 12. Comparison between the evaluation results and the days of good air quality.
illustrates the developmental trajectories of the evaluation model’s indicators and their aggregated evaluation results. Within this figure, social indicators declined in a relatively flat state until 2017, with large fluctuations in 2019. Economic indicators were relatively flat until 2009, with a gradual upward trend through 2019 and a sharp decline after the epidemic. Natural indicators had a period of increase after 2005, with periods of decline from 2001 to 2005 and from 2012 to 2019.The Composite Eco-Environmental Index (CEEI) for the region portrays a fluctuating pattern, characterized by periods of decrease and subsequent increase, spanning nearly two decades from the late 1990s to 2021. In proximity to each major inflection point, corresponding social events emerge.It is noteworthy that a clear correlation emerges between the declining portion of the CEEI and the pursuit of economic development in an environmental context. Conversely, the ascending phase of the CEEI coincides with a series of policies and conferences aimed at ecosystem preservation.
It is worth noting that the 18th and 19th Conferences are large-scale conferences that combine many aspects. People’s traditional tendency tends to ignore the pointing of relevant environmental aspects. Second, there is a lag in the steps of conference (social) influence on ecology, especially in this kind of large-scale conference, people’s attention tends to focus more on the economic aspects of policies.
Thus, we can be more explicit about ecosystem driving mechanisms from the results. The role of the economic and social dimensions in the driving mechanisms tends to be gradual and has clear phases. The natural dimension, on the other hand, generally serves as the basis for system driving. Moreover, the impact of the economic and social dimensions on the ecosystem is also lagging, which indirectly reflects the significance of ecosystem assessment in long time scales.
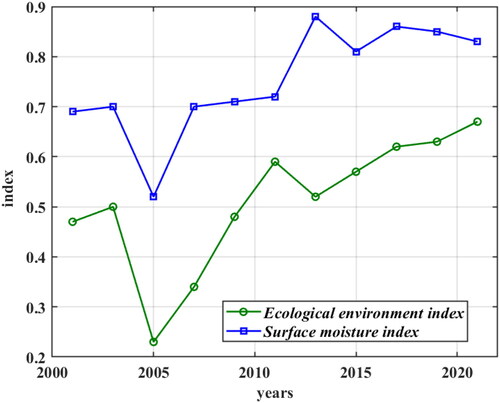
5. Discussion
Detailed analyses can be gleaned from , depicting the ecological environment index trends in Gaoqiao Town. Notably, the evaluation indices for 2005 and 2013 exhibit a downward-then-upward trajectory, contributing to an overall upward trend. When contextualized within the prevailing policies of the time, the index experienced a decline from 0.5 to 0.23 during the 2003–2005 period, primarily attributed to the national strategy of western development. Concurrently, Shaanxi’s economy underwent rapid growth, marked by significant increases in economic prosperity, intensified industrialization, and urbanization. Nevertheless, economic development exacted an environmental toll, particularly evident in industrial pollution, given that Shaanxi’s primary industries included coal, paper, and liquor production. An examination of the ‘Bulletin on the State of the Environment in Shaanxi Province’ for 2003 and 2005 revealed a transition in Yanhe River’s water quality assessment in Gaoqiao Town from ‘polluted’ to ‘seriously polluted.’
Additionally, Shaanxi Provincial Statistical Yearbooks from 2002 to 2006 showed a consistent rise in industrial wastewater discharge rates, with an average annual growth rate of 7.418%. This period corresponded to Shaanxi’s mid-stage industrialization and urbanization, during which environmental pollution remained a substantial concern, with signs of potential intensification. These findings align with the evaluation result graphs presented in this paper. In 2005, the Ministry of Ecology and Environment of the People’s Republic of China organized a national environmental protection conference, prompting regions to prioritize ecological safeguarding, undertake specialized environmental rectification initiatives, and enhance environmental protection legislation. These efforts yielded positive impacts on the ecosystem. Notably, both the natural indicators and composite indicators displayed discernible inflection points in 2005, closely mirroring real-world outcomes.
From 2012 to 2013, the growth of the composite environmental index stagnated, and after 2013, Gaoqiao Town’s overall environmental rating began to decline. The resource and environmental costs of economic growth became increasingly evident due to the Western Development Strategy, leading to a rise in environmental pollution and ecosystem degradation (Yan et al. Citation2022). Widespread occurrences of haze and severe pollution events emerged in many parts of the country. Official environmental data for 2011 and 2012 indicated a severe pollution rating (Category IV) for the river near Gaoqiao Town. Consequently, relevant authorities introduced a series of environmental protection laws and regulations, culminating in the adoption of the amended Environmental Protection Law of the People’s Republic of China in April 2014.
Local governments also responded proactively, exemplified by the Shaanxi Provincial People’s Government’s formulation of the ‘Five-Year Action Plan for Atmospheric Protection’ following the 18th National Congress. These efforts contributed to gradual improvements in ecological indicators and a subsequent decrease in river water pollution in later stages in Gaoqiao Town. Official statistics revealed that the water quality of rivers near the town changed from mildly polluted in 2019 to good in 2021, signifying significant progress in ecological project development.
The 18th and 19th Conferences are large-scale conferences combining many aspects, and the National Environmental Protection Conference is a national conference on environmental topics. The impact situation of these two kinds of conferences is also different, in which the traditional interest tendency of people in large conferences tends to ignore the relevant environmental aspects of the pointers. Secondly, there is a lag in the ecological impact measures of conferences (societies), especially in large multi-thematic conferences, where people’s attention tends to focus more on the economic aspects of policies.
Following the 2019 COVID-19 outbreak, the economy suffered significant impacts. While natural conditions improved somewhat due to reduced human activity, this combination hindered the development of the ‘socio-economic-natural ecosystems.’ In light of this analysis, it becomes evident that ecological sustainability is a prerequisite for human survival and development. Once an ecosystem’s resilience and carrying capacity exceed their limits, the system undergoes qualitative changes.
As we can see from the previous section, the core of the assessment model is the interplay between the natural, social and economic dimensions, embodied in the ecology driving mechanism. In this paper, the assessment model is obtained through the addition of data from the three levels and the combination of various mathematical methods, and the results are obtained and verified, which can be found to be of great practical reference significance.Further analyses are elaborated upon below:
For ecosystems as a whole, the influence of natural factors is direct and immediate, whereas the impact of socio-economic factors is predominantly indirect and gradual. This latter mechanism typically entails an initial effect on certain natural factors, subsequently cascading to the ecosystem level. This implies a degree of delay in the socio-economic sphere’s influence on ecosystems. With increasing human concern regarding natural changes, alterations in natural factors prompt corresponding adjustments in human social and economic systems. In summary, natural factors predominantly convey the current state and outcomes of ecosystems, while socio-economic factors serve as inherent drivers that shape these states and outcomes. The examination of trend maps further affirms the intricate nature of these factors’ impacts on ecosystems, each with its distinct focus.
Based on a comparative analysis of the trend graphs presented above and official environmental data, it is evident that the comprehensive evaluation results derived from the model presented in this paper align with the actual ecological conditions. Furthermore, the observed trends align with long-term analyses from ecological and environmental studies. Additionally, through comparison with significant events, a notable correlation emerges between the evaluation results and these occurrences. Consequently, the model’s results can be employed to assess the extent of various major events’ impact on the ecological environment, with a focus on identifying pivotal events that exert a substantial influence on the ecological landscape. This holds significant practical implications for ecological conservation, sustainable development, and related endeavours.
6. Conclusion
With further refinement of data and indicators, the evaluation model of ecological environment change based on the topical hierarchy-entropy weight method was established through the combination of entropy weight method, topical hierarchy analysis method and game theory to derive the weight size of indicators. This model exhibits some generalization.
By delving into the intrinsic driving mechanisms of ecosystems, it becomes evident that natural factors predominantly reflect the current status and outcomes of ecosystems, while socio-economic factors serve as inherent drivers that influence these states and outcomes. Typically, this latter mechanism first impacts specific natural factors, which subsequently reverberate at the ecosystem level.
In this study, Gaoqiao Town, located in the Anse District of Yan’an City, serves as the designated study area. Leveraging a comprehensive data set spanning more than two decades, this paper applies the proposed evaluation model to impartially and effectively assess the present state and evolving trends of the local ecological environment. The findings unequivocally highlight the model’s substantial potential for practical implementation in large-scale ecological environment investigations and assessments. Furthermore, in conjunction with Yan’an City’s historical environmental protection policies, this study successfully dissects the causes and catalysts behind ecological shifts. This analytical endeavor offers valuable insights to inform governmental policy development and management strategies aimed at environmental protection.
Acknowledgment
We would like to acknowledge the anonymous reviewers.
Disclosure statement
No potential conflict of interest was reported by the author(s).
Data availability statement
The sources of the assessment data for Gaoqiao are listed in .
Additional information
Funding
References
- Adger WN. 2000. Social and ecological resilience: are they related? Prog Human Geogr. 24(3):347–364. doi: 10.1191/030913200701540465.]
- Basso F, Bove E, Dumontet S, Ferrara A, Pisante M, Quaranta G, Taberner M. 2000. Evaluating environment sensitivity at the basin scale through the use of geographic information systems and remotely sensed data: an example covering the Agri basin (Southern Italy). Catena. 40(1):19–35. doi: 10.1016/S0341-8162(99)00062-4.
- Behling R, Bochow M, Foerster S, Roessner S, Kaufmann H. 2015. Automated gis-based derivation of urban ecological indicators using hyperspectral remote sensing and height information. Ecol Indic. 48:218–234. doi: 10.1016/j.ecolind.2014.08.003.
- Berger AR, Hodge RA. 1998. Natural change in the environment: a challenge to the pressure-stste-response concept. Soc Indicat Res. 44(2):255–265. doi: 10.1023/A:1006888532080.
- Cervero R. 2014. Transport infrastructure and the environment in the Global South: sustainable mobility and urbanism. JPWK. 25(3):174–191. doi: 10.5614/jpwk.2015.25.3.1.
- Farley J, Voinov A. 2016. Economics, socio-ecological resilience and ecosystem services. J Environ Manage. 183(Pt 2):389–398. doi: 10.1016/j.jenvman.2016.07.065.
- He L, Shen J, Zhang Y. 2018. Ecological vulnerability assessment for ecological conservation and environmental management. J Environ Manage. 206:1115–1125. doi: 10.1016/j.jenvman.2017.11.059.
- Huang S, Ming B, Huang Q, Leng G, Hou B. 2017. A case study on a combination NDVI forecasting model based on the entropy weight method. Water Resour Manage. 31(11):3667–3681. doi: 10.1007/s11269-017-1692-8.
- Jiahui LU, Deshan T. 2018. Evaluation of the effect of comprehensive water environment management based on game theory combination empowerment. J Water Resour Water Transp Eng. 39(06):105–111. doi: 10.16198/j.cnki.1009-640X.2018.06.014 (in Chinese).
- Jifei Z, Shuai Z. 2022. Assessing integrated effectiveness of rural socio-economic development and environmental protection of Wenchuan County in Southwestern China: an approach using game theory and VIKOR. Land. 11(11):1912.
- Jørgensen ES, Burkhard B, Müller F. 2013. Twenty volumes of ecological indicators – an accounting short review. Ecol Indic. 28:4–9. doi: 10.1016/j.ecolind.2012.12.018.
- Ladson AR, White LJ, Doolan JA, Finlayson BL, Hart BT, Lake PS, Tilleard JW. 1999. , Development and testing of an index of stream condition for waterway management in Australia. Freshwater Biol. 41(2):453–468. doi: 10.1046/j.1365-2427.1999.00442.x.
- Liu J, Diamond J. 2005. China’s environment in a globalizing world. Nature. 435(7046):1179–1186. doi: 10.1038/4351179a.
- Liu J, Dietz T, Carpenter SR, Alberti M, Folke C, Moran E, Pell AN, Deadman P, Kratz T, Lubchenco J, et al. 2007. Complexity of coupled human and natural systems. Science. 317(5844):1513–1516. doi: 10.1126/science.1144004.
- Liu W, Fang Y. 2019. Impacts of large-scale international conferences on local environment and sustainability: a case study of the G20 Hangzhou Summit. Sustainability. 11(6):1585.
- Liu X, Li Z, Liao C, Wang Q, Zhu A, Li D, Li Y, Tang Z. 2015. The development of ecological impact assessment in China. Environ Int. 85:46–53. doi: 10.1016/j.envint.2015.08.004.
- Liu Y, Liu H, Yan C, Feng Z, Zhou S. 2023. Evaluation and dynamic monitoring of ecological environment quality in mining area based on improved CRSEI index model. Heliyon. 9(10):e20787. doi: 10.1016/j.heliyon.2023.e20787.
- Ostrom E. 2009. A general framework for analyzing sustainability of social-ecological systems. Science. 325(5939):419–422. doi: 10.1126/science.1172133.
- Paoletti E, Marco DA, Beddows CDS, Harrison RM, Manning WJ. 2014. Ozone levels in European and USA cities are increasing more than at rural sites, while peak values are decreasing. Environ Pollut. 192:295–299. doi: 10.1016/j.envpol.2014.04.040.
- Pettorelli N, Laurance WF, O'Brien TG, Wegmann M, Nagendra H, Turner W. 2014. Satellite remote sensing for applied ecologists: opportunities and challenges. J Appl Ecol. 51(4):839–848. doi: 10.1111/1365-2664.12261.
- Rhee J, Im J, Carbone GJ. 2010. Monitoring agricultural drought for arid and humid regions using multi-sensor remote sensing data. Remote Sens. Environ. 114(12):2875–2887. doi: 10.1016/j.rse.2010.07.005.
- Riousset P, Flachsland C, Kowarsch M. 2017. Global environmental assessments: impact mechanisms. Environ Sci Pol. 77:260–267. doi: 10.1016/j.envsci.2017.02.006.
- Ronghua M, Mengchun HU, Zhishu P, Huanzhong W. 2000. Analysis and evaluation of ecological environment quality in Hainan Island. Rural Ecol Environ. 16(04):11–14 + 32 (in Chinese).
- Rui X, Lu G, Xunchang L. 2015. Research on growth characteristics and slope protection effect of black sand artemisia in Yan’an area. J Rail Eng. 32(9):19–24 (in Chinese).
- Shanshan F, Fenglei F. 2022. Developing an enhanced ecological evaluation index (EEEI) based on remotely sensed data and assessing spatiotemporal ecological quality in Guangdong–Hong Kong–Macau Greater Bay Area, China. Remote Sens. 14(12):2852. doi: 10.3390/rs14122852.
- Shelar RS, Nandgude SB, Pande CB, Costache R, El-Hiti GA, Tolche AD, Son CT, Yadav KK. 2023. Unlocking the hidden potential: groundwater zone mapping using AHP, remote sensing and GIS techniques. Geomatics Nat Hazards Risk. 14(1):1–27. doi: 10.1080/19475705.2023.2264458.
- Shuai W, Bojie F, Wenwu Z, Yanxu L, Fangli W. 2018. Structure, function, and dynamic mechanisms of coupled human–natural systems. Curr Opin Environ Sustain. 33:87–91. doi: 10.1016/j.cosust.2018.05.002.
- Siyuan W, Zengxiang Z, Xiaoli Z, Quanbin Z. 2002. Comprehensive analysis of ecological environment in Hubei Province based on remote sensing and GIS technology. Adv Earth Sci. 17(03):426–431 (in Chinese).
- Tang YW. 2021. Ecological quality assessment of Dongjiangyuan watershed based on remote sensing ecological index. Jiangxi Univ Sci Technol. 2022(1):13–18 (in Chinese). doi: 10.27176/d.cnki.gnfyc.2021.000588.
- Turner W, Rondinini C, Pettorelli N, Mora B, Leidner AK, Szantoi Z, Buchanan G, Dech S, Dwyer J, Herold M, et al. 2015. Free and open-access satellite data are key to biodiversity conservation. Biol Conserv. 182:173–176. doi: 10.1016/j.biocon.2014.11.048.
- Wang W, Sun Y, Wu J. 2018. Environmental warning system based on the DPSIR model: a practical and concise method for environmental assessment. Sustainability. 10(6):1728. doi: 10.3390/su10061728.
- Wu HY, Chen KL, Chen ZH, Chen QH, Qiu YP, Wu JC, Zhang JF. 2012. Evaluation for the ecological quality status of coastal waters in East China Sea using fuzzy integrated assessment method. Mar Pollut Bull. 64(3):546–555. doi: 10.1016/j.marpolbul.2011.12.022.
- Xiaoting W, Qiang H, Shengzhi H. 2022. Assessing the feedback relationship between vegetation and soil moisture over the Loess Plateau, China. Ecol Indic. 134:108493. doi: 10.1016/j.ecolind.2021.108493.
- Xiaoxin W, Weijun C, Chengming Y. 2022. Evaluation method of cloud model for embankment safety in mountainous areas based on improved empowerment. Adv Water Resour Hydropower Sci Technol. 42(5):58–63 (in Chinese).
- Xu H. 2013. A remote sensing urban ecological index and its application. Shengtai Xuebao/Acta Ecologica Sinica. 33(24):7853–7862. doi: 10.5846/stxb201208301223.
- Xuan W, Yan D, Hongneng F. 2022. Application of remote sensing software in ecological environment evaluation. Software. 43(03):146–148 (in Chinese).
- Xu R, Li X, Yang W, Jiang C, Rabiei M. 2019. Use of local plants for ecological restoration and slope stability: a possible application in Yan’an, Loess Plateau, China. Geomatics Nat Hazards Risk. 10(1):2106–2128.
- Yan W, Naifeng L, Jixi G. 2022. Impacts of China’s western development and protection strategy: An ecosystem services perspective of Western China. Diversity. 14(10):863.
- Yang Y, Li Y, Chen F, Zhang S, Hou H. 2019. Regime shift and redevelopment of a mining area’s socio-ecological system under resilience thinking: a case study in Shanxi Province, China. Environ Dev Sustain. 21(5):2577–2598. doi: 10.1007/s10668-018-0139-6.
- Yang Q, Lin A, Zhao Z, Zou L, Sun C. 2016. Assessment of urban ecosystem health based on entropy weight extension decision model in urban agglomeration. Sustainability. 8(9):869. doi: 10.3390/su8090869.
- Yaxian G, Wei L, Gang H, Shuhang Z. 2022. Evaluation of industrial ecological security in industrial transformation demonstration area based on spatiotemporal differentiation. Geomatics Nat Hazards Risk. 13(1):1422–1440. doi: 10.1080/19475705.2022.2075284.
- Zhang H, Liu Y, Li X, Feng R, Gong Y, Jiang Y, Guan X, Li S. 2022. Combing remote sensing information entropy and machine learning for ecological environment assessment of Hefei-Nanjing-Hangzhou region, China. J Environ Manage. 325(Pt B):116533. doi: 10.1016/j.jenvman.2022.116533.