
ABSTRACT
Regulation of Th17 and Th1 cell responses against intracellular pathogens, including Listeria monocytogenes (L. m), is critical to limit inflammation-induced tissue damage. We recently demonstrated the ability of P. UF1 bacterium derived from the intestinal bacterial commensals of preterm infants fed human breast milk to significantly mitigate pathogen-induced inflammation limiting colonic tissue damage. Here we further elucidated the potential of P. UF1 to also regulate innate and T cells, particularly Th17 and Th1 cells, against systemic L. m infection. Data demonstrate that P. UF1 not only robustly regulated protective Th17 and Th1 cells, but also sustained regulatory T cells (Treg cells) resulting in accelerated L. m clearance. Together, regulation of pathogenic inflammation by a novel probiotic bacterium such as P. UF1 may illuminate a new strategy to specifically control Th17-Th1 cells via IL-10+ Treg cells to limit systemic tissue damage induced by intracellular pathogens, including L. m.
Introduction
P. UF1 bacterium was recently isolated from the gut microbiota of human breast milk (HBM)-fed preterm infants, which conferred protection against pathogens and correlated with profoundly increased intestinal regulatory Th17 cells, sustained functional Treg cells, and reduced proinflammatory responses in DCs. Immunoregulation by P. UF1 was mediated by bacterial dihydrolipoamide acyltransferase (DlaT), resulting in DlaT-specific Th17 cell differentiation that were tightly regulated by IL-10+ Treg cells. P. UF1 protected significantly newborn mice subjected to necrotizing enterocolitis (NEC)-like injury by sustaining the regulation of innate and T cell responses, particularly IL-10+ Treg cells, against pathogenic inflammation.Citation1
Listeria monocytogenes (L. m) is a Gram-positive intracellular bacterium that can be transmitted via contaminated food potentially resulting in sepsis and even death. Additionally, this foodborne pathogen also causes systemic diseases, particularly in pregnant women potentially leading to preterm labor, stillbirth, and severe neonatal inflammatory diseases Citation2. Furthermore, L. m outbreaks recently have been particularly deadly; thus, gaining insights from the protective immune mechanisms implicated in the clearance of this pathogen requires further investigation, which may result in developing new therapies against this pathogen.Citation3,Citation4
Here, in an attempt to demonstrate whether P. UF1 also regulates systemic immune responses induced by L. m infection, we further elucidated the capability of P. UF1 to control systemic induced T cell responses, particularly regulated Th17 cells, against this pathogen.
Results
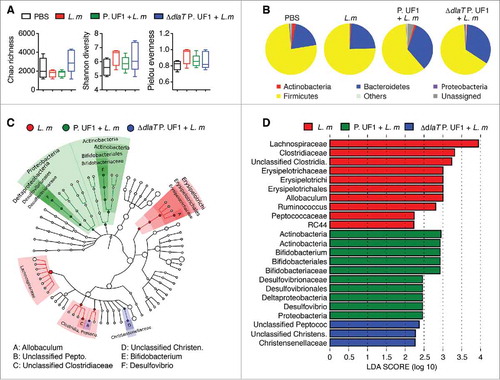
To clarify the regulatory effects of P. UF1 on protective bacterial DlaT-dependent Th17 cells along with Th1 cell responses against systemic L. m infection, mice were orally gavaged with P. UF1, ΔdlaT P. UF1, or PBS, and subsequently, infected with the murinized L. m strain 10403S containing targeted mutations in the major internalization protein, Internalin A (InlA)(S192N,Y363S), permitting optimal murine infection kinetics.Citation5 Indeed, mice gavaged with P. UF1 and then orally infected with L. m, when compared to mice gavaged with ΔdlaT P. UF1, or PBS and thereafter infected with L. m, exhibited reduced IL-1β, IL-6, and IL-12/IL23p40 by DCs ( and Supplemental Figure 1A), resulting in decreased IFNγ+ Th1 cells, as well as increased induction of Th17 cells ( and Supplemental Figure 1B). Importantly, IL-10+ Treg cells contracting upon L. m infectionCitation6 were not only functionally maintained, but their numbers were also markedly increased in mice gavaged with P. UF1 and orally infected with L. m, potentially contributing to protective T cell regulation (e.g., Th1 and Th17 cells) to attenuate inflammatory signals () Interestingly, the composition of the gut microbiota of mice gavaged with P. UF1 and infected with L. m compared to the other groups demonstrated enrichment of bifidogenic bacteria (), potentially influencing immune homeostasis during L. m infection.Citation7
Figure 1. Mitigation of proinflammation by P. UF1 during L. m infection. C57BL/6 mice were gavaged with P. UF1 (green) or with ΔdlaT P. UF1 (blue) (109 CFU/mouse) four times (4x) on days -7, -4, -1 and 2. Mice were orally infected on day 0 with L. m (109 CFU). Splenic immune responses were analyzed on day 7. (A) Representative data of flow plots, percentage (%), and total cell counts of IL-1β+, IL-6+ and IL-12/23p40+ DCs. (B) Representative data of flow plots, percentage (%), and total cell counts of colonic Th17 cells, Th1 cells, Treg and IL-10+ TGF-β+ FoxP3+ Tregs. A: Representative of three independent experiments (n = 5 mice/group). B: Combined data of two independent experiments (n = 4–9 mice/group). The p value was determined by ANOVA plus Tukey's post-test or Kruskal-Wallis plus Dunn's post-test. Data are represented as mean ± S.E.M; *p < 0.05, **p < 0.01, ***p < 0.01.
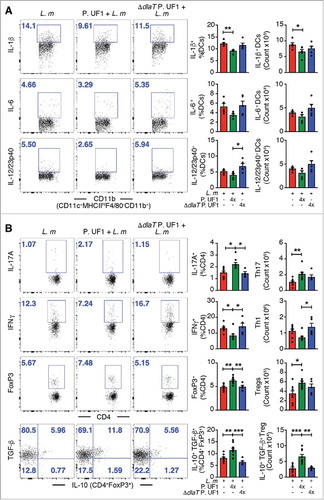
Figure 2. Analyses of microbiota during L. m infection in C57BL/6 mice. C57BL/6 mice were gavaged with PBS (red), P. UF1 (green), or with ΔdlaT P. UF1 (blue) (109 CFU/mouse) four times (4x) on days -7, -4, -1 and 2. Mice were orally infected on day 0 with L. m (109 CFU). One group of mice was left uninfected (PBS, black). Feces were collected on day 7 and microbiota analyzed. (A) Summary box-plots of Chao Richness, Shannon diversity, and Pielou evenness indices derived from results of 16S microbiota analyses. L. m (red); P. UF1 + L. m (green); ΔdlaT P. UF1 + L. m (blue); and PBS (black). (B) Mean total microbiota phyla composition of L. m, P. UF1 + L. m, ΔdlaT P. UF1 + L. m, and PBS. (C) Taxonomic cladogram demonstrating taxonomic differences among mouse groups as indicated. (D) Effect size of the most differentially abundant taxons shown in graph C. A-D: Combined data from two independent experiments (A-D, n = 7–8 mice/group)
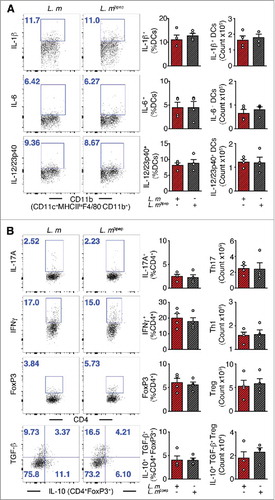
To further elucidate the regulatory effects of P. UF1 on protective DlaT-dependent Th17 cell responses against L. m infection, the three DlaT specific peptides of P. UF1 were stably integrated into the L. m chromosome using the insertional expression vector, pIMK2, resulting in L. m3pep (Supplemental Figure 2). Importantly, when compared to L. m infected mice, oral infection of C57BL/6 mice with L. m3pep, resulted in dampened L. m-induced inflammation via reduction of proinflammatory cytokine levels (e.g., IL-1β) (), and decreased Th1 cell responses and generation of Th17 cells and IL-10+ Treg cells (), as seen in mice that were gavaged with P. UF1 and subsequently infected with L. m. Furthermore, P. UF1-induced regulated immunity resulted in the clearance of L. m, as evidenced by CFU counts in the fecal samples and tissues (e.g., liver) of C57BL/6 mice gavaged with P. UF1 when compared with other groups of mice infected L. m ( and )
Figure 3. Mitigation of proinflammation by P. UF1 during L. m expressing 3 DlaT peptides (L. m3pep) infection. C57BL/6 mice were orally infected with 109 CFU of L. m (red) or with L. m3pep (grey). Seven days post-infection, splenic immune responses were analyzed. (A) Representative data of flow plots, percentage (%), and total cell counts of IL-1β+, IL-6+ and IL-12/23p40+ DCs. (B) Representative data of flow plots, percentage (%), and total cell counts of colonic Th17 cells, Th1 cells, Treg cells and IL-10+ TGF-β+ FoxP3+ Tregs. A and B: Representative data from two independent experiments (n = 4 mice/group). The p value in A and B was determined by a two-tailed unpaired t-test. Data are represented as mean ± S.E.M; *p < 0.05, **p < 0.01.
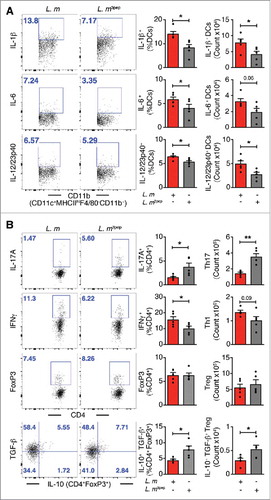
Figure 4. Clearance of L. m in the gut and liver of mice treated with P. UF1. C57BL/6 (open bar) or Signr1−/− (dashed bars) were gavaged with PBS (red), P. UF1 (green), or with ΔdlaT P. UF1 (blue) (109 CFU/mouse) four times (4x) on days -7, -4, -1 and 2. Mice were orally infected on day 0 with L. m (109 CFU). One group of mice were infected on day 0 with 109 CF L. m3pep (grey). (A and C) CFU of L. m recovered from the fecal samples collected 5 days after infection in C57BL/6 mice (A) or Signr1−/− (C) mice. (B and D) CFU of L. m recovered from the liver collected 7 days after infection in C57BL/6 mice (B) or Signr1−/− (D) mice. Representative data from two independent experiments (n = 4 mice/group in B and D or n = 5 mice/group in A and C). The p value was determined by ANOVA plus Tukey's post-test. Data are represented as mean ± S.E.M; * p < 0.05, ** p < 0.01, *** p < 0.01.
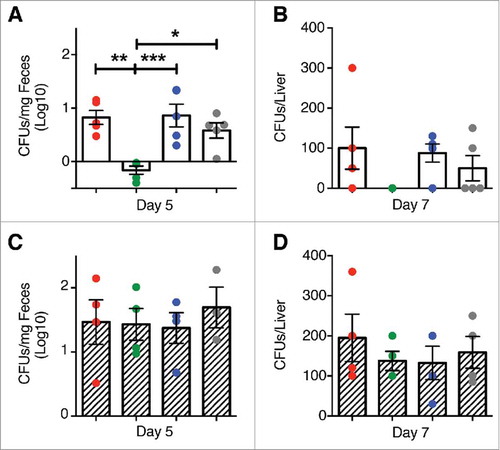
As demonstrated previously, colonic immune regulation required SIGNR1 signaling.Citation1 Here, we also speculated about the role of SIGNR1 in regulating peripheral immunity against systemic L. m infection. Thus, to assess SIGNR1 limiting pathogen-induced inflammation in the periphery, Signr1−/− mice were gavaged with P. UF1, ΔdlaT P. UF1, or PBS, and then orally infected with L. m. Data demonstrate the involvement of SIGNR1 in controlling L. m-induced pathogenic inflammation observed in C57BL/6 mice gavaged with P. UF1, which was not seen in Signr1−/− mice gavaged with P. UF1, and orally infected with L. m ( and ), illustrating the implication of regulatory SIGNR1 during L. m infection. Furthermore, controlled immune protection induced by P. UF1 in C57BL/6 mice was not observed in P. UF1 treated Signr1−/- mice infected with L. m, or L. m3pep ( and ), as reduction of L. m burden was not seen in these groups of Signr1−/− mice infected with L. m ( and ) suggesting strongly that SIGNR1 plays a critical role in controlling innate and T cell responses against systemic L. m infection.
Figure 5. Mitigation of proinflammation by P. UF1 during L. m infection. Signr1−/- mice were gavaged with P. UF1 (green), or with ΔdlaT P. UF1 (blue) (109 CFU/mouse) four times (4x) on days -7, -4, -1 and 2. Mice were orally infected on day 0 with L. m (109 CFU). Splenic immune responses were analyzed on day 7. (A) Representative data of flow plots, percentage (%), and total cell counts of IL-1β+, IL-6+ and IL-12/23p40+ DCs. (B) Representative data of flow plots, percentage (%), and total cell counts of colonic Th17 cells, Th1 cells, Treg and IL-10+ TGF-β+ FoxP3+ Tregs. A and B: Representative of two independent experiments. The p value was determined by ANOVA plus Tukey's post-test. Data are represented as mean ± S.E.M.
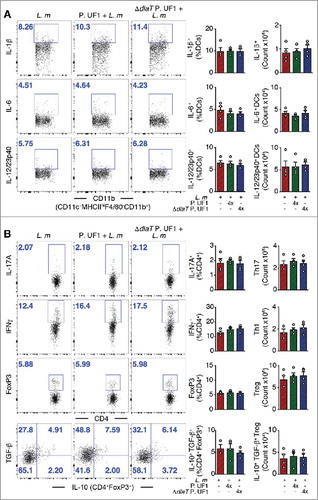
Figure 6. Mitigation of proinflammation by P. UF1 during L. m expressing 3 DlaT peptides (L. m3pep) infection. Signr1−/- mice were orally infected with 109 CFU of L. m (red) or with L. m3pep (grey). Seven days post-infection, splenic immune responses were analyzed. (A) Representative data of flow plots, percentage (%), and total cell counts of IL-1β+, IL-6+ and IL-12/23p40+ DCs. (B) Representative data of flow plots, percentage (%), and total cell counts of colonic Th17 cells, Th1 cells, Treg cells and IL-10+ TGF-β+ FoxP3+ Tregs. A and B: Representative data from two independent experiments (n = 4 mice/group). The p value in A and B was determined by a two-tailed unpaired t-test. Data are represented as mean ± S.E.M.
In summary, our data expand on our previous observation Citation1 and clearly demonstrate that P. UF1 and its three peptides deduced from bacterial DlaT and expressed by L. m also induce the differentiation of splenic DlaT-specific Th17 cells upon infection of C57BL/6 mice with L. m. More importantly, here also P. UF1 significantly controlled protective IFNγ+ Th1 cell responses against systemic L. m infection. Moreover, P. UF1 also sustained functionally splenic IL-10+ Treg cells in L. m induced inflammatory condition. Further studies are warranted to demonstrate the synergic protective Th1 and Th17 cells, which may be regulated by functional IL-10+ Treg cells against intracellular pathogens, including L. m. Nonetheless, our data also demonstrate that P. UF1 not only attenuates locally,Citation1 but also peripherally the pathogen-induced inflammation that otherwise may result in tissue damage and further exacerbation of proinflammatory diseases, including NEC. Thus, candidates for modulation of the mucosal and peripheral immune responses would be beneficial bacteria such as P. UF1 with bifidogenic properties. Future strategies restoring locally and peripherally the balance of regulatory lymphocytes may provide novel approaches to prevent a broad range of proinflammatory diseases, including NEC.
Methods
Animals
C57BL/6 mice were obtained from Jackson Laboratory. Signr1−/−mice were kindly provided by Dr. Huang Shau-Ku (Johns Hopkins University School of Medicine, Baltimore, MD). Mice (6–8 weeks) were maintained under specific pathogen-free, Helicobacter-free conditions, in accordance with the Animal Welfare Act and the Public Health Policy on Humane Care. Procedures were approved by UF's Institutional Animal Care and Use Committee (IACUC), protocol numbers: 201609388 and 201708484.
Gavaging mice with P. UF1 strains
Mice were gavaged with P. UF1, and ΔdlaT P. UF1 strains four times (4x, 109 CFU/100 µL PBS) every 3 days, as previously described.Citation1
Bacterial strains and their products
The transformations of the P. UF1 were performed, as described previously.Citation8 The Listeria monocytogenes 10403S (L. m) harbors two amino acid substitutions in the bacterial invasion protein, Internalin A (InlAm- S192N, Y363S), thereby rendering the bacterium more efficient at invading murine gut epithelial cells.Citation5,Citation9,Citation10 L. m was grown in Brain Heart Infusion (BHI) medium (Difco Laboratories, 299070) at 37°C. Antibiotics were added at the following final concentrations: 5 μg/mL chloramphenicol and 1 mg/mL hygromycin B (Corning, 30–240CR) for P. UF1 strains; 200 µg/mL streptomycin (Fisher, BP910-5) for L. m.
Generation of L. m secreting the three DlaT-derived peptides
The nucleotide sequence corresponding to the three DlaT peptides was synthesized and amplified with primers, 3Pep-F2 (CAACAAACTGAAGCAAAGGATGTTGGTAGTAGTGTCCCA)/3Pep-R2 (ATATGTCGAC CTATGCAGCAACTGGTGCA). The L. m secretion signal sequence of the hly gene (encodes Listeriolysin O) was amplified with primers, HlySS-F/HlySS-R. The resulting two amplicons were used as templates in a splicing by an overlap extension PCR reaction to generate a DNA fragment containing the secretion signal sequence of the hly gene directly upstream of the 3pep sequence. This fragment was then cloned into the L. m integration vector, pIMK2, which drives gene expression under the control of the highly active PHELP promoter, generating plasmid, pIMK2-3pep.Citation11 This plasmid was then electroporated into L. m. To confirm that L. m strains 10403S InlAm harboring a stably integrated pIMK2-3pep, was capable of expressing and secreting the recombinant DlaT peptides, an additional pIMK2-3pep construct containing a 6x-Histidine tag at the C-terminus (plasmid pIMK2-3pep-6xHis) was generated for immunodetection. The supernatants of the bacterial cultures were collected, precipitated with 10% trichloroacetic acid, washed with 1 mL of 100% ethanol, and dissolved in SDS sample buffer. The protein samples were run on an 18% SDS-PAGE gel, transferred to a PVDF membrane, and detected by Western blot using an anti-6xHis mouse monoclonal antibody (Abcam, ab18184), Supplemental Figure 2.
Bacterial infections
Mice were gavaged with either P. UF1, or ΔdlaT P. UF1 on days -7, -4, -1, and 2 for L. m relative to the infection. Briefly, mice were denied food, but given unrestricted access to water 8 hr prior to infection. The L. m inoculum was suspended in 100 µL PBS with CaCO3 (50 mg/ml, Acros Organics, 403815000). Mice were orally infected with L. m (109 CFU/mouse) on day 0. Food was returned 1 hr post infection. Mice were then monitored daily and sacrificed on day 7. Fecal pellets (>4 per mice) were collected on days 2, 5, and 7 after the infection. The pellets were mashed, and then vortexed for 30 seconds before diluting and plating on BHI/L+G agar [(Difco Laboratories, 211065), 50 µg/mL streptomycin]. Colonies were counted after 24–36 hr growth at 37°C. Livers were also collected on day 7, weighed, and homogenized in sterile PBS. Subsequently, the supernatants were diluted and plated on BHI agar (50 µg/mL streptomycin). Colonies were counted after 24–36 hr of growth at 37°C.
Flow cytometry analysis
Splenic cells were stimulated with 50 ng/mL phorbol 12-myristate 13-acetate (PMA) and 2.5 µg/mL ionomycin in the presence of brefeldin A (Biolegend, 420601) for 4 hr at 37°C. Cell surface staining was carried out in PBS with 1% BSA (Sigma, A7906), 2mM EDTA (Fisher Bioreagents, BP2482), and 0.1% Sodium azide (Sigma, S8032). For live cell analyses, dead cells were excluded by staining with LIVE/DEAD® Fixable Blue Dead Cell Stain Kit (Molecular Probes, Thermo Fisher Scientific, L34962). Cells were incubated with Mouse Fc Blocking Reagent (Miltenyi Biotec, 130-059-901) prior to staining. Cells were first stained for cell-surface markers and then resuspended in fixation/permeabilization solution [Cytofix/Cytoperm kit, (BD Biosciences, 554714) or FOXP3 Fix/Perm buffer set, (Biolegend, 421403) for FoxP3 intracellular staining]. Intracellular staining was carried out in accordance with the manufacturer's instructions.Citation12 Antibodies for staining were purchased from BD Biosciences, Biolegend, eBioscience/Thermo Fisher. The following antibodies or their corresponding isotype controls were used (clone, cat. Number): CD45 (30-F11, 86-0451-42), CD11c (N418, 117338), CD11b (M1/70, 101212), F4/80 (BM8, 123112), GR1 (RB6-8C5, 108422), I-A/I-E MHCII (2G9, 558593), CD3 (145-2C11, 100330), CD4 (RM4-5, 100548), CD8 (53–6.7, 15-0081-83), Pro-IL-1β (NJTEN3, 25-7114-82)/ isotype Rat IgG1, κ (25-4301-82), IFNγ (XMG1.2, 505826)/ isotype Rat IgG1, κ (400416), IL-17A (TC11-18H10.1, 506904)/ isotype Rat IgG1, κ (400408), IL-10 (JES5-16E3, 505006)/ isotype Rat IgG2b, κ (400606), FoxP3 (FJK-16A, 48-5773-82)/ isotype Rat IgG2a, κ (48-4321-82), RORγt (AFKJS-9, 12-6988-80)/ isotype Rat IgG2a, κ (12-4321-82), TGF-β (TW7-16B4, 141406)/ isotype Rat IgG1 (400120), κ, IL-12/IL-23(p40) (C15.6, 561456)/ isotype Rat IgG1, κ (560536), IL-6 (MP5-20F3, 11-7061-80)/ isotype Rat IgG1, κ (11-4301-85), SIGNR1 (CD209b) (22D1, 17-2093-82)/ isotype Hamster IgG (17-4888-81). Data were collected by a LSR Fortessa (BD Biosciences) and analyzed with FlowJo software 10.2 (TreeStar). Gating strategies used to analyze DCs and T cells are detailed in the Supplemental Figure 1.
Microbiota analyses of mouse fecal samples
Microbiota analyses were performed on the Illumina MiSeq (Illumina, Inc.), as outlined previously Citation13,Citation14 using primers, as previously described Citation15 Sequence analyses were performed using QIIME v.1.9.0.Citation16 Briefly, after checking quality of sequenced reads, 8nt barcodes were extracted from both forward and reverse reads to generate a barcode library. Forward and reverse reads were then joined. Sequence libraries were filtered, as previously described,Citation16 and split based on their corresponding barcodes. We used an open reference operational taxonomic unit (OTU) picking strategy to select OTU (with 97% identity threshold).Citation17 Taxonomy was assigned based on the Greengenes reference database.Citation18 After single alpha rarefaction based on rarefaction curve, alpha diversity (e.g., Chao diversity, Shannon diversity, Evenness index) was measured. Subsequently, a taxonomic table for each taxonomic level was generated based on the OTU table. The phylum level taxonomic table was the basis for the phylum pie chart depiction. Differentially significant features at each level were identified using linear discriminant analysis (LDA) along with effect size measurements (LEfSe).Citation19 The significant taxa were filtered by LDA Effect Size (LEfSe) analyses with default criteria (p< 0.05 by Kruskal-Wallis test; LDA score > 2). The LEfSe data were further used for cladogram depiction using Graphlan.Citation20
Statistical analyses
Statistical analyses were performed using GraphPad Prism (Version 7.0 for Mac OS X). Mean and S.E.M. values and statistical significance between two variables were determined by two-tailed unpaired t-tests. Normality was tested using the Shapiro-Wilk normality test. Where the groups follow a Gaussian distribution, parametric analyses were performed (1-way ANOVA followed by Tukey's post-test for 3 or more variables). Where the groups did not follow a Gaussian distribution, nonparametric analyses were performed (Kruskal-Wallis test followed by Dunn's post-test for 3 or more variables). Differences were considered to be significant at *P < 0.05, **P < 0.01, ***P < 0.001, ****P < 0.0001.
Disclosure of potential conflicts of interest
No potential conflicts of interest were disclosed.
Authors' contribution
MM directed and designed the cellular and molecular experiments, which were executed by NC, YG, MG, MZ, JL, and FA; NC, and MZ performed the mouse work; YG, MG, JL, and FA performed the molecular studies, and generation of L. m3pep; YG and MG analyzed microbiota studies, and MG conducted all bioinformatic work for microbiota data analyses. NC, YG, MG, MZ, JL, FA, and MM analyzed and interpreted the data; MM wrote the manuscript.
supplementary_material.docx
Download MS Word (3.7 MB)Additional information
Funding
References
- Colliou N, Ge Y, Sahay B, Gong M, Zadeh M, Owen JL, Neu J, Farmerie WG, Alonzo F, 3rd, Liu K, et al. Commensal Propionibacterium strain UF1 mitigates intestinal inflammation via Th17 cell regulation. J Clin Invest. 2017.
- Rizzuto G, Tagliani E, Manandhar P, Erlebacher A, Bakardjiev AI. Limited Colonization Undermined by Inadequate Early Immune Responses Defines the Dynamics of Decidual Listeriosis. Infect Immun. 2017; 85(8).
- Romagnoli PA, Fu HH, Qiu Z, Khairallah C, Pham QM, Puddington L, Khanna KM, Lefrancois L, Sheridan BS. Differentiation of distinct long-lived memory CD4 T cells in intestinal tissues after oral Listeria monocytogenes infection. Mucosal Immunol. 2017; 10(2):520-30.
- Romagnoli PA, Sheridan BS, Pham QM, Lefrancois L, Khanna KM. IL-17A-producing resident memory gammadelta T cells orchestrate the innate immune response to secondary oral Listeria monocytogenes infection. Proc Natl Acad Sci U S A. 2016; 113(30):8502-7.
- Wollert T, Pasche B, Rochon M, Deppenmeier S, van den Heuvel J, Gruber AD, Heinz DW, Lengeling A, Schubert WD. Extending the host range of Listeria monocytogenes by rational protein design. Cell. 2007; 129(5):891-902.
- Benson A, Murray S, Divakar P, Burnaevskiy N, Pifer R, Forman J, Yarovinsky F. Microbial infection-induced expansion of effector T cells overcomes the suppressive effects of regulatory T cells via an IL-2 deprivation mechanism. J Immunol. 2012; 188(2):800-10.
- Lievin V, Peiffer I, Hudault S, Rochat F, Brassart D, Neeser JR, Servin AL. Bifidobacterium strains from resident infant human gastrointestinal microflora exert antimicrobial activity. Gut. 2000; 47(5):646-52.
- Brede DA, Faye T, Stierli MP, Dasen G, Theiler A, Nes IF, Meile L, Holo H. Heterologous production of antimicrobial peptides in Propionibacterium freudenreichii. Applied and environmental microbiology. 2005; 71(12):8077-84.
- Park SF, Stewart GS. High-efficiency transformation of Listeria monocytogenes by electroporation of penicillin-treated cells. Gene. 1990; 94(1):129-32.
- Xayarath B, Marquis H, Port GC, Freitag NE. Listeria monocytogenes CtaP is a multifunctional cysteine transport-associated protein required for bacterial pathogenesis. Molecular microbiology. 2009; 74(4):956-73.
- Monk IR, Gahan CG, Hill C. Tools for functional postgenomic analysis of listeria monocytogenes. Applied and environmental microbiology. 2008; 74(13):3921-34.
- Lightfoot YL, Selle K, Yang T, Goh YJ, Sahay B, Zadeh M, Owen JL, Colliou N, Li E, Johannssen T, et al. SIGNR3-dependent immune regulation by Lactobacillus acidophilus surface layer protein A in colitis. Embo J. 2015.
- Lightfoot YL, Selle K, Yang T, Goh YJ, Sahay B, Zadeh M, Owen JL, Colliou N, Li E, Johannssen T, et al. SIGNR3-dependent immune regulation by Lactobacillus acidophilus surface layer protein A in colitis. Embo J. 2015; 34(7):881-95.
- Yang T, Santisteban MM, Rodriguez V, Li E, Ahmari N, Carvajal JM, Zadeh M, Gong M, Qi Y, Zubcevic J, et al. Gut dysbiosis is linked to hypertension. Hypertension. 2015; 65(6):1331-40.
- Lightfoot YL, Yang T, Sahay B, Zadeh M, Cheng SX, Wang GP, Owen JL, Mohamadzadeh M. Colonic immune suppression, barrier dysfunction, and dysbiosis by gastrointestinal bacillus anthracis Infection. PloS one. 2014; 9(6):e100532.
- Bokulich NA, Subramanian S, Faith JJ, Gevers D, Gordon JI, Knight R, Mills DA, Caporaso JG. Quality-filtering vastly improves diversity estimates from Illumina amplicon sequencing. Nature methods. 2013; 10(1):57-9.
- Rideout JR, He Y, Navas-Molina JA, Walters WA, Ursell LK, Gibbons SM, Chase J, McDonald D, Gonzalez A, Robbins-Pianka A, et al. Subsampled open-reference clustering creates consistent, comprehensive OTU definitions and scales to billions of sequences. PeerJ. 2014; 2(e545).
- McDonald D, Price MN, Goodrich J, Nawrocki EP, DeSantis TZ, Probst A, Andersen GL, Knight R, Hugenholtz P. An improved Greengenes taxonomy with explicit ranks for ecological and evolutionary analyses of bacteria and archaea. The ISME journal. 2012; 6(3):610-8.
- Segata N, Izard J, Waldron L, Gevers D, Miropolsky L, Garrett WS, Huttenhower C. Metagenomic biomarker discovery and explanation. Genome biology. 2011; 12(6):R60.
- Asnicar F, Weingart G, Tickle TL, Huttenhower C, Segata N. Compact graphical representation of phylogenetic data and metadata with GraPhlAn. PeerJ. 2015; 3(e1029).