
ABSTRACT
Enteroaggregative E. coli (EAEC) is associated with food-borne outbreaks of diarrhea and growth faltering among children in developing countries. A Shiga toxin-producing EAEC strain of serotype O104:H4 strain caused one of the largest outbreaks of a food-borne infection in Europe in 2011. The outbreak was traced to contaminated fenugreek sprouts, yet the mechanisms whereby such persistent contamination of sprouts could have occurred are not clear. We found that under ambient conditions of temperature and in minimal media, pathogenic Shiga toxin-producing EAEC O104:H4 227-11 and non-Shiga toxin-producing 042 strains both produce high levels of exopolysaccharide structures (EPS) that are released to the external milieu. The exopolysaccharide was identified as colanic acid (CA). Unexpectedly, Shiga-toxin producing EAEC strain 227-11 produced 3-6-fold higher levels of CA than the 042 strain, suggesting differential regulation of the CA in the two strains. The presence of CA was accompanied by the formation of large biofilm structures on the surface of sprouts. The wcaF-wza chromosomal locus was required for the synthesis of CA in EAEC 042. Deletion in the glycosyltransferase wcaE gene abolished the production of CA in 042, and resulted in diminished adherence to sprouts when co-cultured at ambient temperature. In conclusion, this work suggests that copious production of CA may contribute to persistence of EAEC in the environment and suggests a potential explanation for the large Shiga toxin-producing EAEC outbreak in 2011.
Introduction
Enteroaggregative Escherichia coli (EAEC) is a cause of diarrhea in infants in developing and industrialized nations, traveler's diarrhea, and food/water-borne outbreaks.Citation1,Citation2 In 2011, a Shiga-toxin producing EAEC strain of serotype O104:H4 caused 3,816 cases, 845 HUS cases and 54 deaths in Europe.Citation3,Citation4 The World Health Organization (WHO) estimated that farmers and other industries lost 1.3 billion in revenue, costing governments $236 million in emergency aid during the outbreak (http://www.who.int/mediacentre/news/releases/2015/food-safety/en/). Contaminated fenugreek sprouts were implicated as the source of infection.Citation5-8
Virulence factors associated with EAEC strains include the AraC family regulator AggRCitation9 and its regulon,Citation10-13 serine protease autotransporters (Pic, SepA and SigA)Citation14-17 and, potentially extracellular polysaccharides.Citation18-22 E. coli extracellular polysaccharides are mainly found in the bacterial capsule (K antigens),Citation23-25 released as slime into the medium (exopolysaccharide [EPS]),Citation26,Citation27 or attached to the lipopolysaccharide (O antigen)Citation28-31 of E. coli strains. Four loci have been implicated in EAEC 042 polysaccharide synthesis32: wzzB-wza (Ec042_2270 – Ec042_2299), kpsF-kpsM (Ec042_3230 – Ec042_3240), and two copies of the shf locus, which encodes a homolog of IcaB protein of Staphylococcus epidermidis and it is implicated in adhesion and LPS modification (Ec042_4769 – Ec042_4772 and Ec042_pAA021 – Ec042_pAA023).
The wzzB-wza region is required for synthesis of the O44 serogroup O-antigen of lipopolysaccharide and of colanic acid (CA) in 042. CA, also known as antigen M, is an EPS encoded by the wca gene cluster.Citation33,Citation34 It has been implicated in adhesion,Citation35 resistance to pH and antibiotics,Citation36,Citation37 and formation of mature biofilms structures.Citation38,Citation39 The role of CA in the pathogenesis of diarrheagenic E. coli, if any, is unknown. The kpsF-kpsM region encodes the capsular K extracellular acidic polysaccharide.Citation31
The prototype EAEC strain 042 which caused diarrhea in volunteersCitation40 and the German outbreak strain 227-11 were used in this study to evaluate the biological relevance of polysaccharide structures in the formation and maturation of biofilms structures in contaminated sprouts.
Results
Characterization of wzzB-wza and kpsF-kpsM regions in 042 and 227-11 strains
The genomic region wzzB-wza is reported to be responsible for CA production (, and ). The region is formed by 30 to 34 genes in EAEC 042 and 227-11 respectively (042, GenBank; FN554766, 227-11, GenBank, AFRH01000006.1). Only 26 genes were conserved in both strains (Supplementary Table 1). Eight genes were found only in 227-11 (EUAG_03277, EUAG_03279, EUAG_03281, EUAG_03282, EUAG_03283, EUAG_03284, EUAG_03285, and EUAG_03287). The commensal E. coli strain HS (GenBank, NC_009800.1) was found to lack most of the genes in this region, with only 5 genes identified (ugd, gnd, galF, manC, and wzb) (). Wzx, Wzy, Wza, and Wzc are required for polysaccharide export to the external milieu; the gene encoding the enzyme required for chain length determination (WzzB) was also identified in this region ().
Figure 1. Genomic organization of the polysaccharide structures in EAEC strains. The genomic organization for colanic acid encoding region was analyzed for 227-11 (Panel A), E. coli HS (Panel B), and 042 (Panel C) strains. Conserved gnd, galF and wzb genes are indicated in black and gray arrows. The encoding region of capsule-K in 042 is illustrated in panel D. EAEC strains 042, 227-11, and 042aggR were inoculated in LB (Panel E) and DMEM-high glucose plates (Panel F). Colanic acid secretion production was examined after 48 h of incubation at room temperature (Panels E and F). E. coli HS is incapable of producing CA and used as negative control of the system.
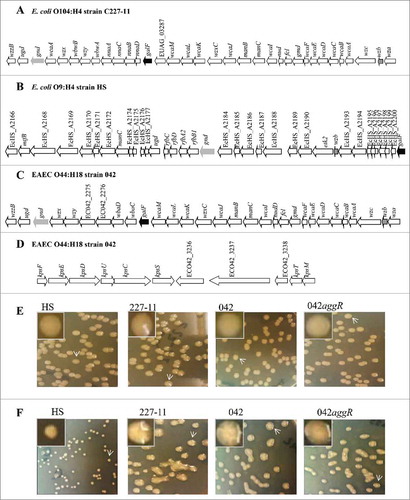
Genomic analysis also revealed the presence of a group 2 capsule gene cluster in EAEC 042 (Supplementary Table 2). The region is formed by 8 conserved genes (kpsF, E, D, U, C, S, T and M) and a central variable region formed by 3 putative proteins required for capsule synthesis (ECO42_3236, ECO42_3237 and ECO42_3238) (). Genes kpsF, E, D, U, C, S, T and M were highly conserved with a similarity of 96 – 99% to the KpsF, E, D, U, C, S, T and M predicted proteins, reported to be involved in the synthesis of group 2 capsule genes. Ec042_3239 encoded a protein that was 96% identical to KpsT, while the protein encoded by Ec042-3240 was 99% identical to KpsM, indicating the presence of an inner-membrane ABC capsular polysaccharide exporter.Citation31,Citation32 No capsule has been described for EAEC 042, yet this locus is apparently intact and is thus worthy of further exploration.
Glycosyl composition of Exopolysaccharide by GC-MS
At room temperature, the pathogenic E. coli strains produced a mucoid phenotype when they were grown in DMEM agar plates, but not on LB plates ( and ). Although, AggR regulates shf,Citation10 a polysaccharide deacetylase actively expressed in DMEM high glucose, it did not participate in the production of this mucoid phenotype in 042 (, ).
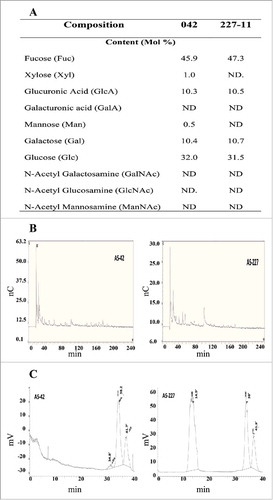
EPS was extracted from the mucoid colonies and subjected to analysis by combined gas chromatography/mass spectrometry (GC/MS). Glycosyl analysis indicated that EAEC 042 and 227-11 samples were similar in composition, with Fucose 45 – 47 mol %, Glucose 31 – 37 mol % and Glucuronic Acid and Galactose each ∼10 mol %. Trace amounts of Mannose and Xylose were detected only in strain 042 samples (). Size-exclusion chromatography (SEC) profile () indicated that samples from strain 227-11 contain polymers in the >30KDa fraction than are not present in 042. Samples from both 042 and 227-11 strains contained lower MW fractions eluting at ∼38 minute which are comparable to the elution time of the Glucose standard (36.3min). HPAEC profile on CarboPac PA200 columns indicated that there may not be neutral oligomers that are comparable to standard malto- and xylo-oligomers (). These data suggest that the dominant polysaccharide species in both strains comprised CA.
Figure 2. Glycosyl composition of CA in EAEC strains. EPS was isolated from EAEC 042 and 227-11 strains and glycosyl composition analysis was performed by combined gas chromatography/mass spectrometry (Panel A). HPAEC profile on CarboPac PA200 columns indicated that there may not be neutral oligomers that are comparable to standard malto- and xylo-oligomers (Panel B). The samples were also analyzed by size-exclusion chromatography (SEC) profile (Panel C).
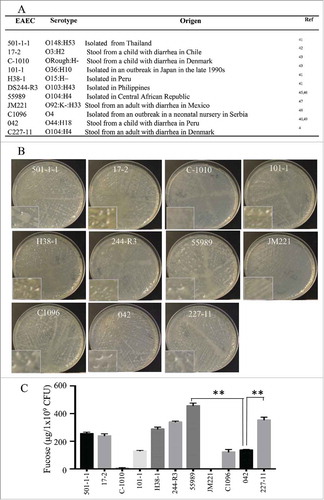
We sought to determine if the production of CA was conserved among different EAEC strains. CA was isolated from a collection of EAEC strains (501-1-1Citation41, 17–2Citation42, C1010Citation43, 101–1Citation44, H38-1Citation41, DS244-R3Citation41, 55989Citation45,Citation46, JM221Citation47, C1096Citation48, 042Citation40,Citation49, C227-114) with various serotypes (). We observed that EAEC strains exhibit different expression levels of CA. Strains belonging to O104:H4 serotype (227-11 and 55989) were the best CA producers (, ), followed by strains 501-1-1, 17-2, H38-1, and 244-R3, while 101-1, C1096 and 042 strains showed the lowest levels of CA production. C-1010 and JM221 displayed a reduced growth rate in DMEM plates and were negative for CA production (, ).
Figure 3. CA production in pathogenic EAEC strains. Eleven EAEC strains were tested for colanic acid production. Serotype and origen of strains are indicated in panel A. CA levels produced by EAEC strains were examined on DMEM-plates (Panel B) and quantified by determining fucose contents (Panel C). Asterisks indicate significant differences by ANOVA (**, P < 0.001).
Production of CA was not an exclusively characteristic of EAEC, strains categorized into Enterohemorrhagic E. coli (EHEC), Enteropathogenic E. coli (EPEC) and Enteroinvasive E. coli (EIEC) pathotypes were also able to produce CA on DMEM plates. Qualitative analysis of CA production showed variable abundance of CA among the strains (Supplementary ). Levels of quantified CA were compared between EHEC (85-998 and 930) and the EAEC 227-11 strain, showing no drastic differences in CA production between these strains (∼300-400 µg/1 × 109 CFU) (Supplementary ).
Regulation of the EPS
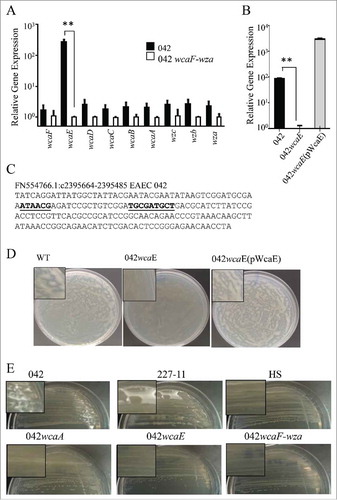
CA is encoded by a large operon (∼30 genes) including the wcaF-wza region. CA expression is tightly regulated. We sought to identify the transcriptional activity of the wcaF-wza region by qRT-PCR (). Although all genes in the region were expressed in DMEM high glucose plates, wcaE was highly expressed in these conditions (>200 fold) (). Single deletions in wcaE abolished CA production in 042 ( and ). The 042wcaE was successfully complemented by expressing wcaE under the native Pwca promoter (, and ).
Figure 4. Evaluation of wcaF-wza expression in DMEM plates. 042 derivatives, 227-11, and HS strains were growth at 25°C for 48 h. Transcriptional levels of genes in the wcaE and wcaF-wza region were determined by qRT-PCR (Panel A). Deletion of wcaE gene abolish the expression of CA (Panels B, D and E). PwcaE promoter was used to complement in trans wcaE deletion in 042wcaE strain (Panel C). −35 and −10 regions of the Pwca promoter were predicted by using Bprom algorithm (underlined). Asterisks indicate significant differences by ANOVA (**, P < 0.001).
To ascertain whether the wcaE is also required for synthesis of the O44 serotype O-antigen of the lipopolysaccharide, bacterial samples were tested by agglutination with anti-O44 antibodies. In addition, silver-stained LPS samples from 042 derivatives were analyzed in a SDS-PAGE, revealing no differences (Data not shown).
WcaE is not the only glycosyltransferase in the WzzB-Wza region, the region includes 7 putative glycosyltransferase-encoding genes (wbaD, wbaC, wcaL, wcaI, wcaE, wcaC and wcaA), five of them are annotated in the 042 genome as part of the CA operon (wcaL, wcaI, wcaE, wcaC and wcaA).Citation32 We observed that deletion in either wcaA or wcaE affected the production of CA in 042 (, and ).
We sought to determine whether CA production is influenced by host-related factors such as bile and temperature. We observed that the presence of 0.3% bile down-regulated the expression of CA (∼1000 fold) (, and ). CA was up-regulated at room temperature (25°C) but not at 37°C in DMEM plates (, and ). Under these experimental conditions, strain 227-1 produced consistently 3-6-fold more abundant CA than 042 ( and ). CA expression was not affected by the deletion of the kpsF-kpsM region (). As predicted, strain HS is incapable of synthesizing CA ().
Figure 5. Regulation of colanic acid by bile. Transcriptional expression of the wcaE in bacterial strains grown with or without bile for 48 h was determined by qRT-PCR (Panel A). Fucose content in the 042 derivatives was determined as described in material and methods (Panel B). Production of CA by 042 derivatives on DMEM plates are shown in Panel C. Asterisks indicate significant differences by ANOVA (**, P < 0.001).
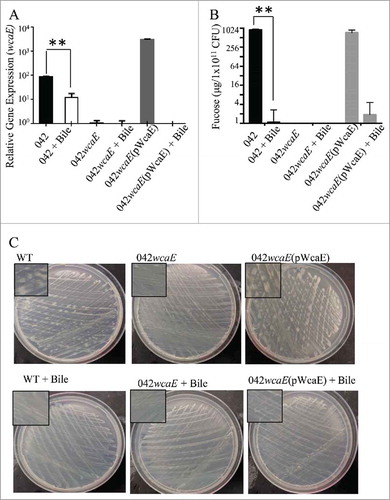
Figure 6. Examination of exopolysaccharide production by EAEC derivatives. Production of CA (Panel A-C) was quantified at room temperature (25°C) and 37°C. CA was visualized by TEM (Panel D-W) in strains grown at 25°C (Panel D-O) or 37°C (Panel P-W). For TEM analysis, EAEC derivatives were harvested, fixed and stained overnight with 0.075% ruthenium red. Samples were visualized at magnifications of 10,000X (panels G, I, N and O), 12,000X (panel L), 15,000X (panel E), 25,000X (Panels F, H, J, M, P, R and S), 30,000X (panels D, K and T) and 40,000X (Panels Q, S, U and W). Deletion of wcaE and the wcaF-wza region abolished the production of CA in 042 (Panel A, C, J, K and L), CA was restored by complementation in trans of 042wcaE strain (Panel C and M).
Identification of EPS structures in EAEC strains
Ruthenium red staining followed by transmission electron microscope analysis was used to observe the presence of an external glycoprotein layer surrounding the EAEC strains. For EAEC, staining with ruthenium red was sufficiently intense that it was possible to visualize an EPS when the strains were grown at room temperature for 48 h (, , and ). Deletion of wcaF-wza region and wcaE abolished the secretion of the EPS to the external milieu (, and ). Deletions of EC042_pAA022 (orf022), an unrelated glycosyltransferase present on the virulence plasmid pAA, or kpsF-kpsM mutation did not affect the expression CA in 042 ( and ). E. coli HS is incapable of producing CA but expressed a pronounced polysaccharide-rich coat that stained with Ruthenium red ( and ).
The expression of CA was severely reduced at 37°C but not at room temperature in the 042 and 227-11 strains ( to ). Capsular structures rich in carbohydrates were observed firmly attached to the surface of the EAEC strains grown at 37°C ( to ). Deletion of kps-kpsM altered the capsular structure in 042 strain ( and ).
Bacterial biofilm formation in contaminated sprouts with EAEC strains
We sought to determine if CA in EAEC 042 and 227-11 participates in the formation and maturity of biofilm structures on sprouts (). Alfalfa and broccoli sprouts pre-sterilized with bleach were inoculated with 1 × 10⁴ CFU of the EAEC strains and incubated a room temperature for 48 h, then examined by scanning electron microscopy. Uninoculated sterile sprouts were maintained under the same experimental conditions and used as a negative control ( and ). We observed large biofilm structures on sprouts inoculated with wild type 042 and 227-11 strains (, , , , and ). Deletion in wcaE or wcaF-wza region appeared to have a reduced biofilm formation on the sprouts (, and ). Complementation of wcaE in trans restored biofilm formation to wild type levels (, and ). E. coli HS is incapable of producing CA and showed poor biofilm formation (). We observed the presence of fimbrial structures and CA in the biofilm structures on sprouts (white arrows). Deletion of the major pilin subunit of the AAF/II fimbriae of EAEC 042 appeared to reduce biofilm formation in sprouts ().
Figure 7. SEM of EAEC 042 derivatives. Alfalfa (Panels A to F) and broccoli (Panels D to L) sprouts sterilized with bleach were inoculated with 1 × 10⁴ CFU of the EAEC strains and incubated a room temperature for 48 h. Uninfected sprouts are showed in panes A and G. The samples were examined by scanning electron microscopy at the AML-UVA. Samples were visualized at magnifications of 1500X (C, F, G, and K), 2000X (A, B, D and E), 5000X (J and L), 10,000X (I and M), 25,000 (O) and 30,000X (H and N).
Discussion
Foodborne infections are common worldwide, yet the full cycle of bacterial physiology that contributes to optimal bacterial growth and persistence in the environment is poorly understood for most pathogens. Here, we report the genes responsible for the biosynthesis of the common E. coli capsule composed of CA in EAEC strains, and show that it is required for the formation of the complex three-dimensional structure of E. coli biofilms in contaminated sprouts at ambient temperature.
Deletion of genes in the CA operon affected biofilm formation and maturation. CA production was promoted by the minimal growth medium (DMEM) and ambient temperature, and was suppressed by the presence of bile. Expression of CA at room temperature suggests that CA plays a role in the environmental life cycle of the bacterium. Thus, CA may contribute to adherence and persistence of pathogenic bacteria on foods, thus promoting foodborne transmission. Exopolysaccharides have shown to benefit bacteria by multiple ways, for example by maintaining a hydrated microenvironment around biofilms, thus protecting bacteria of desiccation, as protective barrier to host defenses and as carbon source for utilization by the biofilm community.Citation50
Whether the optimal nutrient conditions we observed contribute to biofilm formation in the environment is unclear; bacteria recently shed in the feces may be nutritionally in a biofilm-competent state, enabling biofilm formation on vegetables with which they have prompt contact at ambient temperatures. With time, the biofilm may mature and protect bacteria that are no longer actively multiplying.
Interestingly, the Stx-EAEC German outbreak strain 227-11, associated with foodborne disease, produced high levels of CA in our experiments. It is tempting to hypothesize that this abundant production of CA by 227-11 favored the pathogen's persistence in contaminated sprouts during the 2011 outbreak in Europe.Citation6,Citation8,Citation51,Citation52
In addition to promoting persistence on vegetation, CA may also promote the early stages of infection. For instance, ingestion of a pathogen encased in an exopolyssacharide biofilm could confer resistance to low stomach acid.Citation37 After passage through the stomach, the strain encounters bile salts and 37°C temperature that induces down-regulation of CA, along with expression of other important virulence factors required for colonization. The full role of CA in the life cycle of pathogenic E. coli warrants further study.
Material and methods
Bacterial strain and growth conditions
Bacterial strains used in this study are shown in supplementary Table 3S. Bacterial cultures were routinely propagated in Luria Broth (LB) (American Bioanalytical, Natick, MA) from a fresh bacterial plate and grown overnight at 37°C. The overnight culture was diluted 1:100 in fresh medium and grown with shaking to optical density at 600 nm (OD600) of 0.8. When needed, kanamycin (km) was added to a final concentration of 50 μg ml−1. Colanic acid expression was induced on DMEM plates. The DMEM plates were made by mixing 1 volume of 3% sterile agar with 1 volume of DMEM high glucose medium (Gibco, Grand Island, NY).
Strains 042wcaF-wza, 042wcaE and kpsF-kpsM were generated by using λ-red system as previously described.Citation53 Briefly, the Tn5 neomycin phosphotransferase encoding gene (km resistance marker) was amplified by PCR using specific PCR primers and pKD4 plasmid as a template (supplementary Table 4S). The PCR fragment was electroporated in EAEC 042 and kanamycin resistant colonies were isolated and analyzed by PCR using specific primers.
For complementation, wcaE was amplified by PCR and cloned into pAar to generate pWcaE as previously reported.Citation54 The native EAEC042 wca promoter (FN554766.1, region c2395664-2395485), was predicted with BPROM server (http://softberry.com) and used in the complementation of 042wcaE. The promoter regions −10 and −35 are underlined.
Exopolysaccharide composition
The EAEC 227-11 and 042 strains were propagated in LB plates at 37°C and re-inoculated in DMEM high glucose plates. The exopolysaccharide-producing cultures were incubated for two days at room temperature on plates. The bacteria were harvested and resuspended in 5 ml of sterile water. The exopolysaccharide was separated by centrifugation at 14000 rpm for 15 min. The supernatant fraction was filtrated and use for carbohydrate analysis in the complex Carbohydrate Research Center at the University of Georgia.
Glycosyl composition analysis was performed by combined gas chromatography/mass spectrometry (GC/MS) of the per-O-trimethylsilyl (TMS) derivatives of the monosaccharide methyl glycosides produced from the sample by acidic methanolysis.Citation55 Briefly, an aliquot was taken from the sample and added to separate tubes with 20ug of Inositol as internal standard. Methyl glycosides were then prepared from the dry sample following the mild acid treatment by methanolysis in 1 M HCl in methanol at 80°C (16 hours), followed by re-N-acetylation with pyridine and acetic anhydride in methanol (for detection of amino sugars). The sample was then per-O-trimethylsilylated by treatment with Tri-Sil (Pierce) at 80°C (0.5 hours). GC/MS analysis of the TMS methyl glycosides was performed on an Agilent 7890A GC interfaced to a 5975C MSD, using a Supelco EC-1 fused silica capillary column (30m × 0.25 mm ID).
Exopolysaccharide quantification
Exopolysaccharide was quantified in the samples by measuring the fucose content.Citation56,Citation57 Briefly, 50 μl of EPS samples were mixed with 4.5 ml of sulfuric acid, and boiled for 20 minutes. The absorbance of the samples was recorded at 396 and 427 nm. Samples were mixed with 100 μl of 1M cysteine hydrochloride and optical densities (OD) were determined at 396 and 427 nm after treatment. Difference in the optical density before and after cysteine addition was correlated with the fucose concentration. A L-fucose (Sigma-Aldrich, St. Louis MO) calibration curve with concentration ranging from 5 – 100 μg ml−1 was used to determine the fucose concentration in the samples. The experiment was normalized to µg in 109 to 1011 CFU. All experiments were performed with two independent cultures.
Quantitative Real Time PCR (qRT-PCR)
To generate total RNA, 042, 042wcaF-wza, 042wcaE strains were grown for 48 h in DMEM high glucose plates at room temperature. Bacterial samples were harvested and resuspended in PBS. The samples were pelleted and washed with PBS to removed traces of contaminants. RNA was extracted using Trizol according to the manufacturer's instructions (Invitrogen, Carlsbad, CA). Contaminating DNA was removed using RNase-Free DNase Set (Qiagen, Maryland, USA). cDNA was synthesized by following standard procedures and quantitated by RealTime PCR (qRT-PCR). qRT-PCR was performed in a 7500 Real Time PCR System (Applied Biosystems, Foster City, CA). The primer sets used in this study are reported in supplementary table 4. Reactions were done in duplicate using two different RNA samples for each strain. The average change in CT expression comparing for each gene was normalized to the constitutively expressed cat gene as previously reported.Citation10
Transmission Electron Microscopy (TEM)
Strains were grown in DMEM high glucose plates for 48 hours at room temperature. Bacteria were harvested and resuspended in one ml of Cacodylate buffer (Caco) containing 75 mM of lysine (MP Biomedicals, LLC, Aurora Ohio, USA), 0.075% ruthenium red (Sigma-Aldrich, St. Louis MO), 2% of paraformaldehyde and 2.5% glutaraldehyde.Citation58 After overnight treatment with ruthenium red solution, the samples were pelleted and washed in distilled water. Samples were prepared at the Advanced Microscopy Laboratory at the University of Virginia (AML-UVA) following standard protocols and examined on a Jeol JEM1230 Transmission Electron Microscope (80 kV).
Scanning Electron Microscopy (SEM)
Alfalfa and broccoli sprouts were decontaminated overnight with 1.25% sodium hypochlorite solution and washed in sterile water to remove sodium hypochlorite traces. Sterile sprout leaves were inoculated with 1 × 10⁴ CFU of EAEC strains on DMEM high glucose plates and incubated a room temperature for 48 h. Sprout samples were prepared for scanning electron microscopy as previously described.Citation10 Fixed samples were prepared for SEM and examined by the AML-UVA core facility.
Bioinformatic and statistical analysis.
−35 and −10 regions of the Pwca promoter were predicted by using Bprom algorithm (http://linux1.softberry.com/cgi-bin/programs/gfindb/bprom.pl). Statistical analysis of the data for fucose quantification, and qRT-PCR analysis, was performed by using the GraphPad Prism 6 (GraphPad Software, Inc., CA, USA). The statistical significance of the differences in the sample means was calculated by using ANOVA with post hoc Tukey's correction. Results were considered significant at P < 0.05.
Disclosure of potential conflicts of interest
No potential conflicts of interest were disclosed
1429877.zip
Download Zip (775.6 KB)Additional information
Funding
References
- Nataro JP, Steiner T, Guerrant RL. Enteroaggregative Escherichia coli. Emerg Infect Dis. 1998;4:251–61. doi:10.3201/eid0402.980212.
- Dallman TJ, Chattaway MA, Cowley LA, Doumith M, Tewolde R, Wooldridge DJ, Underwood A, Ready D, Wain J, Foster K, et al. An investigation of the diversity of strains of enteroaggregative Escherichia coli isolated from cases associated with a large multi-pathogen foodborne outbreak in the UK. PLoS One. 2014;9:e98103. doi:10.1371/journal.pone.0098103.
- Nataro JP. Outbreak of hemolytic-uremic syndrome linked to Shiga toxin-producing enteroaggregative Escherichia coli O104:H4. Pediatr Res 2011;70:221. doi:10.1203/PDR.0b013e31822d5ce9.
- Rasko DA, Webster DR, Sahl JW, Bashir A, Boisen N, Scheutz F, Paxinos EE, Sebra R, Chin CS, Iliopoulos D, et al. Origins of the E. coli strain causing an outbreak of hemolytic-uremic syndrome in Germany. N Engl J Med. 2011;365:709–17. doi:10.1056/NEJMoa1106920.
- Scharlach M, Diercke M, Dreesman J, Jahn N, Krieck M, Beyrer K, Claußen K, Pulz M, Floride R. Epidemiological analysis of a cluster within the outbreak of Shiga toxin-producing Escherichia coli serotype O104:H4 in Northern Germany, 2011. Int J Hyg Environ Health. 2013;216:341–5. doi:10.1016/j.ijheh.2012.10.001.
- Buchholz U, Bernard H, Werber D, Böhmer MM, Remschmidt C, Wilking H, Deleré Y, an der Heiden M, Adlhoch C, Dreesman J, et al. German outbreak of Escherichia coli O104:H4 associated with sprouts. N Engl J Med. 2011;365:1763–70. doi:10.1056/NEJMoa1106482.
- Knodler M, Berger M, Dobrindt U. Long-term survival of the Shiga toxin-producing Escherichia coli O104:H4 outbreak strain on fenugreek seeds. Food Microbiol. 2016;59:190–5. doi:10.1016/j.fm.2016.06.005.
- King LA, Nogareda F, Weill FX, Mariani-Kurkdjian P, Loukiadis E, Gault G, Jourdan-DaSilva N, Bingen E, Macé M, Thevenot D, et al. Outbreak of Shiga toxin-producing Escherichia coli O104:H4 associated with organic fenugreek sprouts, France, June 2011. Clin Infect Dis. 2012;54:1588–94. doi:10.1093/cid/cis255.
- Nataro JP, Yikang D, Yingkang D, Walker K. AggR, a transcriptional activator of aggregative adherence fimbria I expression in enteroaggregative Escherichia coli. J Bacteriol. 1994;176:4691–9. doi:10.1128/jb.176.15.4691-4699.1994.
- Morin N, Santiago AE, Ernst RK, Guillot SJ, Nataro JP. Characterization of the AggR regulon in enteroaggregative Escherichia coli. Infect Immun. 2013;81:122–32. doi:10.1128/IAI.00676-12.
- Dudley EG, Thomson NR, Parkhill J, Morin NP, Nataro JP. Proteomic and microarray characterization of the AggR regulon identifies a pheU pathogenicity island in enteroaggregative Escherichia coli. Mol Microbiol. 2006;61:1267–82. doi:10.1111/j.1365-2958.2006.05281.x.
- Nishi J, Sheikh J, Mizuguchi K, Luisi B, Burland V, Boutin A, Rose DJ, Blattner FR, Nataro JP. The export of coat protein from enteroaggregative Escherichia coli by a specific ATP-binding cassette transporter system. J Biol Chem. 2003;278:45680–9. doi:10.1074/jbc.M306413200.
- Sheikh J, Czeczulin JR, Harrington S, Hicks S, Henderson IR, Le Bouguénec C, Gounon P, Phillips A, Nataro JP. A novel dispersin protein in enteroaggregative Escherichia coli. J Clin Invest 2002;110:1329–37. doi:10.1172/JCI16172.
- Harrington SM, Sheikh J, Henderson IR, Ruiz-Perez F, Cohen PS, Nataro JP. The Pic protease of enteroaggregative Escherichia coli promotes intestinal colonization and growth in the presence of mucin. Infect Immun. 2009;77:2465–73. doi:10.1128/IAI.01494-08.
- Boisen N, Scheutz F, Rasko DA, Redman JC, Persson S, Simon J, Kotloff KL, Levine MM, Sow S, Tamboura B, et al. Genomic characterization of enteroaggregative Escherichia coli from children in Mali. J Infect Dis. 2012;205:431–44. doi:10.1093/infdis/jir757.
- Ruiz-Perez F, Henderson IR, Leyton DL, Rossiter AE, Zhang Y, Nataro JP. Roles of periplasmic chaperone proteins in the biogenesis of serine protease autotransporters of Enterobacteriaceae. J Bacteriol. 2009;191:6571–83. doi:10.1128/JB.00754-09.
- Ruiz-Perez F, Wahid R, Faherty CS, Kolappaswamy K, Rodriguez L, Santiago A, Murphy E, Cross A, Sztein MB, Nataro JP. Serine protease autotransporters from Shigella flexneri and pathogenic Escherichia coli target a broad range of leukocyte glycoproteins. Proc Natl Acad Sci U S A. 2011;108:12881–6. doi:10.1073/pnas.1101006108.
- Koo H, Xiao J, Klein MI. Extracellular polysaccharides matrix–an often forgotten virulence factor in oral biofilm research. Int J Oral Sci. 2009;1:229–34. doi:10.4248/IJOS.09086.
- Adcox HE, Vasicek EM, Dwivedi V, Hoang KV, Turner J, Gunn JS. Salmonella Extracellular Matrix Components Influence Biofilm Formation and Gallbladder Colonization. Infect Immun. 2016;84:3243–51. doi:10.1128/IAI.00532-16.
- Jann K, Jann B. Capsules of Escherichia coli, expression and biological significance. Can J Microbiol. 1992;38:705–10. doi:10.1139/m92-116.
- Berk SL, Neumann P, Holtsclaw S, Smith JK. Escherichia coli pneumonia in the elderly with reference to the role of E. coli K1 capsular polysaccharide antigen. Am J Med. 1982;72:899–902. doi:10.1016/0002-9343(82)90849-X.
- Cross AS, Gemski P, Sadoff JC, Orskov F, Orskov I. The importance of the K1 capsule in invasive infections caused by Escherichia coli. J Infect Dis. 1984;149:184–93. doi:10.1093/infdis/149.2.184.
- Boulnois GJ, Roberts IS, Hodge R, Hardy KR, Jann KB, Timmis KN. Analysis of the K1 capsule biosynthesis genes of Escherichia coli: definition of three functional regions for capsule production. Mol Gen Genet. 1987;208:242–6. doi:10.1007/BF00330449.
- Whitfield C. Biosynthesis and assembly of capsular polysaccharides in Escherichia coli. Annu Rev Biochem. 2006;75:39–68. doi:10.1146/annurev.biochem.75.103004.142545.
- Whitfield C, Roberts IS. Structure, assembly and regulation of expression of capsules in Escherichia coli. Mol Microbiol 1999;31:1307–19. doi:10.1046/j.1365-2958.1999.01276.x.
- Grant WD, Sutherland IW, Wilkinson JF. Exopolysaccharide colanic acid and its occurrence in the Enterobacteriaceae. J Bacteriol. 1969;100:1187–93.
- Sutherland IW. The structure of colanic acid. J Gen Microbiol. 1969;57:18.
- Reeves PP, Wang L. Genomic organization of LPS-specific loci. Curr Top Microbiol Immunol. 2002;264:109–35.
- Preston A, Mandrell RE, Gibson BW, Apicella MA. The lipooligosaccharides of pathogenic gram-negative bacteria. Crit Rev Microbiol. 1996;22:139–80. doi:10.3109/10408419609106458.
- Whitfield C, Kaniuk N, Frirdich E. Molecular insights into the assembly and diversity of the outer core oligosaccharide in lipopolysaccharides from Escherichia coli and Salmonella. J Endotoxin Res. 2003;9:244–9. doi:10.1177/09680519030090040501.
- Jann K, Jann B. Polysaccharide antigens of Escherichia coli. Rev Infect Dis. 1987;9 Suppl 5:S517–26. doi:10.1093/clinids/9.Supplement_5.S517.
- Chaudhuri RR, Sebaihia M, Hobman JL, Webber MA, Leyton DL, Goldberg MD, Cunningham AF, Scott-Tucker A, Ferguson PR, Thomas CM, et al. Complete genome sequence and comparative metabolic profiling of the prototypical enteroaggregative Escherichia coli strain 042. PLoS One. 2010;5:e8801. doi:10.1371/journal.pone.0008801.
- Stevenson G, Lan R, Reeves PR. The colanic acid gene cluster of Salmonella enterica has a complex history. FEMS Microbiol Lett. 2000;191:11–6. doi:10.1111/j.1574-6968.2000.tb09312.x.
- Stevenson G, Andrianopoulos K, Hobbs M, Reeves PR. Organization of the Escherichia coli K-12 gene cluster responsible for production of the extracellular polysaccharide colanic acid. J Bacteriol. 1996;178:4885–93. doi:10.1128/jb.178.16.4885-4893.1996.
- Lopez-Torres AJ, Stout V. Role of colanic acid polysaccharide in serum resistance in vivo and in adherence. Curr Microbiol. 1996;33:383–9. doi:10.1007/s002849900132.
- Mao Y, Doyle MP, Chen J. Insertion mutagenesis of wca reduces acid and heat tolerance of enterohemorrhagic Escherichia coli O157:H7. J Bacteriol. 2001;183:3811–5. doi:10.1128/JB.183.12.3811-3815.2001.
- Mao Y, Doyle MP, Chen J. Role of colanic acid exopolysaccharide in the survival of enterohaemorrhagic Escherichia coli O157:H7 in simulated gastrointestinal fluids. Lett Appl Microbiol. 2006;42:642–7.
- Danese PN, Pratt LA, Kolter R. Exopolysaccharide production is required for development of Escherichia coli K-12 biofilm architecture. J Bacteriol. 2000;182:3593–6. doi:10.1128/JB.182.12.3593-3596.2000.
- Domka J, Lee J, Bansal T, Wood TK. Temporal gene-expression in Escherichia coli K-12 biofilms. Environ Microbiol. 2007;9:332–46. doi:10.1111/j.1462-2920.2006.01143.x.
- Nataro JP, Deng Y, Cookson S, Cravioto A, Savarino SJ, Guers LD, Levine MM, Tacket CO. Heterogeneity of enteroaggregative Escherichia coli virulence demonstrated in volunteers. J Infect Dis. 1995;171:465–8. doi:10.1093/infdis/171.2.465.
- Eslava C, Navarro-Garcia F, Czeczulin JR, Henderson IR, Cravioto A, Nataro JP. Pet, an autotransporter enterotoxin from enteroaggregative Escherichia coli. Infect Immun. 1998;66:3155–63.
- Vial PA, Robins-Browne R, Lior H, Prado V, Kaper JB, Nataro JP, Maneval D, Elsayed A, Levine MM. Characterization of enteroadherent-aggregative Escherichia coli, a putative agent of diarrheal disease. J Infect Dis. 1988;158:70–9. doi:10.1093/infdis/158.1.70.
- Olesen B, Neimann J, Bottiger B, Ethelberg S, Schiellerup P, Jensen C, Helms M, Scheutz F, Olsen KE, Krogfelt K, et al. Etiology of diarrhea in young children in Denmark: a case-control study. J Clin Microbiol. 2005;43:3636–41. doi:10.1128/JCM.43.8.3636-3641.2005.
- Itoh Y, Nagano I, Kunishima M, Ezaki T. Laboratory investigation of enteroaggregative Escherichia coli O untypeable:H10 associated with a massive outbreak of gastrointestinal illness. J Clin Microbiol. 1997;35:2546–50.
- Bernier C, Gounon P, Le Bouguenec C. Identification of an aggregative adhesion fimbria (AAF) type III-encoding operon in enteroaggregative Escherichia coli as a sensitive probe for detecting the AAF-encoding operon family. Infect Immun. 2002;70:4302–11. doi:10.1128/IAI.70.8.4302-4311.2002.
- Touchon M, Hoede C, Tenaillon O, Barbe V, Baeriswyl S, Bidet P, Bingen E, Bonacorsi S, Bouchier C, Bouvet O, et al. Organised genome dynamics in the Escherichia coli species results in highly diverse adaptive paths. PLoS Genet. 2009;5:e1000344. doi:10.1371/journal.pgen.1000344.
- Mathewson JJ, Oberhelman RA, Dupont HL, Javier de la Cabada F, Garibay EV. Enteroadherent Escherichia coli as a cause of diarrhea among children in Mexico. J Clin Microbiol. 1987;25:1917–9.
- Cobeljic M, Miljkovic-Selimovic B, Paunovic-Todosijevic D, Velicković Z, Lepsanović Z, Zec N, Savić D, Ilić R, Konstantinović S, Jovanović B, et al. Enteroaggregative Escherichia coli associated with an outbreak of diarrhoea in a neonatal nursery ward. Epidemiol Infect. 1996;117:11–6. doi:10.1017/S0950268800001072.
- Nataro JP, Baldini MM, Kaper JB, Black RE, Bravo N, Levine MM. Detection of an adherence factor of enteropathogenic Escherichia coli with a DNA probe. J Infect Dis. 1985;152:560–5. doi:10.1093/infdis/152.3.560.
- Nwodo UU, Green E, Okoh AI. Bacterial exopolysaccharides: functionality and prospects. Int J Mol Sci. 2012;13:14002–15. doi:10.3390/ijms131114002.
- Baranzoni GM, Fratamico PM, Rubio F, Glaze T, Bagi LK, Albonetti S. Detection and isolation of Shiga toxin-producing Escherichia coli (STEC) O104 from sprouts. Int J Food Microbiol. 2014;173:99–104. doi:10.1016/j.ijfoodmicro.2013.12.020.
- Centers for Disease C, Prevention. Outbreak of Escherichia coli O104:H4 infections associated with sprout consumption – Europe and North America, May-July 2011. MMWR Morb Mortal Wkly Rep. 2013;62:1029–31.
- Datsenko KA, Wanner BL. One-step inactivation of chromosomal genes in Escherichia coli K-12 using PCR products. Proc Natl Acad Sci U S A. 2000;97:6640–5. doi:10.1073/pnas.120163297.
- Santiago AE, Ruiz-Perez F, Jo NY, Vijayakumar V, Gong MQ, Nataro JP. A large family of antivirulence regulators modulates the effects of transcriptional activators in Gram-negative pathogenic bacteria. PLoS Pathog. 2014;10:e1004153. doi:10.1371/journal.ppat.1004153.
- Oxley D, Currie G, Bacic A. Monosaccharide analysis by methanolysis. CSH Protoc. 2006;2006(1):11.
- Scott RW, Moore WE, Effland MJ, Millett MA. Ultraviolet spectrophotometric determination of hexoses, pentoses, and uronic acids after their reactions with concentrated sulfuric acid. Anal Biochem. 1967;21:68–80. doi:10.1016/0003-2697(67)90084-X.
- Thibert RJ, Mazzuchin A. Study of sugars with cysteine–sulfuric acid reagents. Can J Biochem. 1969;47:203–6. doi:10.1139/o69-031.
- Fassel TA, Mozdziak PE, Sanger JR, Edmiston CE. Superior preservation of the staphylococcal glycocalyx with aldehyde-ruthenium red and select lysine salts using extended fixation times. Microsc Res Tech. 1998;41:291–7. doi:10.1002/(SICI)1097-0029(19980515)41:4%3c291::AID-JEMT2%3e3.0.CO;2-U.