
ABSTRACT
Studies of the human intestinal microbiome in patients with inflammatory bowel disease (IBD) consistently show that there are differences (an abnormal or unbalanced microbiome, “dysbiosis”) when compared to healthy subjects. We sought to describe changes in the microbiome in individual patients over time, and determine the clinical factors that are associated with significant alteration. Forty-two mucosal biopsies were collected from 20 patients that were spaced an average of 2.4 years apart. These were analysed using bacterial 16S rRNA gene high-throughput sequencing methods. Presence of active inflammation was determined endoscopically and histologically. Inferred metagenomics analysis was conducted using the PICRUSt package. We found that the differences in the microbiome over time in individual patients were greatest in the presence of ongoing intestinal inflammation, as determined by the Yue and Clayton theta distance between sample pairs (adjusted p = 0.00031). Samples from patients with previous abdominal surgery had lower alpha (within sample) diversity compared with those with no prior operations (mean Shannon index 2.083, 2.510 respectively, p = 0.017). There were no changes in the inferred bacterial metagenomic profile. The microbiome in IBD undergoes considerable fluctuation over time. These changes are greatest when there is histologically confirmed inflammation at both time-points.
Introduction
The intestinal microbiome of patients with inflammatory bowel diseases (IBD; Crohn's disease (CD) and ulcerative colitis (UC)) differs significantly from normal controls.Citation1-Citation3 As no single microorganism has been identified as the cause of IBD, the focus of current research has shifted to studying the characteristic “dysbiosis”Citation4-Citation6 (an abnormal or unbalanced microbiome) and developing therapies to correct it.Citation7,Citation8 This is based on the assumption that it is the dysbiosis that leads to the uncontrolled inflammation characteristic of IBD, either directly, or by interfering with mucosal protective mechanisms.
In general, a reduction in bacterial diversity is seen in patients with active IBD.Citation9 Of the four main bacterial phyla found in the gut, Bacteroidetes, Firmicutes, Actinobacteria and Proteobacteria, increases in Bacteroidetes and a reduction in Firmicutes are commonly associated with disease. Changes to the abundance of specific organisms have also been associated with IBD. For example, a reduction in abundance of the butyrate-producing bacterium, Faecalibacterium prausnitzii is commonly seen in the setting of active inflammation,Citation10,Citation11 whereas the abundance of Escherichia coli is commonly increased in active IBD.
While the human gut microbiome has been shown to maintain a certain degree of stability over time,Citation12,Citation13 several factors are associated with disruption of its diversity and species richness. For example, perturbations in the intestinal microbiome follow gastrointestinal infection, antibiotic use and smoking.Citation14-Citation16
The Human Microbiome Project, which analysed the oral, gastrointestinal, skin and vaginal microbiomes of 242 healthy adults at two time points,Citation17 demonstrated significant inter-individual differences. Despite this, most published studies focusing on the IBD microbiome obtained samples from a single time-point, and compared microbial communities between subjects. In addition, most studies used faecal samples to characterize the intestinal microbiome and to determine whether there was active inflammation (faecal calprotectin). Faecal specimens do not necessarily reflect the nature of the mucosa-adherent bacteria,Citation18 nor the degree of inflammation.Citation19 While the use of faecal calprotectin measurements is useful in the setting of screening for gastrointestinal inflammation,Citation20 it is not as accurate as endoscopic or histological assessment in patients with IBD, especially those with small bowel inflammation.Citation21,Citation22
We analysed temporal changes in the IBD microbiome using the best methods available: mucosal samples were used to characterize the microbiome, and intestinal histology to determine whether or not there was active inflammation. Our aims were to describe the fluctuations of the microbiome of patients with established or newly diagnosed IBD over time, with a view to identify clinical and microbial factors that may be associated with remission or the development of disease activity at a later time-point.
Results
Forty-two temporally spaced biopsy or resection specimens were collected from 20 patients with IBD (16 CD, 4 UC) between 2004 and 2014 at Canberra Hospital. Specimens were collected from 19 patients who had undergone two procedures, and one patient who had undergone four separate procedures during the collection period. The mean time between procedures was 2.4 years (± standard deviation (SD) 1.7 years). The majority of samples were collected at time of colonoscopy (34 samples, representing 81% of the total), and eight were collected at time of intestinal resection. Inflammatory status was determined by the proceduralist (endoscopy or operation report, 42 of 42 available), and histopathology report (36 of 42 available). Overall, 60% of patient samples had active inflammation at all time-points. describes the clinical details of the patients and samples in greater detail (see also Supplementary ).
Table 1. Patient demographic data, Montreal disease phenotype classification and medication exposure. Active inflammation defined as disease activity reported endoscopically or histologically. Other medications included sirolimus and abatacept.
Samples from patients with previous abdominal surgery had lower alpha diversity compared with those with no prior operations (mean Shannon index 2.083, 2.510 respectively, p = 0.017), a finding shared by other studies.Citation23 Within the other clinical subgroups there were no significant differences in alpha diversity (Supplementary and Supplementary Table 2). Surgical resection was also associated with lower abundance of Faecalibacterium prausnitzii (mean 0.014 vs 0.248 respectively, p = 0.001). No significant differences were detected in other diversity indices.
Figure 1. Non-metric multi-dimensional scaling plot of Yue and Clayton theta distances between all samples. Numbers represent different patients. a represents a sample collected at the first time-point, b represents the second time-point, c at third time-point and d the fourth. Samples taken in the presence of active inflammation (histological or endoscopic) are coloured red, those with no inflammation are coloured blue. Samples from those with Crohn's disease are circles, samples from those with ulcerative colitis are squares.
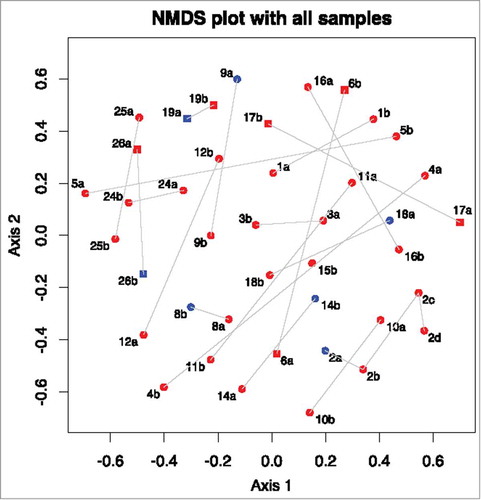
The non-metric multidimensional scaling (NMDS) plot in shows that the microbiome of some patients changed markedly between procedures, whereas others did not. To find out if this was related to underlying patient characteristics, Yue and Clayton theta (⊝YC) distances between different time points from the same patient were compared to clinical metadata. A significant difference was detected between sample pairs with no active inflammation at one time-point compared to those with histologically confirmed active inflammation at both time-points (adjusted p = 0.00031, see and ). Statistical significance was retained even after exclusion of samples from patients with previous abdominal surgery and those with antibiotic exposure (p = 0.0050). A linear regression was performed to determine if time between procedures could explain the changes in the microbiome, but no significant associations with alpha diversity or with ⊝YC sample pair distance were detected (p = 0.314 and 0.227 respectively) (see also Supplementary ).
Figure 2. Differences in beta diversity distances (Yue and Clayton theta distances), pairwise, based on presence or absence of inflammation. Sample pairs (ie from the same patient) had inflammation at both time-points (Active-active); had active inflammation initially, and no inflammation at follow-up (Active-inactive); or no inflammation initially and active inflammation at follow-up (Inactive-active).
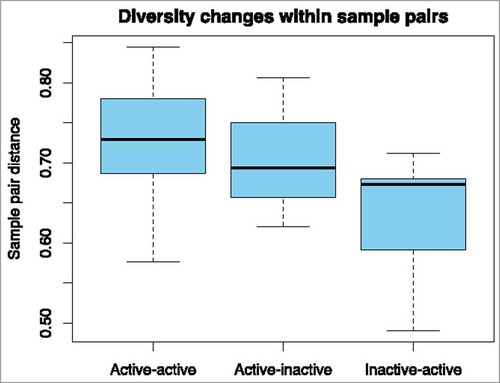
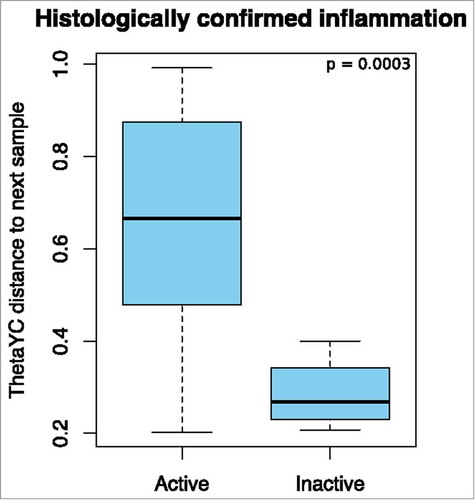
Figure 3. Beta diversity: Yue and Clayton theta distances between sample pairs. The presence (active, n = 29) or absence (inactive, n = 4) of histologically confirmed inflammation and the distance to the next sample.
Weighted Unifrac calculations demonstrated significant differences in the structures of the communities from samples with active inflammation compared to those without (score = 0.5800, p < 0.001). Samples collected in the presence of inflammation were associated with a lower relative abundance of bacteria from the phylum, Firmicutes, and a higher proportion of Bacteroidetes compared to those with no inflammation, but these were not statistically significant (Supplementary ). OTU analysis did not reveal individual OTUs to be significantly differently represented across the two groups after correction for false discovery (Supplementary Table 3). However, the relative abundance of Faecalibacterium prausnitzii was noted to be lower in samples with active inflammation compared to those without (mean relative abundance 0.1931 vs 0.2817 respectively, one-way ANOVA p = 0.010). Consistent with previous studies, a lower relative abundance of F. prausnitzii was noted in patients with CD versus UC (mean 0.1268 v 0.3467 respectively, p = 0.041).
There were significant differences in the structure of the bacterial communities of smokers compared to non-smokers (weighted Unifrac Score 0.505499, p = 0.011), but no significant differences in relative abundance in individual OTUs between smokers and non-smokers once p values were corrected. There were no differences in alpha diversity or ⊝YC distance between sample pairs based on smoking status, even when those with UC were excluded.
Inferred metagenomics pathway analysis did not detect significant differences between the samples based on clinical metadata including prior surgery, IBD subtype, smokers, medication and antibiotic exposure and presence of inflammation (Supplementary ).
Discussion
Here we describe changes in the microbiome over an average 2.4 years in 20 patients suffering from IBD, using mucosal samples to characterize the microbiome, and endoscopic and histological analyses to assess the degree of inflammation. When both samples were obtained in the presence of inflammation, the bacterial populations were more dissimilar than if one sample had no evidence of inflammation. We believe that this reflects an inherent instability of the microbiome in patients with ongoing inflammation.
All human temporal studies of the microbiome in IBD to date used no or surrogate markers for inflammation and most used stool samples. Shaw et al used faecal calprotectin as a marker of inflammation and stool specimens to analyse the microbiome in a longitudinal study of 19 newly diagnosed paediatric patients.Citation24 They describe ongoing dysbiosis in patients with high faecal calprotectin levels. Wright et alCitation23 used 16S rRNA sequencing of intestinal biopsies to analyse the microbial communities of 34 patients who had undergone ileocaecal resection. There was no decrease in alpha diversity in patients who remained in remission compared to those who developed endoscopically active disease, but they did not report changes in microbiome related to histologically confirmed inflammation. The presence of Proteus in post-operative ileal mucosal specimens was independently associated with post-operative recurrence (OR 13 (1.1-150), p = 0.039), but we only identified Proteus in one sample; from a patient with active Crohn's disease with no prior surgery. Will et alCitation25 used faecal samples to describe bacterial communities from 19 IBD patients in remission who later developed active disease. They did not find significant differences in alpha diversity between the two groups, but found that thiopurine use was associated with a significant reduction in richness and diversity based on Choa1 and Shannon diversity indices (Shannon index: 5.13 vs 6.78, in non-users and users respectively; p < 0.01). In our study, thiopurine use was not associated with differences in alpha diversity (mean Shannon index: 2.46 vs 2.29, in non-users and users respectively; p = 0.322), nor were there differences in relative abundances of specific taxa. Similarly, there were no differences in alpha diversity with respect to anti-TNFα use (mean Shannon index 2.41 vs 2.26, in those on anti-TNFα agents and those not respectively; p = 0.30). Martinez et alCitation26 used denaturing gradient gel electrophoresis (DGGE) band profiles from bacterial 16S rRNA amplicons obtained from faecal samples in IBD patients and controls. They described significant reductions in overall diversity as well as temporal instability in 16 patients with UC over one year compared with 8 healthy controls.
In the largest temporal study conducted to date, Halfvarson et alCitation1 conducted bacterial 16S rRNA high-throughput sequencing of three-monthly faecal samples to describe the changes in 109 patients with IBD over a two-year period, with a control group consisting of nine subjects. They found that the microbiome of IBD patients was more volatile, and deviated significantly from a defined “healthy plane”, to which the normal controls were confined. Using faecal calprotectin levels >150 μg/g as a marker of disease activity they found that inflammation was not directly correlated with distance to the healthy plane, but there was some correlation between the observed dramatic fluctuations in the gut microbiome and intensified medication due to a flare of the disease. They did not identify specific bacterial taxa that varied significantly with active inflammation.
In animal models, it is not necessary to use surrogate markers and an association between inflammation and its effects on the microbiome can be demonstrated. Lupp et al (2007) described a clear and significant reduction in the number and diversity of colonic bacteria in the presence of host-mediated intestinal inflammation.Citation27 These changes were described in inflammatory models induced by Citrobacter rodentium infection, dextran sodium sulfate (DSS) administration and IL10 knockout mice.
There were several limitations of our study. The number of samples is relatively small, but we used the most accurate means of measuring both the mucosa-associated microbiome and the degree of inflammation: demonstrating statistical significance with a small sample size is indicative of the power of the effect. The absence of a control group limits comparisons to IBD subjects alone, but having a healthy control group undergoing repeated colonoscopy and mucosal biopsy is not without risk, so HREC/IRB approval was not sought. There was some heterogeneity in the nature of the specimens: 81% of samples were obtained at the time of colonoscopy, and eight samples were collected at the time of bowel resection. However, these two groups did not differ in their diversity indices even accounting for exposure to antibiotics at the time of surgery. Nor were there significant differences in bacterial composition based on the relative abundance of OTUs. Diet, which leads to substantial changes in the microbiome,Citation28,Citation29 could not be controlled, which may also have influenced results.
Patients with IBD are exposed to many different medications and an almost universal criticism of all clinical studies in IBD is a failure to account for their confounding effect. The only way to overcome this is to study inception cohorts, but even then, given that most patients suffering from IBD will go on to receive maintenance therapy, the expectation that there will be treatment-naïve controls at different time-points is unlikely to be met by any study. It is also unlikely that any patient with active disease would remain on a stable treatment regimen over time. Flares of the disease, intensification of medication and changes in the microbiome occur simultaneously: our strategy to analyse the relationship between these factors was to use the most accurate measures of inflammation and the microbiome and to control for the effects of medication in the statistical analysis.
Our results suggest that patients with IBD are less able to maintain a stable microbial community because of uncontrolled inflammation. Our group has previously demonstrated that bowel preparation and colonoscopy does not change the microbiota in most subjects,Citation30 but noted that three patients suffering from ulcerative colitis did not have restoration of their pre-colonoscopy microbiome. Therapeutic manipulation of the microbiome, for example with faecal microbial transplantation, has had mixed results in IBD cohorts compared to those with recurrent Clostridium difficile colitis,Citation31,Citation32 also raising the possibility that there is instability of the microbiome in IBD patients compared to previously healthy subjects.
In summary, our study demonstrated temporal shifts in the microbiome of patients with IBD that were closely correlated to the presence or absence of inflammation. The microbiome over time was least similar in those who had ongoing histological inflammation suggesting that it was the cause rather than the consequence of “dysbiosis”. The implications are important given the efforts to develop various products to treat IBD by correcting “dysbiosis” (e.g. pre- and probiotics, therapeutic microbiota, and faecal microbial transplantation). If “dysbiosis” were the cause of these differences, the inference of our study is that there are different types of “dysbiosis” leading to inflammation in the same patient at different times.
The evidence for a microbial trigger in the development of IBD is strong, but no unique microorganism or “dysbiosis” common to all patients has been identified despite intensive analysis by many groups. Recent evidence linking cells of the monocyte-macrophage lineage to genetic susceptibility for IBD, leads us to suggest that it is the dysregulation of monocyte adaptation to the environment of the gastrointestinal mucosa that causes inflammation in patients suffering from IBD and the resultant “dysbiosis”.Citation33 Future studies examining the interaction between an individual's innate immune system and specific components of the microbiome may lead to a better understanding of the mechanisms by which microbes initiate inflammation in IBD.
Materials and methods
Ethical approval was obtained from the Australian National University (Protocol: 2012/596) and ACT Health (Protocol: ETH.5.07.464). Each subject provided written informed consent.
Biopsy samples were collected from patients with known or suspected IBD attending Canberra Hospital between 2004 and 2014 at the time of colonoscopy or intestinal resection. Biopsy samples were placed in a sterile tube containing RNAlater® at the time of colonoscopy or resection. Samples were kept at 4°C for 24 h and transferred to -80°C for storage.
Clinical information was collected at the time of the procedure. This included disease status, date of diagnosis, Montreal classification, gender, age, smoking status, surgical history, medication use and recent exposure to antibiotics. The presence (hereafter referred to as “active”) or absence (“inactive”) of inflammation was determined by endoscopic assessment and the presence of microscopic inflammation in the histopathology report (“histologically confirmed”). Samples were only described as “inactive” if there was no evidence of inflammation endoscopically or histologically.
DNA extraction
With a few modifications, DNA extraction was performed using a Qiagen DNeasy Blood and Tissue kit (catalogue number 69504) as per the manufacturer's instructions. Bead beating was performed in TE buffer at 30 rev/s for 3 min until visibly homogenised, using 15–20 0.1 mm beads for bacterial cell lysis, four 2.3 mm and four 1 mm beads for eukaryotic cell lysis (Daintree Scientific). The amount and quality of DNA eluted was measured using a Nanodrop ND-1000 spectrophotometer (Analytical Technologies).
16S rRNA high throughput sequencing
Amplification of variable region 4 (V4) of the 16S rRNA gene was performed using the following primers: 515F (5'-CCA TCT CAT CCC TGC GTG TCT CCG ACT CAG BARCODE TGT GCC AGC MGC CGC GGT AA-3') and 806R (5'-CCT CTC TAT GGG CAG TCG GTG AT GGA CTA CHV GGG TWT CTA AT-3') where the sequences in bold represent Adapter A and Adapter P1 of the Ion PGM Hi-Q View OT kit (Life Technologies), BARCODE represents the 10 bp IonExpress barcode and the remainder represents the V4 region of the 16S rRNA gene. PCR was performed using the Platinum Taq DNA Polymerase High Fidelity kit (catalogue number 11304-011) on a BioRad T100 thermal cycler (Bio-Rad Laboratories). 50 µL reactions contained 5 µL of 10x HiFi buffer, 1 µL of 10 µM deoxynucleotide triphosphate mix, 2 µL of 50 µM magnesium sulphate solution, 2.5 µL of 10 mM IonTorrent forward primer, 2.5 µL of 10 mM reverse primer, 0.2 µL of Platinum Taq DNA polymerase, up to 35.8 µL sterile distilled water, and up to 5 µL of template DNA. Initial denaturation was performed at 94°C for 3 min. This was followed by 30 cycles of denaturation at 94°C for 15 s, annealing at 55°C for 30 s, and extension at 68°C for 1 min. Final extension was performed at 68°C for 10 min. PCR products were extracted from 1.5% agarose gels. Following this, the PCR products underwent gel purification (Wizard SV Gel and PCR Cleanup System, Promega) and bead purification (Agencourt AMPure XP, Beckman Coulter). DNA concentrations were determined with an Agilent 2100 Bioanalyzer (Agilent Technologies) on DNA 1000 chips. Equimolar amounts of PCR products were combined and used as template for the Ion PGM Hi-Q SEQ kit (400bp) reactions. The Ion PGM (Life Technologies) platform was used to sequence the products.
Sequence processing
16S rRNA gene sequences were processed and analysed using the open source program mothur v 1.36.134 and the accompanying 454 standard operating procedure.Citation35 Sequences were trimmed, using a qwindow average of 30 and window size of 50. Low-quality sequences were eliminated. Sequences were then trimmed of barcode (0 bp barcode mismatches allowed) and primer (2bp mismatches allowed) then merged. A total of 5,152,850 sequences were detected, and 881,073 were unique. Chimeras were removed using the UCHIME reference based method.Citation36 Sequences were classified using the Silva reference set (release 123)Citation37 and a cut-off of 80. A distance matrix with a cut-off of 0.15 was calculated using the dist.seqs command in mothur. Sequences were then classified into operational taxonomic units (OTUs) using a 97% cut-off value. After filtering, clustering and classifying the samples, 13,394 unique sequences were identified, from a total 1,221,636 sequences (average 250 bp). Each sample contained an average 29,788 quality sequences (range 329-137,563), representing an average of 119 OTUs. Samples were rarefied to 1418 sequences, which excluded one pair of samples with a low number of sequence reads. Intra-sample (alpha) diversity was measured by calculating the Shannon diversity index. Comparisons were made between different clinical parameters, including active/inactive inflammation, smoking status, disease type (CD or UC), previous surgery, medication exposure and disease duration (Supplementary ).
Statistical analysis
Alpha diversity was measured by calculating the Shannon index and Chao1 richness estimator using mothur. Non-metric multidimensional scaling (NMDS) plots were created after calculating distance matrices. An NMDS plot demonstrates the distance between samples in two dimensions. The further two points are from each other the greater the difference in their microbiomes. To determine what factors are associated with the greatest change over time, Yue and Clayton theta (⊝YC) distances between sample pairs were compared within clinical groups.Citation38 This takes into account the relative abundance of shared and non-shared OTUs in the samples compared. The more dissimilar the bacterial populations within two samples are the larger the ⊝YC distance becomes. Analyses by OTU were performed using mothur, R (version 3.3.2) and metastats.Citation39,Citation40 The samples were grouped according to disease status (active or inactive), smoking status, previous abdominal surgery, IBD subtype (CD or UC), medication use, disease duration, sampling technique (colonoscopy or resection) and examined for differentially abundant bacterial taxa using metastats within mothur. To reduce false discovery, OTUs were only included where they represented an average relative abundance > 0.1%. Where adjusted p values were calculated, they were corrected for false discovery using the Benjamini-Hochberg method. A hypothesis was considered significant if the adjusted p value was <0.05. Comparisons between groups were conducted using one-way ANOVA tests, student's t-test and linear regression analyses, using R (vegan and stats packages) and IBM SPSS Statistics (version 24.0).
Inferred metagenomics
Rarefied sequence datafiles were aligned to the Greengenes reference (version 13.8) using 97% identity for use in the Phylogenetic Investigation of Communities by Reconstruction of Unobserved States (PICRUSt) analysis pipeline.Citation41 Samples were first normalised by copy number, and metagenomic prediction was performed based on the Kyoto Encyclopaedia of Genes and Genomes (KEGG). Kruskal-Wallis sum-rank test and Linear Discriminant Analysis Effect Size (LEfSe) were used to determine metabolic functional pathways that were differentially abundant between groups.Citation42
Disclosure of potential conflicts of interest
No potential conflicts of interest were disclosed.
-file002.pdf
Download PDF (465.9 KB)Acknowledgments
We wish to thank the patients who allowed us to take samples for research and the many nurses and surgeons who assisted in the collection of this material. The authors wish to thank Prof David Gordon for his comments on this manuscript.
Additional information
Funding
References
- Halfvarson J, Brislawn CJ, Lamendella R, Vazquez-Baeza Y, Walters WA, Bramer LM, D'Amato M, Bonfiglio F, McDonald D, Gonzalez A, et al. Dynamics of the human gut microbiome in inflammatory bowel disease. Nat Microbiol. 2017;2:17004. doi:10.1038/nmicrobiol.2017.4. PMID:28191884.
- Huttenhower C, Kostic AD, Xavier RJ. Inflammatory bowel disease as a model for translating the microbiome. Immunity. 2014;40:843–54. doi:10.1016/j.immuni.2014.05.013. PMID:24950204.
- Dalal SR, Chang EB. The microbial basis of inflammatory bowel diseases. J Clin Invest. 2014;124:4190–6. doi:10.1172/JCI72330. PMID:25083986.
- Butto LF, Haller D. Dysbiosis in crohn's disease – joint action of stochastic injuries and focal inflammation in the gut. Gut Microbes. 2017;8:53–8. doi:10.1080/19490976.2016.1270810. PMID:28102757.
- Nagao-Kitamoto H, Kamada N. Host-microbial cross-talk in inflammatory bowel disease. Immune Netw. 2017;17:1–12. doi:10.4110/in.2017.17.1.1. PMID:28261015.
- Lin L, Zhang J. Role of intestinal microbiota and metabolites on gut homeostasis and human diseases. BMC Immunol. 2017;18:2. doi:10.1186/s12865-016-0187-3. PMID:28061847.
- Sartor RB, Wu GD. Roles for intestinal bacteria, viruses, and fungi in pathogenesis of inflammatory bowel diseases and therapeutic approaches. Gastroenterology. 2017;152:327–39 e4. doi:10.1053/j.gastro.2016.10.012. PMID:27769810.
- Cohen NA, Maharshak N. Novel indications for fecal microbial transplantation: Update and review of the literature. Dig Dis Sci. 2017;62:1131–1145. doi:10.1007/s10620-017-4535-9.
- Wright EK, Kamm MA, Teo SM, Inouye M, Wagner J, Kirkwood CD. Recent advances in characterizing the gastrointestinal microbiome in crohn's disease: A systematic review. Inflamm Bowel Dis. 2015;21:1219–28. PMID:25844959.
- Machiels K, Joossens M, Sabino J, De Preter V, Arijs I, Eeckhaut V, Ballet V, Claes K, Van Immerseel F, Verbeke K, et al. A decrease of the butyrate-producing species roseburia hominis and faecalibacterium prausnitzii defines dysbiosis in patients with ulcerative colitis. Gut. 2014;63:1275–83. doi:10.1136/gutjnl-2013-304833. PMID:24021287.
- Sokol H, Seksik P, Furet JP, Firmesse O, Nion-Larmurier I, Beaugerie L, Cosnes J, Corthier G, Marteau P, Dore J. Low counts of faecalibacterium prausnitzii in colitis microbiota. Inflamm Bowel Dis. 2009;15:1183–9. doi:10.1002/ibd.20903. PMID:19235886.
- Lozupone CA, Stombaugh JI, Gordon JI, Jansson JK, Knight R. Diversity, stability and resilience of the human gut microbiota. Nature. 2012;489:220–30. doi:10.1038/nature11550. PMID:22972295.
- Caporaso JG, Lauber CL, Costello EK, Berg-Lyons D, Gonzalez A, Stombaugh J, Knights D, Gajer P, Ravel J, Fierer N, et al. Moving pictures of the human microbiome. Genome Biol. 2011;12:R50. doi:10.1186/gb-2011-12-5-r50. PMID:21624126.
- Dethlefsen L, Huse S, Sogin ML, Relman DA. The pervasive effects of an antibiotic on the human gut microbiota, as revealed by deep 16s rrna sequencing. PLoS Biol. 2008;6:e280. doi:10.1371/journal.pbio.0060280. PMID:19018661.
- Higuchi LM, Khalili H, Chan AT, Richter JM, Bousvaros A, Fuchs CS. A prospective study of cigarette smoking and the risk of inflammatory bowel disease in women. Am J Gastroenterol. 2012;107:1399–406. doi:10.1038/ajg.2012.196. PMID:22777340.
- Nelson AM, Walk ST, Taube S, Taniuchi M, Houpt ER, Wobus CE, Young VB. Disruption of the human gut microbiota following norovirus infection. PLoS One. 2012;7:e48224. doi:10.1371/journal.pone.0048224. PMID:23118957.
- Consortium HMP. Structure, function and diversity of the healthy human microbiome. Nature. 2012;486:207–14. doi:10.1038/nature11234. PMID:22699609.
- Gevers D, Kugathasan S, Denson LA, Vazquez-Baeza Y, Van Treuren W, Ren B, Schwager E, Knights D, Song SJ, Yassour M, et al. The treatment-naive microbiome in new-onset crohn's disease. Cell Host Microbe. 2014;15:382–92. doi:10.1016/j.chom.2014.02.005. PMID:24629344.
- Lin JF, Chen JM, Zuo JH, Yu A, Xiao ZJ, Deng FH, Nie B, Jiang B. Meta-analysis: Fecal calprotectin for assessment of inflammatory bowel disease activity. Inflamm Bowel Dis. 2014;20:1407–15. doi:10.1097/MIB.0000000000000057. PMID:24983982.
- van Rheenen PF, Van de Vijver E, Fidler V. Faecal calprotectin for screening of patients with suspected inflammatory bowel disease: Diagnostic meta-analysis. BMJ. 2010;341:c3369. doi:10.1136/bmj.c3369. PMID:20634346.
- Kopylov U, Yung DE, Engel T, Avni T, Battat R, Ben-Horin S, Plevris JN, Eliakim R, Koulaouzidis A. Fecal calprotectin for the prediction of small-bowel crohn's disease by capsule endoscopy: A systematic review and meta-analysis. Eur J Gastroenterol Hepatol. 2016;28:1137–44. doi:10.1097/MEG.0000000000000692. PMID:27415156.
- Panes J, Jairath V, Levesque BG. Advances in use of endoscopy, radiology, and biomarkers to monitor inflammatory bowel diseases. Gastroenterology. 2017;152:362–73 e3. doi:10.1053/j.gastro.2016.10.005. PMID:27751880.
- Wright EK, Kamm MA, Wagner J, Teo SM, De Cruz P, Hamilton AL, Ritchie KJ, Inouye M, Kirkwood CD. Microbial factors associated with post-operative crohn's disease recurrence. J Crohns Colitis. 2017;11:191–203. PMID:27466174.
- Shaw KA, Bertha M, Hofmekler T, Chopra P, Vatanen T, Srivatsa A, Prince J, Kumar A, Sauer C, Zwick ME, et al. Dysbiosis, inflammation, and response to treatment: A longitudinal study of pediatric subjects with newly diagnosed inflammatory bowel disease. Genome Med. 2016;8:75. doi:10.1186/s13073-016-0331-y. PMID:27412252.
- Wills ES, Jonkers DM, Savelkoul PH, Masclee AA, Pierik MJ, Penders J. Fecal microbial composition of ulcerative colitis and crohn's disease patients in remission and subsequent exacerbation. PLoS One. 2014;9:e90981. doi:10.1371/journal.pone.0090981. PMID:24608638.
- Martinez C, Antolin M, Santos J, Torrejon A, Casellas F, Borruel N, Guarner F, Malagelada JR. Unstable composition of the fecal microbiota in ulcerative colitis during clinical remission. Am J Gastroenterol. 2008;103:643–8. doi:10.1111/j.1572-0241.2007.01592.x. PMID:18341488.
- Lupp C, Robertson ML, Wickham ME, Sekirov I, Champion OL, Gaynor EC, Finlay BB. Host-mediated inflammation disrupts the intestinal microbiota and promotes the overgrowth of enterobacteriaceae. Cell Host Microbe. 2007;2:204. doi:10.1016/j.chom.2007.08.002. PMID:18030708.
- Clarke SF, Murphy EF, O'Sullivan O, Lucey AJ, Humphreys M, Hogan A, Hayes P, O'Reilly M, Jeffery IB, Wood-Martin R, et al. Exercise and associated dietary extremes impact on gut microbial diversity. Gut. 2014;63:1913–20. doi:10.1136/gutjnl-2013-306541. PMID:25021423.
- Murtaza N, P OC, Morrison M. Diet and the microbiome. Gastroenterol Clin North Am. 2017;46:49–60. doi:10.1016/j.gtc.2016.09.005. PMID:28164852.
- O'Brien CL, Allison GE, Grimpen F, Pavli P. Impact of colonoscopy bowel preparation on intestinal microbiota. PLoS One. 2013;8:e62815. doi:10.1371/journal.pone.0062815. PMID:23650530.
- Pigneur B, Sokol H. Fecal microbiota transplantation in inflammatory bowel disease: The quest for the holy grail. Mucosal Immunol. 2016;9:1360–5. doi:10.1038/mi.2016.67. PMID:27461176.
- Li YT, Cai HF, Wang ZH, Xu J, Fang JY. Systematic review with meta-analysis: Long-term outcomes of faecal microbiota transplantation for clostridium difficile infection. Aliment Pharmacol Ther. 2016;43:445–57. doi:10.1111/apt.13492. PMID:26662643.
- Baillie JK, Arner E, Daub C, De Hoon M, Itoh M, Kawaji H, Lassmann T, Carninci P, Forrest AR, Hayashizaki Y, et al. Analysis of the human monocyte-derived macrophage transcriptome and response to lipopolysaccharide provides new insights into genetic aetiology of inflammatory bowel disease. PLoS Genet. 2017;13:e1006641. doi:10.1371/journal.pgen.1006641. PMID:28263993.
- Schloss PD, Westcott SL, Ryabin T, Hall JR, Hartmann M, Hollister EB, Lesniewski RA, Oakley BB, Parks DH, Robinson CJ, et al. Introducing mothur: Open-source, platform-independent, community-supported software for describing and comparing microbial communities. Appl Environ Microbiol. 2009;75:7537–41. doi:10.1128/AEM.01541-09. PMID:19801464.
- Schloss PD, Gevers D, Westcott SL. Reducing the effects of pcr amplification and sequencing artifacts on 16s rrna-based studies. PLoS One. 2011;6:e27310. doi:10.1371/journal.pone.0027310. PMID:22194782.
- Edgar RC, Haas BJ, Clemente JC, Quince C, Knight R. Uchime improves sensitivity and speed of chimera detection. Bioinformatics. 2011;27:2194–200. doi:10.1093/bioinformatics/btr381. PMID:21700674.
- Quast C, Pruesse E, Yilmaz P, Gerken J, Schweer T, Yarza P, Peplies J, Glockner FO. The silva ribosomal rna gene database project: Improved data processing and web-based tools. Nucleic Acids Res. 2013;41:D590–6. doi:10.1093/nar/gks1219. PMID:23193283.
- Yue JC, Clayton MK. A similarity measure based on species proportions. Communications in Statistics – Theory and Methods. 2005;34:2123–31. doi:10.1080/STA-200066418..
- R Core Team: R: A language and environment for statistical computing, 2016. [Accessed 26 October 2017]. https://www.r-project.org/.
- White JR, Nagarajan N, Pop M. Statistical methods for detecting differentially abundant features in clinical metagenomic samples. PLoS Comput Biol. 2009;5:e1000352. doi:10.1371/journal.pcbi.1000352. PMID:19360128.
- Langille MG, Zaneveld J, Caporaso JG, McDonald D, Knights D, Reyes JA, Clemente JC, Burkepile DE, Vega Thurber RL, Knight R, et al. Predictive functional profiling of microbial communities using 16s rrna marker gene sequences. Nat Biotechnol. 2013;31:814–21. doi:10.1038/nbt.2676. PMID:23975157.
- Segata N, Izard J, Waldron L, Gevers D, Miropolsky L, Garrett WS, Huttenhower C. Metagenomic biomarker discovery and explanation. Genome Biol. 2011;12:R60. doi:10.1186/gb-2011-12-6-r60. PMID:21702898.