
ABSTRACT
Aberrant immune responses against gut microbiota are thought to be key drivers of inflammatory bowel disease (IBD) pathogenesis. However, the extent and targets of immunoglobulin (Ig) A versus IgG responses to gut bacteria in IBD and its association with IBD severity is not well understood. Here, we address this by analyzing fecal samples from Crohn’s disease (CD), ulcerative colitis (UC), and Non-IBD patients by flow cytometry for the frequency of bacteria that were endogenously bound with IgA and/or IgG. Assessment of IBD patients from two geographically distinct cohorts revealed increased percentages of IgA- and IgG-bound fecal bacteria compared to non-IBD controls. Notably, the two major subsets of IBD showed distinct patterns of Ig-bound bacteria, with CD activity associated with increases in both IgA and IgG-bound bacteria, whereas UC activity correlated only with increases in IgG-bound bacteria. Analysis of the flow sorted Ig-bound bacterial repertoire by 16S rDNA sequencing revealed taxa that were Ig-bound specifically in IBD. Notably, this included bacteria that are also thought to reside in the oral pharynx, including Gemella, Peptostreptococcus, and Streptococcus species. These data show that the pattern of IgA and IgG binding to fecal bacteria is distinct in UC and CD. In addition, the frequency of Ig-bound fecal bacteria may have potential as a non-invasive biomarker for disease activity. Finally, our results support the hypothesis that immune responses to oral pharyngeal bacteria may play an important role in the pathogenesis of IBD.
Introduction
Inappropriate immune responses against commensal bacteria are thought to contribute to the pathogenesis of inflammatory bowel disease (IBD).Citation1,Citation2 However, our understanding of the extent of the immune response to gut bacteria in IBD is incomplete.Citation3 Immunoglobulin A (IgA) is abundantly secreted into the gastrointestinal tract and has been proposed to target gut bacteria.Citation4–Citation9 To evaluate if IgA targets specific bacteria in situ, we and others have combined flow-cytometric sorting with 16S rDNA sequencing.Citation7,Citation8 Using this approach, it was reported that IBD patients demonstrated increased targeting of fecal bacteria by host IgA.Citation5,Citation7 and IgG.Citation5 with a potential difference in active and inactive IBD patients.Citation5 In addition, IgA-tagged microbes from human patients with IBD or malnutrition were more pathogenic than non-tagged microbes when transferred into germ-free mice.Citation7,Citation8 Thus, the specificity of IgA may be useful to identify the bacterial taxa that elicit adaptive immune responses and contribute to disease pathogenesis.
However, a number of questions remain regarding the Ig-targeting of commensal bacteria in IBD. First, there are major differences in the disease pathology in IBD subsets, Crohn’s disease (CD) and Ulcerative colitis (UC), but it remains unclear whether they exhibit differences in their pattern of IgA and IgG-binding to fecal bacteria. Second, IBD is a relapsing and remitting inflammatory disorder, yet it remains unknown whether the IgA- or IgG-bound bacteria vary with disease activity. Last, IgG-targeted bacteria represent a large proportion of the total immunoglobulin responses against bacteria in IBD patients, but the bacterial taxa bound by IgG in the gut remain unknown.
We addressed these questions using bacterial FACS on IBD fecal specimens from two different patient cohorts. Our data also reveal distinct differences between CD and UC in the percentage of IgA- and IgG-bound bacteria with disease activity, as well as the taxa of bacteria targeted by Ig. Although future studies are required, these data suggest that flow cytometry of fecal Ig-bound bacteria may provide insight into the bacteria involved in IBD pathogenesis and may have potential as a useful biomarker for the assessment of IBD disease activity.
Results
IBD patients demonstrate increased ig-bound bacteria
To investigate whether IBD subjects display exaggerated Ig responses against commensal bacteria surface antigens, we analyzed using flow cytometry () frozen fecal specimens from 30 CD, 14 UC and 30 Non-IBD subjects from St. Louis (STL) (). This study was powered to detect a 0.5 effect size in the frequency of Ig binding (ANOVA 3 groups) based on previously reported results for IgA in IBD,Citation7 which had a smaller sample size for CD and UC patients. We also analyzed 3 CD, 11 UC and 9 Non-IBD subjects from Cambridge (CBG, ) to provide independent, albeit limited, supplemental data. The technique was reproducible, as flow cytometry performed on the same sample on different days did not show significant difference (Fig. S1A). In both cohorts, UC and CD subjects showed significantly higher frequencies of IgA-bound fecal bacteria compared with Non-IBD subjects (, Fig. S1B), consistent with previous studies.Citation5,Citation7 IgG-bound fecal bacteria were detected only in UC and CD, but not Non-IBD, subjects (, S1C). Although Ig-binding was still enhanced in the IBD vs Non-IBD patients in the CBG cohort, the range of Ig+ bacteria was lower as compared to STL, possibly due to geographic or patient cohort differences (). Nonetheless, the increase in Ig+ fecal bacteria in two different geographic locations implies that variables associated with diet and environment are not essential to observe increased percentages of intestinal bacteria bound to IgA and IgG in IBD patients.
Table 1. Subject demographics and treatment information.
Figure 1. Increased Ig-bound fecal bacteria in IBD patients.
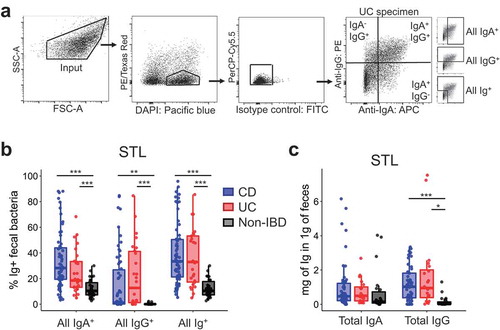
One potential explanation for the increased percentage of IgA- or IgG-bound bacteria would be an overall increase of Ig in the feces. To assess this, we measured the concentration of free-fecal IgA/IgG by ELISA and observed that free-fecal IgG was significantly increased in UC and CD subjects (), suggesting that the entry of IgG into the intestinal lumen, perhaps via barrier breach, may be an important factor leading to IgG-bound bacteria. By contrast, free-fecal IgA was not significantly different (), consistent with a previous reportCitation10 Thus, while the increased percentage of IgG-bound bacteria in IBD could be explained by an overall increase in IgG in the feces, that was not the case for IgA-bound bacteria.
Percentage of iga+ and igg+ fecal bacteria correlate with CD activity
As the range of Ig-bound bacterial frequencies in IBD overlapped with that in Non-IBD subjects, we asked whether disease activity correlated with the Ig-bound bacterial percentage. We assessed CD and UC separately as they elicit distinct histological pathology and affect different regions of the gut. For CD, we observed a significant association between the percentage of all IgA- and IgG-bound fecal bacteria and disease activity by three disease activity scores, CDAI, HBI, and SIBDQ (, S2). This analysis was performed only for STL subjects as the CBG CD cohort was small. Notably, there was no clear correlation between free fecal IgA or IgG and % of Ig bound bacteria (), implying that increased bacteria-specific Ig, rather than the amount of fecal antibody, lead to the increased percentage of Ig-bound bacteria with CD flare.
Figure 2. Percentage of IgA+ and IgG+ fecal bacteria correlate with CD activity.
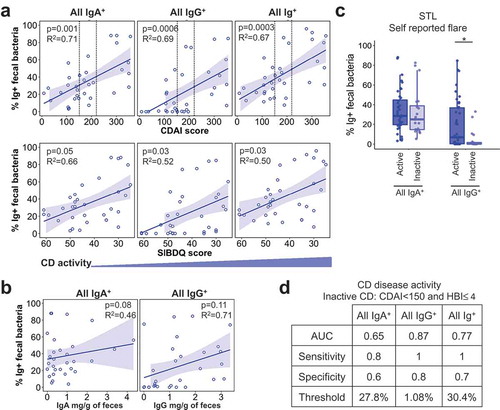
We also observed similar relationships between IgA- and IgG-bound bacteria with certain laboratory markers of inflammation (Fig. S2). Overall, IgG-bound bacteria as compared to IgA-bound bacteria displayed better correlations with both disease activity indices and laboratory markers. Consistent with this, patient self-reported flare tracked with IgG-, but not IgA-, bound bacteria (; STL), which may reflect the patient perception of mucosal injury and bleeding into the stool. Moreover, the percentage of IgG+ bacteria to predict dichotomous CD disease activity (active vs inactive defined by CDAI <150 & HBI ≤4) exhibited the highest area under the curve (AUC), which is a measure of separability of the test (). Together, these data show that increased Ig-bound fecal bacterial frequencies correlate with higher disease activity and suggest that flow cytometry of fecal bacterial may be a useful biomarker for assessing disease activity in previously diagnosed CD patients.
Only IgG+ fecal bacterial percentage correlates with UC activity
We then asked whether disease activity in UC also affected Ig-bound bacteria. Similar to CD, we observed a significant positive correlation of all IgG+ and Ig+ bacteria percentage with UC disease activity in STL patients based on quantitative measures such as partial Mayo, SIBDQ, and Physician’s Global Assessment (, S3A). Laboratory markers like ESR, CRP, and % of basophils displayed similar correlations (Fig. S3A). The association of IgG+ bacteria with active UC was also seen with physician’s assessments in CBG (Fig. S3B-C). In contrast to CD, however, the percentage of all IgA-bound bacteria was not positively correlated with UC disease activity (, S3A).
Figure 3. Only IgG+ fecal bacteria percentage correlates with UC activity.
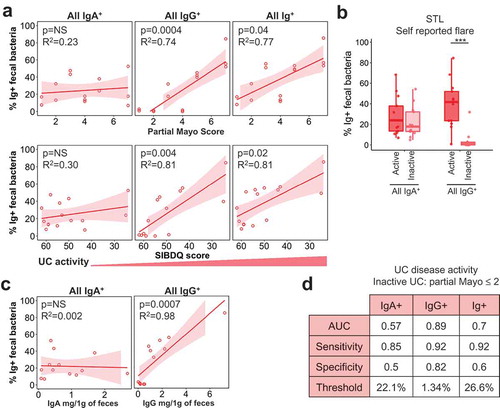
Similar to CD, there was no relationship between IgA-bound percentage vs. free fecal IgA in UC (, ). In contrast to CD, UC patients show a stronger positive correlation between IgG-bound bacteria and free fecal IgG (, ). This suggests that the degree of IgG entry into the lumen, presumably via barrier breach, has a more direct impact on the percentage of IgG-bound bacteria in UC. As expected based on these findings, a performance test for UC disease activity based on partial Mayo cutoffs (STL) or physician’s reporting (CBG), yielded poor predictive power of IgA+ bacteria in discerning between active vs. inactive UC (). By contrast, IgG+ bacteria showed diagnostic potential in discriminating between active vs. inactive UC at a threshold of 1.3% of fecal bacteria bound to IgG (). Thus, this analysis shows a notable difference between the IBD subsets: CD activity is reflected in IgA and IgG binding to bacteria, whereas UC activity appears to be defined primarily by IgG.
The Ig-bound and unbound bacterial repertoire are different
Although this study was not powered with a goal to identify Ig-bound bacteria in IBD, we analyzed the microbiota using 16S rDNA sequencing to determine whether we could detect changes in our limited sample set, which may be informative for future studies. First, we sequenced 16S rDNA from sorted events found in the forward and side scatter gates (FSC and SSC; ) to assess microbial alpha and beta diversity. In both cohorts, UC or CD specimens displayed significantly lower alpha diversity using Chao1 (species richness) and Shannon (species richness and abundance) indices (Fig. S4A) in comparison with Non-IBD specimens, consistent with previous IBD studies using direct DNA extraction of fecal specimens.Citation11–Citation13 Beta diversity, or community differences, using the Unifrac metric was also different between the three disease groups by PCoA plots (Fig. S4B). Consistent with this, many OTUs displayed significant differences in overall percentage (Fig. S4C). Thus, 16S rDNA analysis of FACS-sorted bacteria from both cohorts showed characteristic features of microbial dysbiosis previously reported in IBD patients.
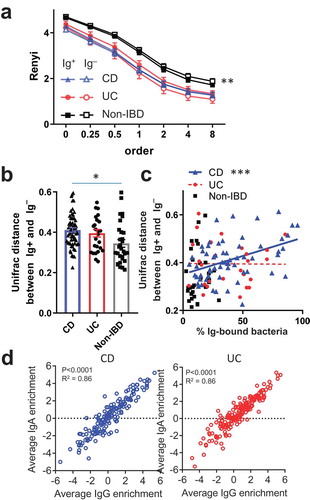
We next investigated if there were broad differences between the sorted Ig bound vs unbound bacterial populations. Notably, assessment of alpha diversity in STL patients using Renyi entropy, which includes Shannon diversity as order 1, did not reveal significant differences between the Ig+ and Ig – fractions from a given disease group (). This suggested that there was no marked difference in species richness or evenness with Ig binding, which may be explained by the recent observation that many anti-bacterial IgA antibodies are polyreactive,Citation14 potentially leading to considerable overlap in the Ig-bound and unbound microbiota. Although the Ig-bound and unbound fractions appeared to be of similar alpha-diversity, phylogenetic beta diversity at the operational taxonomic unit (OTU) level defined by >97% sequence identity, using the Unifrac metric between paired Ig-bound and unbound fractions from each specimen, was significantly different in each group (PERMANOVA p < .001 for CD, UC and Non-IBD). In addition, the Unifrac distance between Ig-bound and unbound bacteria for each sample was higher in CD vs Non-IBD and trended higher for UC vs Non-IBD patients (, p < .01, 0.08; respectively). For CD but not UC, the frequency of Ig-bound bacteria positively correlated with the Unifrac distance between Ig-bound and unbound bacterial repertoires (), revealing another difference between these IBD subtypes. Thus, these data are consistent with previous studies in miceCitation15 and humans.Citation8 showing differences between the Ig-bound and unbound bacterial repertoire during homeostasis, which is increased during IBD consistent with heightened adaptive immune response against gut bacteria.
Figure 4. Characteristics of IgA and IgG-bound commensal bacteria.
Strong correlation of IgA- and IgG-bound bacteria
To assess the enrichment of specific taxa in the IgA- or IgG-bound fraction, we calculated a log2 ratio of the frequency of the taxa in the Ig-bound over unbound fraction, with positive values indicating a greater presence in the Ig-bound fraction, and a value of “0” indicating the equal presence in Ig-bound and unbound fractions. Log2 ratios were arbitrarily capped at ~5.6 (49 fold change) to limit the effects of small or zero values in the numerator or denominator. We first assessed whether there is a relationship between the overall percentage for a given bacterial OTU in the sort input fraction and its enrichment in the Ig-bound fraction. Linear regression analysis between overall OTU percentage and all Ig+-enrichment for each disease subgroup revealed no consistent relationship with only a few OTUs with significant negative or positive slopes (Fig. S5A). Thus, Ig-enrichment is not, as a general rule, related to the relative frequency of the OTU.
Next, we wondered if IgA and IgG displayed preferential binding to OTUs since we observed differences in the frequencies of Ig-bound subsets by FACS in IBD subjects (, S1B). We did find OTUs that showed preferential binding by IgA or IgG in CD and UC (Fig. S5B). For example, Akkermansia and E. coli tend to be enriched in the IgA+ fractions (IgG+ or –), and Streptococcus species were enriched primarily in the IgG+ fractions (IgA+ or –). These findings suggest that the bacteria are targeted by both IgA and IgG but that one of the Ig classes may be limiting. There were also two OTUs in CD and two others in UC that were preferentially bound to the IgA–IgG+ fraction, suggesting that they triggered primarily an IgG response. While the differential Ig-binding of these OTUs corroborates the notion that CD and UC can elicit distinct mucosal immune responses to specific taxa, Pearson’s correlations between IgA and IgG enrichment indices in CD or UC subjects revealed that most OTUs displayed a similar enrichment index (). For this reason, we focused on the Ig+ fraction (IgA+ and/or IgG+) for the remainder of our analysis, as our data suggest that in general, IgG, if present, tends to bind similar bacteria as IgA in both UC and CD.
Streptococcus spp. are Ig+ enriched in IBD compared with non-IBD patients
As the determination of OTUs that are preferentially Ig-bound is not well established in the literature, we utilized several methods (). One approach has been to identify the set of OTUs that are differentially bound to Ig (Ig enriched OTUs).Citation7 We obtained the set of OTUs that were differentially found between the Ig-bound and unbound fractions in at least one patient group using lefSE,Citation16 as well as DESeq2 to analyze count data between Ig+ and Ig – fractions using the negative binomial model.Citation17,Citation18 (, S5C; S5D for STL+CBG data). A number of OTUs were identified as significant (or important) in only one statistical approach (Fig. S5C). For example, DESeq2 only identified one OTU (Escherichia/Shigella coli) as statistically significant in UC (STL) patients, whereas six OTUs were Ig-enriched using lefSE. As the statistical models differed, we utilized the intersection between these sets of OTUs to improve the selectivity of this Ig enriched OTU set (). We first noticed that there were five OTUs that were identified as Ig enriched in both IBD and non-IBD patients (bottom OTUs on ; and ), consistent with previous reports.Citation7,Citation8,Citation19 These OTUs were not statistically Ig enriched in all patient groups by both lefSE and DESeq2, in part due to different sample sizes. Nonetheless, these data suggest that OTUs in the Clostridium, Ruminococcus, Lachnospiraceae, and Escherichia genera trigger an Ig response in both healthy individuals and IBD patients ().
Figure 5. Taxa of Ig-enriched bacteria in IBD are often associated with oral pharynx.
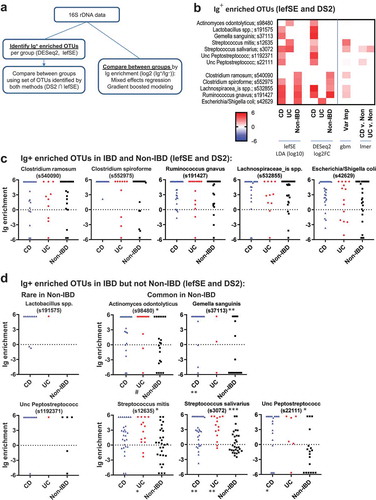
We then asked if we could detect taxa that are uniquely Ig-bound in CD or UC as compared to healthy individuals. Seven OTUs were identified by DESeq2 or lefSE as Ig enriched in IBD but not Non-IBD patients (, D). Two of these OTUs (Lactobacillus and Unc Peptostreptococcus) appeared to be primarily found in CD patients and infrequently in UC and Non-IBD patients, suggesting that these bacteria expand with dysbiosis in CD and are subsequently targeted by the immune system. We observed another group of bacteria which were common to both IBD and Non-IBD patients but were Ig enriched primarily in IBD (). These included Actinomyces, Gemella, two Streptococcus, and an Unc Peptostreptococcus OTUs that were enriched in IBD vs Non-IBD STL patients (; S5D for STL+CBG). Unexpectedly, these OTUs all encompass taxa that can be found in the oral pharynx.Citation20,Citation21
The algorithm used above to select OTUs was UPARSE, which clusters related sequences and improves statistical power. However, closely related but non-identical 16S sequences may differ for Ig-bound and unbound bacteria and be clustered into one OTU. We, therefore, used dada2Citation22 to identify amplicon sequence variants without clustering. This increased the number of OTUs which would result in loss of power with fdr correction. For example, the number of Streptococcus OTUs increased from 3 to 10 using dada2. Of the three dada2 OTUs found in >20% of patients (Fig. S5E), S. salivarius was still differentially Ig-bound in IBD patients. However, S. mitis (s12635) showed decreased bias to be Ig-bound with IBD vs. Non-IBD, whereas a new OTU, S. australis showed a preference to being IBD bound. Thus, the dada2 analysis confirmed that specific Streptococcus OTUs are Ig-enriched in IBD.
An alternative approach to identifying a set of Ig enriched OTUs is to compare directly between groups using Ig enrichment data (log2 (Ig+/Ig–)).Citation7 Using mixed effects modeling, there were several OTUs with a Benjamini-Hochberg adjusted p < .25 that demonstrated higher Ig-targeting in IBD specimens when comparing CD vs. Non-IBD and UC vs. Non-IBD specimens (Fig. S6). S. salivarius and the Unc Peptostreptococcus OTU was Ig enriched in IBD vs Non-IBD, corroborating the results from lefSE/DESeq2 above (). Streptococcus salivarius was the only Ig-enriched OTU that was identified for both CD and UC (both cohorts). OTUs with the same genus, but not species designations have been previously identified as uniquely targeted by IgA in IBD patients.Citation7 Notably, all OTUs except Dialister invisus in the STL UC cohort were either not different in overall percentage or in some cases more frequent in Non-IBD fecal specimens as compared to UC or CD (Fig. S6), suggesting that increased percentage of an OTU due to dysbiosis during IBD does not typically explain increased Ig-targeting.
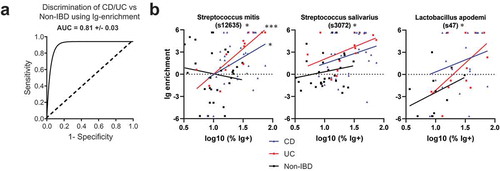
Finally, we tested the ability of the combined cohort Ig-enrichment data to predict IBD by performing Gradient Boosted Modelling (GBM), a machine learning algorithm which may utilize interactions between OTUs to improve discrimination between CD, UC, and Non-IBD patients. The model was trained with 75% of the dataset and tested with the remaining 25%. This revealed an average AUC of 81% in correctly identifying the right patient group (CD, UC, or Non-IBD) (). Assessment of the variables important for classification revealed a number of OTUs that were previously identified to be Ig-enriched by lefSE or DESeq2 (, S5C). Notably, two of these include the two Streptococcus and one Peptostreptococcus OTUs that are preferentially Ig-bound with IBD. Thus, gbm analysis supports the notion that IBD alters the bacterial repertoire that is Ig-bound and implicates a greater potential role for Streptococcus spp. in the immune response during IBD than previously reported.
Figure 6. Bacterial OTUs enriched in IBD.
Ig-enrichment of specific OTUs correlates with frequency of ig-bound bacteria
To determine whether OTUs were preferentially Ig-enriched during active CD or UC, we performed correlations with various disease activity scores obtained for a subset of specimens in the STL cohort. Notably, the OTUs identified previously to be Ig-enriched in CD or UC often did not vary in Ig-binding with disease activity (Fig. S7A-B). Ig-binding to S. salivarius in UC, but not CD, may be associated with disease activity, but the number of UC patients with S. salivarius and a disease activity score was small. We did identify OTUs such as Lactobacillus apodemi that became more Ig-targeted with increased CD disease activity (Fig. S7C). These OTUs were not originally detected in our CD vs Non-IBD analysis likely because of the range of Ig-enrichments in CD overlapped with the Non-IBD patients. Other OTUs were identified that became less Ig-bound with increasing disease activity (Fig. S7D). While we were able to identify some changes in Ig-binding with disease activity, the loss of power related to the number of patients with a quantified disease activity that also had a specific bacteria made this assessment difficult. We therefore asked whether Ig-binding of specific OTUs correlated with the log % of Ig+ bacteria as a surrogate for “immune activity in the gut.” Using data from all patients, three OTUs were significantly correlated (; padj <0.1), including the two Streptococcus OTUs discussed above, as well as Lactobacillus apodemi noted above (Fig. S7C). Thus, these data suggest that increases in immune activity in the gut based in Ig-bound bacteria do correlate with specific response to certain bacteria, particularly Streptococcal spp.
Discussion
In this study, we utilized bacterial FACS to study host:commensal interactions in IBD. We make the following observations: First, IBD patients have heightened adaptive immune responses against commensal bacteria as evidenced by increased IgA- and IgG-bound bacterial frequencies compared with non-IBD individuals. Second, the percentage of fecal bacteria bound by Ig is directly correlated with IBD disease activity, although IgA-bound frequency correlates only with CD, but not UC, disease activity. Third, specific taxa such as Streptococcus show increased Ig-targeting in IBD compared with non-IBD patients and is correlated with the extent of the Ig response. Many of these findings were validated in two geographically separate cohorts. Thus, our findings support the hypothesis that mucosal immune tolerance to commensal bacteria is altered in IBD patients and suggest that flow cytometric analysis of fecal bacteria has potential utility for aiding the management of IBD.
Our data support the notion that adaptive immune responses against commensal bacteria are increased in IBD. Consistent with previous studies, we found that the percentage of IgA+ bacteria was increased in IBD patients.Citation7 As this occurs without a corresponding increase in free fecal IgA, this implies that the fraction of bacteria-specific IgA increases in human IBD patients, a phenomenon that has previously been described in miceCitation23 In addition, we show that the IgG subset of immunoglobulin is also frequently bound to commensal bacteria in IBD patients. Notably, there were distinct differences in IgA and IgG binding to bacteria. Unlike IgA, IgG-bound bacteria are not found in healthy subjects. Moreover, the increased percentage of IgG+ bacteria is correlated with increased free fecal IgG in the intestinal lumen, whereby mucosal barrier breach might be an important mechanism leading to IgG, but not IgA-bound, bacteria. Thus, these data suggest that enhanced adaptive immune responses to commensal bacteria by both IgA and IgG are important characteristics of IBD.
Interestingly, the subtypes of IBD exhibit different patterns of Ig-bound bacteria. CD patients show increases in both IgA- and IgG-bound commensal bacteria with more severe disease, whereas UC patients show only IgG-bound bacteria. In addition, CD and UC show different patterns of IgA and IgG binding by flow cytometry, with UC often more dominated by IgG+IgA – tagged bacteria. We speculate that differences in the anatomic sites of gut inflammation and histopathology between CD and UC account for the changes in the Ig-binding data. While future studies are required to understand the mechanistic basis for this observation, these data demonstrate that IBD subsets have distinct patterns of IgA and IgG responses to commensal bacteria.
These data also suggest that Ig-bound bacteria may be useful biomarkers for disease activity. Because of the differences in Ig-binding between UC and CD, the Ig-bound bacteria will likely need to be used in an IBD subset specific context. For example, the percentage of IgA-bound bacteria may be useful for monitoring CD as it strongly correlates with multiple clinical indexes of disease activity, whereas high IgA-bound bacterial frequencies in UC may indicate the disease state, but not activity. Notably, the presence of IgG-bound bacteria is strongly associated with patient perception of disease flare, particularly in UC, and may be useful in patients that under-report disease activity. Although future studies are required to correlate Ig-bound bacteria with histology on biopsy, the gold-standard assessment, these data suggest that Ig-bound fecal bacteria detectable by flow cytometry has the potential to be clinically useful as a surrogate biomarker for IBD disease activity.
In addition to the patterns of Ig-binding to bacteria, we analyzed the bacterial taxa bound to IgA or IgG during IBD. Although our sample size was in the range of the previous studies,Citation7 we were not powered to robustly identify all the bacterial taxa that are Ig-bound in IBD as many taxa are not found in all patients. The previous study identified dozens of OTUs specific to IBD, but this may be without fdr correction. Techniques such as analysis of higher taxonomic levels commonly used in microbiome studies to decrease the effects of fdr correction were not particularly useful as Ig-binding could differ at the OTU levels. Despite these limitations, our data unexpectedly suggest that taxa often found also in the oral pharynx such as Gemella, Peptostreptococcus, and Streptococcus, are clearly targets of the immune response during IBD. While Streptococcus was identified as preferentially IgA-bound previously,Citation7 our cohorts appear to contain Streptococcus in a much higher fraction of patients, being found in over 80% of patients. Contrary to other studies,Citation24 we did not see a marked increase in Streptococcus frequency with IBD. Our data, therefore, suggest that the increase in Ig binding to Streptococcus is not related to the appearance of the bacteria with dysbiosis, but likely reflects the induction of an antigen-specific response during IBD. Notably, Streptococcus spp was predominant in the inflamed mucosa of CD patients in one study.Citation25 and was often found in intra-abdominal abscesses in perforating Crohn’s diseaseCitation26 In addition to gastrointestinal sites of immune encounter, oral pharyngeal dysbiosis of Streptococcus and PeptostreptococcusCitation20 may also trigger an immune response. A prominent role for oral pharyngeal bacterial is notable in the context of a recent report suggesting that oral Klebsiella may be involved in IBDCitation27 Although we did not observe Ig-bound Klebsiella in our study, these data together suggest that immune interactions with oral bacteria may play an important role for IBD pathogenesis.
A pathogenic role for Streptococcus, however, has not been clearly defined. The Palm study included a Streptococcus species but was lost from the consortium in germ-free mice.Citation7 In fact, other studies have suggested that Streptococcus can act as a probiotic that inhibit, rather than promote, colitis in murine models.Citation28 This observation may be consistent with the observation that Streptococcus does not readily elicit an Ig response in Non-IBD patients. However, the use of human isolates in miceCitation29,Citation30 as well as bacterial strain differences may account for these observations. Whole genomic sequencing of cultured isolates or metagenomic sequencing of Ig bound fractions may be useful to determine whether IBD patients harbor unique strains of Streptococcus that may facilitate immune recognition and disease pathogenesis. Future studies are therefore required to determine whether the immune response to Streptococcus or other bacteria also found in the oral pharynx simply represent a marker for the breakage of tolerance to gut commensals, vs an etiopathogenic role for these species in IBD.
Materials and methods
Cohort descriptions
Written informed consent was obtained from all study participants prior to inclusion in the study. Both clinical groups collected detailed health information on all recruited subjects. On a subset of STL subjects, disease activity indices (CDAI, SIBDQ, HBI for CD; partial Mayo score, physician’s global assessment, SIBDQ for UC) and serological test results were collected within four days of the associated fecal specimen. Averages for disease activity scores and subtypes of CD and UC patients based on Montreal behavior and location are detailed in Table S1. CBG IBD stool samples were designated active or inactive based on the physician’s assessment often corroborated by the evidence of raised inflammatory markers or endoscopic inflammation. Non-IBD samples were from unrelated donors, except for two CD and seven UC patients of the CBG cohort, in which samples from Non-IBD 1st degree relatives were collected within 5 days of the fecal sample collection from the IBD-household member. Detailed metadata for all specimens are detailed in Supplementary File 1.
Subjects with any other gastrointestinal diagnosis or an intestinal resection were excluded from the study. Non-IBD subjects were verified to have no gastrointestinal disease diagnoses through patient survey and medical records. There were statistically significant differences in BMI and race in the STL, but not CBG, subjects. The distribution of age and sex in both cohorts was not statistically different. Disease activity score and disease subtype information is summarized in Table S1. Longitudinal sampling was performed for several subjects (see Supplementary File 1 for characteristics and medications at the time of each fecal specimen). All specimens were analyzed with correction for random effects of each subject through mixed effects regression modeling.Citation31,Citation32
Bacterial FACS
A ~20 mg chip of stool was obtained from a stool aliquot stored at −80°C. The sample was weighed and dissolved in PBS at 25mg/ml by vortexing and sonication. After centrifugation, the supernatant was frozen for total IgA or IgG ELISA measurements for some samples. Spun down fecal material was suspended in 5mM N-acetyl-cysteine to break disulfide bonds in mucus and release bacterial cells. After two washes, the material was filtered through a 70μm filter and suspended in 20% FBS as a blocking reagent for 20 min. Samples were stained in 100 μl of 1:500 DAPI, 1:100 goat IgG FITC – Isotype control for anti-IgA and IgG antibodies (Abcam 37374), goat anti-human IgA Dylight 650 (Abcam 98556) and goat anti-human IgG PE (Abcam 98596) for 30 min on ice, washed, and filtered through a 35 µm filter. Samples were analyzed by flow cytometry (FACSAria IIu; Fig. S1A). For each sample, 30,000 events in the input, and Ig-bound and unbound fractions were FACS purified and concentrated to 5,000 events/µl of sheath fluid for 16S analysis. Sort-purity for Ig-tagged bacteria was generally between 65% and 70%. To decrease contamination, ethanol was run through the cytometer during fluidics shutdown, and autoclaved PBS was used as sheath fluid.
16S rDNA analysis
A PCR reaction was set up in triplicate using 2ul of concentrated bacteria each to amplify bacterial V4 hypervariable region of 16S rDNA using barcoded primers described previouslyCitation33 Sheath fluid was also sorted and sequenced separately to identify contaminant OTUs. Pooled PCR products were sequenced using the Illumina MiSeq platform (2 x 250-bp paired-end reads). OTU picking was performed using UPARSE (usearch v9, radius = 3%)Citation34 based on a calculated OTU frequency that combines the sequencing data from the FACS-sorted subsets at by the proportions indicated by flow cytometry. Dada2 v1.8Citation22 was used to identify amplicon sequence variants of Streptococcus as noted in the text. OTU taxonomy was based on species designations with >97% confidence using Seqmatch, or from the Ribosomal Database Project (RDP v2.6)Citation35 classifier using default settings. The input sort fraction was used to calculate overall OTU percentages in each specimen.
All metrics for alpha diversity based on sequences rarefied to 3000 reads were calculated in QIIME and tests for significance were performed via mixed effects testing using the R package, lme4 (v1.1–14).Citation31 Beta diversity was calculated through phyloseq (v1.19.1)Citation18 in R after rarefaction and pruning to remove OTUs that were present in three or less fecal specimens. After calculation of an unweighted unifrac distance matrix, significance was calculated using the adonis call in the vegan R package (v2.4–4),Citation36 with pairing either by Ig-subset or by same patient, as indicated.
Analysis of Ig-enriched taxa
Differential Ig-enrichment of a particular taxa is calculated as Log2 (Frequency of taxa in Ig+ fraction/Frequency of taxa in Ig – fraction). Ig-enrichment indices were arbitrarily capped at 5.61 (= log2 (ratio of 49)) for taxa that were only present in the Ig+ fraction and absent in the Ig – fraction, and −5.61 for taxa that were only present in the Ig− fraction. We did not use the alternative approach to add a small fraction to the numerator and denominator to address the issue of division by zero in the ratio calculation, as we wished to use “NA” to indicate taxa that were entirely absent in a fecal specimen. To account for sequencing errors and imperfect bacterial sorting purity, for OTUs with total frequency of less than 1/5000 counts, no Ig-enrichment index was calculated. When comparing CD and UC Ig-enrichment OTU data to non-IBD individuals, all OTUs that were present in less than four fecal specimens were discarded to find generalizable trends. This log2 ratio was arbitrarily capped at ± 5.61 (49 fold change) to limit the impact of values with a small denominator. As the composition of fecal microbiota can markedly differ between individuals, Ig-enrichment was left as an “NA” (not available) value for taxa absent in specimen. We did not use a 0 or an imputed value to resolve “NA” values, as it could bias towards similarity/difference and have variable effects on the analysis depending on the number of subjects which do not have those OTUs. We, therefore, probed the 16S rDNA data using methods more accepting of absent values (“NA”s) such as mixed effects testing, correlational analysis, and gradient boosted modeling. Gradient boosted models for Ig-enrichment data were trained with 75% of the fecal specimens and tested against the remaining 25% of the fecal specimens for all Ig enrichment data filtered as above, using the R packages gbm (v2.1.3) and caret (v6.0–77).Citation37 ROC curves and all associated information including AUC, sensitivity and specificity were calculated using the R package, pROC (v 1.10.0).Citation38
For identification of Ig-enriched OTUs, DESeq2 (v1.20)Citation17 was used to analyze Ig+ vs Ig – count data from STL (1st sample per patient) for CD, UC, or Non-IBD using sfType = “poscounts” to estimate dispersions. lefSECitation39 was also used to identify OTUs important in distinguishing between Ig+ or Ig – fractions.
Free fecal Ig ELISA
IgG and IgA ELISA of fecal supernatant were performed in 96 well plates using the following antibodies and concentrations. Coating antibody: 1 μg/ml goat anti-human kappa (Southern Biotech (SB) 2061–01) for both IgA and IgG. IgA standard: SB 0155K-01 and IgG standard: SB 0150–01. Secondary antibody: 2 μg/ml peroxidase-conjugated anti-human IgA (Jackson ImmunoResearch 109–035-011) or anti-human IgG (H + L) (Jackson ImmunoResearch 109–035-088). Fecal Ig ELISAs were performed only on STL samples as CBG samples were available in limited quantities.
Statistics
Since we collected more than one stool sample from certain subjects, we performed a mixed effects regression analysis using lme4 in RCitation40 andCitation31 of the relationship between disease subgroup and various outcome measures (% of Ig+ bacteria, Ig enrichment, Chao1, beta diversity and most measures in the paper unless specified otherwise). As random effects, we had intercepts for subjects and as fixed effects, we had disease subgroups (UC vs. CD vs. Non-IBD, etc). P-values were obtained by maximum likelihood t-tests of the full model with the effect in question based on Satterthwaite’s approximations. In situations where a mixed-effects model could not be generated, a generalized linear model (GLM), Mann-Whitney U or Kruskal Wallis testing was performed in R. FDR corrections using Benjamini-Hochberg procedure for all data were performed using the base stats package in R. Plots were generated using R package, ggplot2 (v2.2.1)Citation41 and Prism version 7.00 or 8.00 for Windows (GraphPad Software, La Jolla, California USA).
Patient Anonymity and Informed Consent
Stool specimens were collected with informed consent under institutional review board compliance at Washington University in St. Louis, St. Louis, USA and Addenbrooke’s Hospital, University of Cambridge, UK.
Supplemental Material
Download Zip (6.8 MB)Disclosure statement
No conflicts of interest to report.
Supplementary material
Supplemental data for this article can be accessed on the publisher’s website.
Additional information
Funding
References
- Maloy KJ, Powrie F. Intestinal homeostasis and its breakdown in inflammatory bowel disease. Nature. 2011;474(7351):298–306. doi:10.1038/nature10208.
- Alexander KL, Targan SR; Elson 3rd CO. Microbiota activation and regulation of innate and adaptive immunity. Immunol Rev. 2014;260(1):206–220. doi:10.1111/imr.12180.
- Qin J, Li R, Raes J, Arumugam M, Burgdorf KS, Manichanh C, Nielsen T, Pons N, Levenez F, Yamada T, et al. A human gut microbial gene catalogue established by metagenomic sequencing : article : nature. Nature. 2010;464(7285):59–65. doi:10.1038/nature08821.
- Macpherson A, Khoo UY, Forgacs I, Philpott-Howard J, Bjarnason I. Mucosal antibodies in inflammatory bowel disease are directed against intestinal bacteria. Gut. 1996;38(3):365–375. doi:10.1136/gut.38.3.365.
- van der Waaij LA, Kroese FGM, Visser A, Nelis GF, Westerveld BD, Jansen PLM, Hunter JO. Immunoglobulin coating of faecal bacteria in inflammatory bowel disease. Eur J Gastroenterol Hepatol. 2004;16(7):669–674. doi:10.1097/01.meg.0000108346.41221.19.
- Peterson DA, McNulty NP, Guruge JL, Gordon JI. IgA response to symbiotic bacteria as a mediator of gut homeostasis. Cell Host Microbe. 2007;2(5):328–339. doi:10.1016/j.chom.2007.09.013.
- Palm NW, de Zoete MR, Cullen TW, Barry NA, Stefanowski J, Hao L, Degnan PH, Hu J, Peter I, Zhang W, et al. Immunoglobulin A coating identifies colitogenic bacteria in inflammatory bowel disease. Cell. 2014;158(5):1000–1010. doi:10.1016/j.cell.2014.08.006.
- Kau AL, Planer JD, Liu J, Rao S, Yatsunenko T, Trehan I, Manary MJ, Liu T-C, Stappenbeck TS, Maleta KM, et al. Functional characterization of IgA-targeted bacterial taxa from undernourished Malawian children that produce diet-dependent enteropathy. Sci Transl Med. 2015;7(276):276ra24. doi:10.1126/scitranslmed.aaa4877.
- Bunker JJ, Flynn TM, Koval JC, Shaw DG, Meisel M, McDonald BD, Ishizuka IE, Dent AL, Wilson PC, Jabri B, et al. Innate and adaptive humoral responses coat distinct commensal bacteria with immunoglobulin A. Immunity. 2015;43(3):541–553. doi:10.1016/j.immuni.2015.08.007.
- Jansen A, Mandić AD, Bennek E, Frehn L, Verdier J, Tebrügge I, Lutz H, Streetz K, Trautwein C, Sellge G. Anti-food and anti-microbial IgG subclass antibodies in inflammatory bowel disease. Scand J Gastroenterol. 2016;5521:(August):1–9. doi:10.1080/00365521.2016.1205130.
- Frank DN, St Amand AL, Feldman RA, Boedeker EC, Harpaz N, Pace NR. Molecular-phylogenetic characterization of microbial community imbalances in human inflammatory bowel diseases. Proc Natl Acad Sci U S A. 2007;104(34):13780–13785. doi:10.1073/pnas.0706625104.
- Frank DN, Robertson CE, Hamm CM, Kpadeh Z, Zhang T, Chen H, Zhu W, Sartor RB, Boedeker EC, Harpaz N, et al. Disease phenotype and genotype are associated with shifts in intestinal-associated microbiota in inflammatory bowel diseases. Inflamm Bowel Dis. 2011;17(1):179–184. doi:10.1002/ibd.21339.
- Gevers D, Kugathasan S, Denson LA, zquez-Baeza Y, Van Treuren W, Ren B, Schwager E, Knights D, Sj S, Yassour M, et al. The treatment-naive microbiome in new-onset Crohn’s disease. Cell Host Microbe. 2014;15(3):382–392. doi:10.1016/j.chom.2014.02.005.
- Bunker JJ, Erickson SA, Flynn TM, Henry C, Koval JC, Meisel M, Jabri B, Antonopoulos DA, Wilson PC, Bendelac A. Natural polyreactive IgA antibodies coat the intestinal microbiota. Science. 2017;358(6361):eaan6619. doi:10.1126/science.aan6619.
- Kubinak JL, Petersen C, Stephens WZ, Soto R, Bake E, O’Connell RM, Round JL. MyD88 signaling in T cells directs IgA-mediated control of the microbiota to promote health. Cell Host Microbe. 2015;17(2):153–163. doi:10.1016/j.chom.2014.12.009.
- Segata N, Izard J, Waldron L, Gevers D, Miropolsky L, Garrett WS, Huttenhower C. Metagenomic biomarker discovery and explanation. Genome Biol. 2011;12(6):R60. doi:10.1186/gb-2011-12-6-r60.
- Love MI, Huber W, Anders S. Moderated estimation of fold change and dispersion for RNA-seq data with DESeq2. Genome Biol. 2014;15(12):550. doi:10.1186/s13059-014-0550-8.
- McMurdie PJ, Holmes S. phyloseq: an R package for reproducible interactive analysis and graphics of microbiome census data. PLoS One. 2013;8(4):e61217. doi:10.1371/JOURNAL.PONE.0061217.
- Planer JD, Peng Y, Kau AL, Blanton LV, Ndao IM, Tarr PI, Warner BB, Gordon JI. Development of the gut microbiota and mucosal IgA responses in twins and gnotobiotic mice. Nature. 2016;534(7606):263–266. doi:10.1038/nature17940.
- Brito F, Zaltman C, Carvalho ATP, Fischer RG, Persson R, Gustafsson A, Figueredo CMS. Subgingival microflora in inflammatory bowel disease patients with untreated periodontitis. Eur J Gastroenterol Hepatol. 2013;25(2):239–245. doi:10.1097/MEG.0b013e32835a2b70.
- Said HS, Suda W, Nakagome S, Chinen H, Oshima K, Kim S, Kimura R, Iraha A, Ishida H, Fujita J, et al. Dysbiosis of salivary microbiota in inflammatory bowel disease and its association with oral immunological biomarkers. DNA Res. 2014;21(1):15–25. doi:10.1093/dnares/dst037.
- Callahan BJ, McMurdie PJ, Rosen MJ, Han AW, Johnson AJA, Holmes SP. DADA2: high-resolution sample inference from Illumina amplicon data. Nat Methods. 2016;13(7):581–583. doi:10.1038/nmeth.3869.
- Tsuruta T, Inoue R, Nojima I, Tsukahara T, Hara H, Yajima T. The amount of secreted IgA may not determine the secretory IgA coating ratio of gastrointestinal bacteria. FEMS Immunol Med Microbiol. 2009;56(2):185–189. doi:10.1111/j.1574-695X.2009.00568.x.
- Santoru ML, Piras C, Murgia A, Palmas V, Camboni T, Liggi S, Ibba I, Lai MA, Orrù S, Blois S, et al. Cross sectional evaluation of the gut-microbiome metabolome axis in an Italian cohort of IBD patients. Sci Rep. 2017;7(1):9523. doi:10.1038/s41598-017-10034-5.
- Fyderek K, Strus M, Kowalska-Duplaga K, Gosiewski T, Wedrychowicz A, Jedynak-Wasowicz U, Sładek M, Pieczarkowski S, Adamski P, Kochan P, et al. Mucosal bacterial microflora and mucus layer thickness in adolescents with inflammatory bowel disease. World J Gastroenterol. 2009;15(42):5287–5294. doi:10.3748/wjg.15.919.
- Reuken PA, Kruis W, Maaser C, Teich N, Büning J, Preiß JC, Schmelz R, Bruns T, Fichtner-Feigl S, Stallmach A. Microbial spectrum of intra-abdominal abscesses in perforating crohn’s disease: results from a prospective German registry. J Crohn’s Colitis. 2018;12(6):695–701. doi:10.1093/ecco-jcc/jjy017.
- Atarashi K, Suda W, Luo C, Kawaguchi T, Motoo I, Narushima S, Kiguchi Y, Yasuma K, Watanabe E, Tanoue T, et al. Ectopic colonization of oral bacteria in the intestine drives T H 1 cell induction and inflammation. Science. 2017;358(6361):359–365. doi:10.1126/science.aan4526.
- Del Carmen S, de Moreno de LeBlanc A, Martin R, Chain F, Langella P, Lg B-H, Jg L. Genetically engineered immunomodulatory Streptococcus thermophilus strains producing antioxidant enzymes exhibit enhanced anti-inflammatory activities. Appl Environ Microbiol. 2014;80(3):869–877. doi:10.1128/AEM.03296-13.
- Nguyen TLA, Vieira-Silva S, Liston A, Raes J. How informative is the mouse for human gut microbiota research? Dis Model Mech. 2015;8(1):1–16. doi:10.1242/dmm.017400.
- Chung H, Sj P, Ja H, Nk S, Sm E, Eb T, Nc R, Ej V, Wang S, Jr M, et al. Gut immune maturation depends on colonization with a host-specific microbiota. Cell. 2012;149(7):1578–1593. doi:10.1016/j.cell.2012.04.037.
- Bates D, Mächler M, Bolker B, Walker S. Fitting linear mixed-effects models using lme4. J Stat Softw. 2015;67(1):1–48. doi:10.18637/jss.v067.i01.
- Nakagawa S, Schielzeth H. A general and simple method for obtaining R2 from generalized linear mixed-effects models. Methods Ecol Evol. 2013;4(2):133–142. doi:10.1111/j.2041-210x.2012.00261.x.
- Caporaso JG, Lauber CL, Walters WA, Berg-Lyons D, Huntley J, Fierer N, Owens SM, Betley J, Fraser L, Bauer M, et al. Ultra-high-throughput microbial community analysis on the Illumina HiSeq and MiSeq platforms. Isme J. 2012;6(8):1621–1624. doi:10.1038/ismej.2012.8.
- Edgar RC. UPARSE: highly accurate OTU sequences from microbial amplicon reads. Nat Methods. 2013;10(10):996–998. doi:10.1038/nmeth.2604.
- Wang Q, Garrity GM, Tiedje JM, Cole JR. Naive bayesian classifier for rapid assignment of rRNA sequences into the new bacterial taxonomy. Appl Environ Microbiol. 2007;73(16):5261–5267. doi:10.1128/AEM.00062-07.
- Jari Oksanen F, Blanchet G, Friendly M, Kindt R, Legendre P, Dan McGlinn PR, Minchin RB, O’Hara GL, Simpson PS, Henry M, et al. vegan: community ecology package 2017; (R package version 2.4-3).
- Kuhn M caret: classification and regression training 2017;(R package version 6.0-76).
- Robin X, Turck N, Hainard A, Tiberti N, Lisacek F, Sanchez J-C MM. pROC: an open-source package for R and S+ to analyze and compare ROC curves. BMC Bioinformatics. 2011;12(1):77. doi:10.1186/1471-2105-12-77.
- Afgan E, Baker D, Batut B, van Den Beek M, Bouvier D, Čech M, Chilton J, Clements D, Coraor N, Grüning BA, et al. The Galaxy platform for accessible, reproducible and collaborative biomedical analyses: 2018 update. Nucleic Acids Res. 2018;46(W1):W537–44. doi:10.1093/nar/gky379.
- R Core Team. R: A language and environment for statistical computing. R Found Stat Comput. 2016. Vienna, Austria. http://www.R-project.org/.
- Wickham H. ggplot2: elegant graphics for data analysis. New York (NY): Springer-Verlag; 2009.