
ABSTRACT
Background
Gut microbiota, by influencing multiple metabolic processes in the host, is an important determinant of human health and disease. However, gut dysbiosis associated with metabolic complications shows inconsistent patterns. This is likely driven by factors shaping gut microbial composition that have largely been under-evaluated, at a population level, in school-age children, especially from developing countries.
Results
Through characterization, by 16S sequencing, of the largest gut microbial population-based school-aged children cohort in Latin America (ORSMEC, N = 926, aged 6–12 y), we identified associations of 14 clinical and environmental covariates (PFDR<0.1), collectively explaining 15.7% of the inter-individual gut microbial variation. Extrinsic factors such as markers of socioeconomic status showed a major influence in the most abundant taxa and in the enterotypes' distribution. Age was positively correlated with higher diversity, but only in normal-weight children (rho = 0.138, P =2 × 10⁻³). In contrast, this correlation although not significant, was negative in overweight and obese children (rho = −0.125, P = 0.104 and rho = −0.058, P = 0.409, respectively). Finally, co-abundance groups (CAGs) were associated with the presence of metabolic complications.
Conclusions
Our study offers evidence that the presence of overweight and obesity could impair the microbial diversity maturation associated with age. Furthermore, it provides novel results toward a better understanding of gut microbiota in the pediatric population that will ultimately help to develop therapeutic approaches to improve metabolic status.
Introduction
The complex microbial community that inhabits the gastrointestinal tract is essential for human health. Over the past decade, the influence of microbial dysbiosis has been shown for a variety of chronic diseases such as inflammatory bowel disease (IBD), obesity and other metabolic conditions.Citation1,Citation2 However, there are inconsistent dysbiosis patterns reported through-out the literature.Citation3,Citation4 Multiple studies have shown that gut microbiota is highly variable among individuals and that a combination of lifestyle as well as intrinsic factors shape its structure and function. Thus, suggesting that these may partly explain the inconsistent findings.Citation4 In addition, human gut microbiome changes significantly over a lifetime, and age-specific differences may be another key to understanding microbiome-mediated effects on health.Citation5
Studies in neonates and toddlers have observed a significant influence of the type of delivery and infant feeding practices on gut microbiota composition.Citation6-Citation11 In addition, large-scale population studies in adults, mainly from westernized countries have described that environmental factors such as medications use and long-term dietary patterns have a significant impact on gut microbial communities,Citation12-Citation14 while host-intrinsic factors such as genetics, although significant, have a low effect size.Citation15-Citation19 Other studies contrasting rural and urban communities highlight that gut microbial variability may respond to geographical origin, and associated lifestyles.Citation20-Citation24 Latin America includes countries with multiple lifestyles, genetic backgrounds and socioeconomic conditions, which may determine gut microbiome differences of individuals from these countries.Citation25 Moreover, the prevalence of overweight, obesity and metabolic complications in children and adults of these countries, specially Mexico, has rapidly increased over the last decades.Citation26,Citation27 Although new studies on the microbiome composition of Latin American countries are becoming available, the knowledge on the factors influencing gut microbial communities is still scarce.Citation28-Citation30 Furthermore, while numerous studies have investigated the composition and dynamics of the intestinal microbiota in infants and adults only a few have specifically examined major modifying factors within childhood and early adolescence.Citation6,Citation31-Citation33 Most of these studies have a relative small sample size to discover novel associations.Citation31 Therefore, the gut microbiota of school-age children, including early adolescents, remains poorly characterized, representing a missing link in the long-term dynamics.
Thus, our aim was to characterize the gut microbiota of children and adolescents in a large-scale cross-sectional study to understand the correlation between environmental variables and host intrinsic factors with the gut microbial communities and, ultimately, their link to overweight, obesity and metabolic complications.
Results
Description of study population
Data presented here included 926 children from 6 to 12 y old, representing a sub-cohort who participated in the Obesity Research Study of Mexican Children (ORSMEC) cohort which has been extensively phenotyped for a variety of metabolic and metabolomic parameters.Citation34 Of the 926 participants, 49.3% were female and 30% of the children were classified as early adolescents (≥11 y old).Citation35 Notably, 41% of the children were overweight or obese, 31% had hypertriglyceridemia and 18% presented low HDL cholesterol levels.Citation36 In addition, 69% were born by C-section and only 33% were breastfeed for at least 6 months. Further characteristics of study participants are summarized in Supplemental Table S1.
Gut microbial characterization
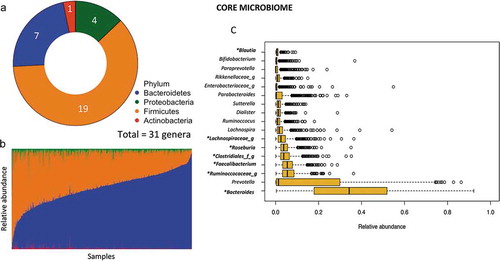
We performed amplicon-based sequencing of the V4 region of the 16S rRNA gene on 926 fecal samples.Citation37 Sequence analysis using quantitative insights into microbial ecology (QIIME) resulted in 99,700,401 high-quality reads, with a mean sequencing depth of 107,667 sequences per sample (range 17,555–249,455). Characterization of the phylogenetic variation showed 18 phyla and 380 genera in the whole data set, where 7 phyla and 87 genera were found in at least 25% of the population. In addition, the core microbiota in these children (genera shared by 95% of the samples) yielded 31 genera distributed among 4 phyla (Firmicutes, Bacteroidetes, Proteobacteria and Actinobacteria; ) and comprising 96% of the total abundance. In accordance with other populations, Firmicutes and Bacteroidetes were the dominant phyla (median abundance 34.41%, IQR: 25.23–45.90, and 62.07%, IQR: 50.00–71.72; respectively); however, a great variability was observed among subjects (). At genus level, the more abundant taxa were Bacteroides followed by Prevotella and an unclassified Ruminococcaceae genus ().
Figure 1. Summary of core gut microbiota in Mexican children. (a) Total number of core genera in each phylum (defined as present in >95% of samples children). (b) Abundance of core phyla across samples. (c) Median relative abundance of the 17 top core genera.
Microbiome variation and clustering
We next assessed, by unconstrained canonical correspondence analysis, the genera contributing to the greatest variation within the dataset. Microbiome variation resulted mainly from changes in the abundance of two genera included in the core taxa (Prevotella from Prevotellaceae family and Bacteroides from Bacteroideaceae family), and of genus Prevotella from Paraprevotellaceae family (). As the previous results partially correspond to the proposed enterotype distribution and considering that bacteria in the gut constitutes a complex ecosystem in which different species interact as a community,Citation38 we applied the clustering analysis suggested by Arumugam et al.Citation39 As suggested by the Calinski-Harabasz (CH) index, we identified an optimal of two clusters driven by Bacteroides (E1) and Prevotella (E2), supporting the enterotypes distribution (Supplemental Figure S1 A-C). Classification of the 926 samples showed that 63% of the children belonged to Bacteroides enterotype while 37% to Prevotella (). The alpha diversity indexes observed in each sample indicate that individuals within the Bacteroides enterotype harbor a greater richness and diversity than Prevotella subjects (Chao; P =1.3 × 10⁻⁶, Shannon; P =3.9 × 10⁻¹³; Supplemental Figure S1D).
Figure 2. Structure and variation of microbial community in 926 participants of the ORSMEC cohort. (a) Top genera contributing to microbial community variation within the dataset as assessed by canonical correspondence analysis. (b) Clustering of the 926 participants based on genera composition data and using the JSD and PAM clustering. The optimal number of clusters was chosen by the Calinski–Harabasz index and validated based on the prediction strength and average silhouette width (SW). (c) Hierarchical Ward-linkage clustering based on Kendall correlation coefficients of the relative abundance of genera present in at least 25% of the samples. Co-abundance groups (CAGs) were defined based on the clusters in the vertical tree and named after their most representative taxon.
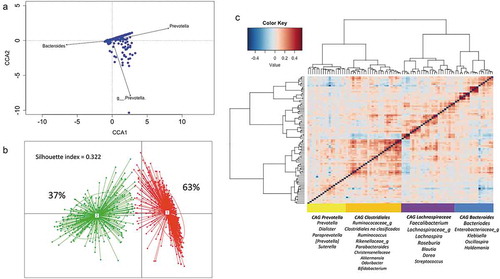
To further explore patterns in the microbial structure, we identified co-abundance groups (CAGs). This type of analysis is based on the frequency of concomitant detection of two bacterial groups. We performed co-abundance analysis based on correlations between genera (see the “Methods” section) and then clustered by applying hierarchical clustering with Ward’s linkage to define co-abundance groups.Citation40 We identified four CAGs significantly different from each other (p < 0.01; permutational multivariate ANOVA). Prevotella-CAG and Bacteroides-CAG comprised 18 genera each and were named after the taxon with greater abundance. The two other CAGs had more homogenous abundance distribution lacking a single dominant taxon, thus were named after higher taxonomical orders; Clostridiales-CAG and Lachnospiraceae-CAG. Each one comprised 25 and 26 genera ( and Supplemental Table S2 for genera full list).
Identification of microbiome covariates
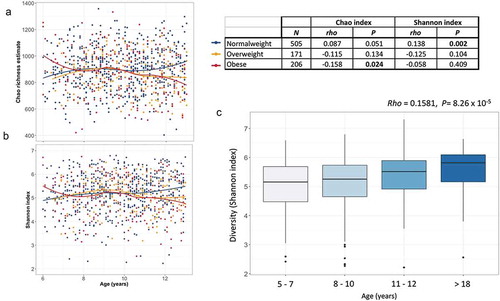
To identify microbiome covariates, we selected variables that were representative of socioeconomic status (SES), clinical and anthropometric traits, as well as lifestyle factors. We correlated 61 out of the 104 factors with microbial diversity and richness. At a false discovery rate (FDR) of <0.1, 13 factors were associated with microbial diversity (Shannon index) and 14 with richness (Chao richness estimate) (Supplemental Figure S2). Serum amino acids were the main metabolites associated with alpha diversity, where after normalizing for sequencing depth, a higher concentration of amino acids correlated to lower richness and diversity. Interestingly, an amino acid signature composed of branched-chain (BCAA), aromatic amino acids (AA), arginine and proline, previously associated with obesity and hypertriglyceridemia in these childrenCitation34 was negatively correlated with Chao and Shannon indexes even after adjusting for BMI percentile (rho = −0.08, P = 0.012). In addition, C-reactive protein and serum aspartate aminotransferase (AST) levels were negatively correlated with the Shannon index, while high-density lipoprotein (HDL) cholesterol levels correlated positively. Body mass index (BMI) percentile, months of exclusive breastfeeding and mother educational level were nominally associated with Shannon index or trended (<0.1), but lost their significance after multiple corrections. Surprisingly, age was not associated with any of the alpha diversity measurements. Given that overweight and obesity have been shown to negatively impact microbial diversity, we analyzed a subsample considering only normal-weight (NW) children and performed the association between age and alpha diversity (n = 505). As expected, in NW children, age was positively correlated with microbial diversity as evaluated by the Shannon index (rho = 0.138, P = 2 × 10⁻³; ). In contrast, although not significant, this correlation was negative for overweight and obese children (–). In accordance, alpha diversity indexes of older NW children (>12 y, n = 64) were significantly higher than those of children (<7 y n = 40; P < 0.05), while indexes of overweight-obese older children were not (n = 59, P > 0.40).
Figure 3. Age-related changes in alpha-diversity indexes of gut microbiota. (a–b) Scatter plots of Chao richness and Shannon diversity showing the progression of diversity indexes with increasing age, stratified by nutritional status. Regression lines are drawn using the loess model in R. (c) Box plot showing the Shannon diversity in normal-weight individuals per age group. The center line denotes the median, the boxes cover the 25th and 75th percentiles and points outside the whiskers represent outlier samples.
A binary analysis (presence/absence) of identified genera in NW children (<7 y) and their older counterparts showed that 116 out of 191 identified genera (see the “Methods” section) were more frequent in older children samples. Interestingly of those, only 35 genera (representing the 30%) were also as frequent in overweight-obese older children samples (Supplemental Table S3). A further analysis of the genera identified in overweight-obese older children showed the presence 6 of genera absent in their NW counterparts.
Furthermore, by comparing diversity indexes with a small sample of a normal-weight Mexican adults (aged > 18 y old, n = 26), we confirmed that beyond the gradual increase in alpha diversity throughout childhood (6–10 y) and early adolescence (11–12 y), microbial diversity continues to increase until adulthood (rho = 0.1581, P = 8.26 × 10⁻⁵). Microbial diversity of early adolescents (11–12 y) seems to be lower than in the adult population although the difference did not reach statistical significance (P = 0.17: ).
We next performed NMDS analysis to investigate factors associated with inter-individual distance of microbial composition (Bray–Curtis distance). To avoid redundancy among highly correlated variables, we selected the most representative factors (see the “Methods” section). Overall, 14 factors (FDR<0.1) were significantly associated with inter-individual microbial distance in the whole dataset, including ten intrinsic factors, and 4 environmental variables (). All together, these factors explained 15.7% of the variance in microbial composition. Among metabolic traits, uric acid, BMI percentile, the amino acid signature and serum methionine levels contributed the highest (>1% each). While among environmental variables, markers of SES (such as monthly family income and mothers’ educational level) and antibiotic use in the last 6 months contributed the highest (>1% each). Interestingly, factors previously associated with microbiome composition such as infant feeding practices (breastfeeding duration) and gender, were only borderline associated with gut microbial variation before FDR correction (P < 0.1, PFDR > 0.10). While birth mode and age showed no association (Supplemental Table S3).
Figure 4. Explained variance of selected microbiome covariates. Horizontal bars show the amount of variance (R2) explained by each covariate in the model as determined by EnvFit function in R. The rest of the covariates and the groups within are detailed in Supplementary Table 3. Covariates are colored based on the overall metadata group. Asterisk denotes significant covariates [false discovery rate (FDR) P < 0.10] while dot denotes significant covariates in each age group before FDR correction (P < 0.05).
![Figure 4. Explained variance of selected microbiome covariates. Horizontal bars show the amount of variance (R2) explained by each covariate in the model as determined by EnvFit function in R. The rest of the covariates and the groups within are detailed in Supplementary Table 3. Covariates are colored based on the overall metadata group. Asterisk denotes significant covariates [false discovery rate (FDR) P < 0.10] while dot denotes significant covariates in each age group before FDR correction (P < 0.05).](/cms/asset/2c9824ff-165f-4c97-a5c2-0a7aaa357fb9/kgmi_a_1712985_f0004_oc.jpg)
To further understand if there were specific factors influencing gut microbial composition at different childhood stages, we stratified the sample into younger children (6–10 y, n = 639) and early adolescents (≥11 y, n = 287).Citation35 In early adolescents, gender was nominally associated with microbial composition and explained ~1% of the variance. In addition, gestational age and hip circumference explained almost 4% and 2.5% of microbial variation in this age group. Interestingly the association with antibiotic use remained significant only in children ().
Diet as gut microbial covariate
Diet is known to be a driver of gut microbial variations in diversity and structure.Citation41 In this study, the influence of dietary components, such as food groups and nutrients, on microbial composition (alpha diversity and inter-individual microbial distance) was evaluated in a subsample of 438 individuals. Although none of the correlations with alpha diversity indexes remained significant after FDR correction, consumption of crude fiber was positively correlated with microbial richness (Chao richness: rho = 0.1398, P = 3.44 × 10⁻³ PFDR = 0.14), while frequency consumption of white bread and wheat tortillas correlated negatively (rho = −0.1283, P = 8.59 × 10⁻³, PFDR = 0.17). In addition, frequency consumption of yogurt was nominally associated with inter-individual microbial distance (at genus level), explaining around 2% of the microbial variation (P = 7.99 × 10⁻³, PFDR = 0.35, Supplemental Table S5).
Associations of gut microbiota composition with lifestyle and environmental variables
In our cohort, the use of antibiotics over the previous 6 months, family monthly household income, mothers’ educational level and hours of moderate and vigorous physical activity explained a modest but significant proportion of gut microbial inter-individual variability (). Thus, we performed multivariate analysis to assess the association of these environmental factors with community-wide microbial composition (shared by at least 25% of the individuals). Eleven taxa showed a significant association with monthly household income. Interestingly, Prevotellaceae family and specifically genus Prevotella, which have been previously associated with a rural lifestyle, were negatively associated with monthly income (P =1.3× 10⁻³, PFDR = 0.04). In addition, an unclassified genus of Veionellaceae and genus Megamonas from the same family were negatively associated with income. In contrast, greater abundance of Rikenellaceae family as well as genera Holdemania and Oscillospira, and at species levels Eggerthella lenta, Bacteroides fragilis and Eubacterium dolichum were significantly associated with a higher income (). Interestingly, most of the latter genera clustered in the Bacteroides CAG, which was also positively associated with a higher family income (Supplemental Table S6).
Table 1. List of taxa significantly associated with monthly household income.
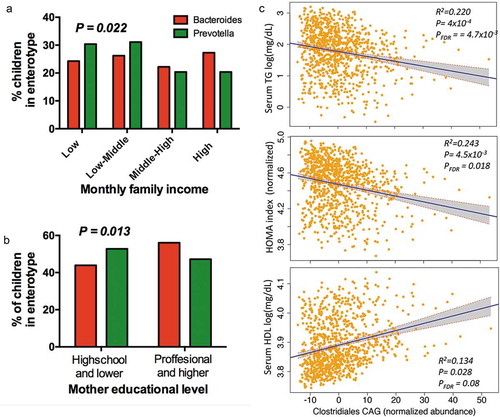
Given that genus Prevotella was among the main taxa associated with household income and that Bacteroides was also nominally associated but in the opposite direction (P = 0.03), we tested whether enterotype distribution was related to household income and other markers of SES. The distribution analysis confirmed that indeed Prevotella enterotype was significantly enriched among children whose families were within the lower-income quartile (P = 0.022), as well as in subjects whose mothers had a lower level of education (P = 0.013). Whereas Bacteroides enterotype was more prevalent among children with a higher family income, and whose mothers had a higher educational level (. These findings were further supported by co-abundance group analyses (Supplemental Table S6).
Figure 5. Association of enterotypes and CAGs with environmental variables and metabolic traits. (a) Proportional distribution of household income quartiles among enterotype. (b) Distribution of enterotypes among levels of education in children’s mothers. (c) Regression plots of Clostridiales-CAG normalized abundance with metabolic traits, controlling for technical covariates, sex, age and BMI percentile. Shaded areas show confidence intervals.
Associations of gut microbiota structure with phenotype
The ORSMEC study was initially designed to assess in children the prevalence and determinants of overweight, obesity and metabolic complications; thus we tested whether the microbiome was associated with adiposity markers, overweight and obesity, as well as with metabolic complications.
As previously described, alpha diversity indexes were negatively correlated with BMI percentile (Supplemental Figure S2A); thus, we assessed the relationship with overweight and obesity. Overweight and obese children showed a slight decrease in richness and diversity (Supplemental Figure S2B). Altogether overweight-obese children harbored lower richness and diversity (P = 0.0162 and P = 0.0265, respectively; Supplemental Figure S2C). Furthermore, higher diversity and richness was associated with a lower risk for overweight/obesity (OR = 0.79, 95% CI 0.65–0.94; P = 0.0108 and OR = 0.33, 95% CI 0.13–0.82; P = 0.0172, respectively). Using a stepwise modeling, we observed that this association was independent of other risk factors such as mode of delivery and monthly family income. However, the association was partially lost after adjusting for the amino acid signature (Supplemental Table S7).
We next assessed the relation of adiposity markers with gut microbial taxonomy. After adjusting for basic explanatory variables (age and gender), as well as environmental factors driving microbiome composition (monthly household income), adiposity markers (waist circumference, BMI percentile and body fat percentage) were significantly associated with the abundance of 8 taxa (Supplemental Table S8). Moreover, Christensenellaceae was associated with a lower risk of overweight and obesity (OR = 0.90, 95% CI 0.84–0.97; P =3.9 × 10⁻³). In contrast, a novel association of Dialister with a higher risk (OR = 1.55, 95% CI 1.06–2.26; P = 0.024) was observed.
To further investigate the influence of gut microbial taxonomy on the phenotype, we assessed the association with metabolic traits. After further adjusting for BMI percentile, Coprobacillus and Eggerthella lenta were negatively associated with serum triglycerides (TG) (P= 9 × 10⁻⁴, PFDR = 0.08 and P =1.3 × 10⁻³, PFDR = 0.08, respectively). In addition, species previously known to confer metabolic benefits such as Bifidobacterium longum and Akkermansia muciniphila were also negatively correlated with serum TG levels (P = 0.037, PFDR = 0.26 and P = 0.029, PFDR = 0.26, respectively). Interestingly, the presence and higher abundance of Eggerthella lenta was further associated with a lower risk for hypertriglyceridemia (OR = 0.62, 95% CI 0.46–0.83; P =1.4 × 10⁻³), and this association remained significant after adjusting for potential confounders such as HOMA index and the amino acid signature (OR = 0.56, 95% CI 0.41–0.76; P = 2.67 × 10⁻⁴).
Co-abundance groups are associated with metabolic complications
Although we identify individual taxa significantly associated with adiposity markers, most correlations with metabolic traits, lost significance after FDR correction. CAGs analysis offers an ecologically relevant method for reducing dimensionality of gut microbial data and has been shown to be more informative than abundance differences of individual taxa.Citation40,Citation42 Thus, to test their potential combined effect on metabolic output, we analyzed the influence of CAGs in the phenotype. The analysis confirmed and extended previous taxa–phenotype relationships. For instance, Clostridiales-CAG, including Christensenellaceae, Rikenellaceae, Akkermansia and Bifidobacterium was negatively associated with the three adiposity markers, with metabolic traits (TG, HOMA index and nominally with HDL levels; and Supplemental Table S9) and with a lower risk for metabolic syndrome (OR = 0.97 95% CI 0.95–0.99, P = 0.0045). In contrast, Prevotella-CAG including Prevotella, Dialister and Suterella was positively associated with adiposity markers (Supplemental Table S9) and as a trend with the risk of being overweight or obese (P = 0.0752)
Discussion
Dysbiosis has been associated with a wide range of metabolic conditions and chronic medical illnesses.Citation43 However, patterns of dysbiosis have been inconsistently found across the different countries and life stages.Citation3,Citation44 Thus, there is a need for large-scale studies to identify microbiome covariates across populations and life stages in order to draw reliable conclusions on specific phenotypes.Citation4,Citation45 To address this, we profiled the gut microbial composition of 926 children of the ORSMEC cohort by 16S sequencing. This large-scale cross-sectional cohort of children (including early adolescents), is in our knowledge, the largest gut microbial-based study in Latin America and the largest of school-age children worldwide. Our study highlights three major findings (i) among environmental variables, SES is the leading factor influencing gut microbial composition in Mexican children, (ii) overweight and obese children do not show the gradual increase in gut microbial diversity associated with age, (iii) CAGs are associated with the presence of metabolic complications in children and these patterns are consistent with microbial signatures observed in other populations.
The first aim of our study was to assess factors influencing gut microbial composition in a pediatric Latin American population. Previous studies from different geographic regions and contrasting lifestyles have reported that the abundance of genus Prevotella as well as the classification into the corresponding Prevotella enterotype has been shown to represent the country of residence and linked to rural lifestyles and certain dietary components.Citation32,Citation46,Citation47 In our study, which represents a rather homogeneous cohort within a single ethnogeographic region and where effects of climate, culture and nationality are not a confounding factor, genus Prevotella is one of the major drivers of microbial variation and its abundance and enterotype classification are associated to markers of lower SES but not to a specific diet (data not shown). This is consistent with two recent reports of Chinese and Ecuadorian adultsCitation30,Citation48 which highlight that this finding could be particularly true for nations undergoing economic development. Although our study does not provide mechanistic insights of why markers of SES are associated to gut microbial composition, it is possible that these markers reflect differences in lifestyle factors such as drinking water, hygiene conditions or even dietary components that were not detected in the subsample analysis of our study. In this respect, an interesting finding was the lower microbial diversity observed in the Prevotella enterotype. Previous studies have shown that a lower dietary diversity is associated with a lower microbial diversity.Citation40 In addition, studies from developing countries also show that a poor dietary diversity is also linked to a lower socioeconomic status.Citation49 Although the FFQ performed in this study does not allow to obtain a food diversity index, we might speculate that subjects within the Prevotella enterotype, who also report a lower SES, have a lower dietary diversity which could be related to the observed lower microbial diversity.
Adolescence represents a particular stage of life that is associated with major physiological changes, including male/female specific variations that could also influence the microbiome.Citation50 However, reports on the factors influencing gut microbial variation at this stage are still scarce. The size of our study allowed for a stratified analysis of early adolescence, with three important findings. First, similar to previous reports in adults,Citation12 gender was able to explain around 1% of the microbial variation. Second, we observed an association with gestational age, which explained around 4% of the microbial variation. A significant influence of gestational age on gut microbial composition was previously reported but only in infants up to 24 months.Citation51 It has been proposed that health in adolescents results from an interaction between prenatal and early childhood development and that early life events can have lifelong effects on host health.Citation52 Thus, it is plausible that the influence of gestational age in adolescent microbial variation could be a signature of early life events on host physiology; however, if there is any impact of microbiome differences on host physiology warrants further study. Lastly, the effect of previous antibiotic use on microbial composition seems to become less relevant at this stage. It has been suggested that during the maturation from infancy to adolescence, the microbiome acquires a repertoire of antibiotic-resistance genes termed the “resistome.”Citation50,Citation53 If this holds true for our population, it will be interesting to investigate whether the resistome represents an advantage toward a more resilient microbiome during adolescence.
Our second aim was to test for associations between the gut microbial structure and overweight, obesity and metabolic complications. In recent years, one recurring pattern associated to host health status is a greater richness and diversity at structural and functional level.Citation54 In fact, it has been hypothesized that microbial richness across westernized populations are needed to maintain health and prevent metabolic diseases.Citation55 We show that through-out childhood and early adolescence overweight and obese children do not show the natural increase of microbial diversity associated with age. Indeed, only a fraction of genera (~30%) were as frequent in overweight-obese older children when compared to their age-counterparts NW children. Interestingly, the presence of certain genera in overweight-obese older children not identified in their NW counterparts may also suggest a divergent microbiota in these children.
Although the cross-sectional nature of our study does not allow for causation, this could imply that the presence of overweight or obesity during childhood impairs the natural development in microbial diversity observed with age in NW children possibly leading to an immature gut microbiota. In addition, it could also contribute into a divergent gut microbial profile. Furthermore, since during childhood gut microbiome has not fully acquired its maturation and diversity, which has been commonly used as a marker of stability,Citation56 it would also be interesting to assess whether the lower diversity and divergent gut microbiota at this age period could predispose children to the development of other complications in adulthood.
In addition to changes in diversity, certain taxonomic signatures have been correlated with overweight, obesity and metabolic complications. Our study yields similar results to other populations.Citation17,Citation57-Citation59 First, consistent with ours and others' previous findings, greater abundance of Christensenellaceae family was associated with a lower BMI percentile.Citation17,Citation37 Furthermore, the CAGs analysis allowed us to identify that the combined effect of several taxa included in the Clostridiales CAG, individually associated in previous studies to metabolic health (Christensenellaceae, Rikenellaceae, Akkermansia and Bifidobacterium)Citation12,Citation14,Citation17,Citation57-Citation61 seem to be protective of metabolic complications in children.
It has been reported that communities of co-abundant microbes can be driven by factors such as cross-species metabolism or by their responses to environmental conditions.Citation62 While members of the Clostridiales-CAG have been previously reported to be co-abundant and associated with extreme longevity,Citation50,Citation63 the understanding of the mechanisms leading to their co-abundance requires further research.
The previous findings highlight that despite population and age-related differences in gut microbial determinants, there are consistent signatures associated with metabolic complications. In addition, novel significant associations were detected. Specifically, the presence as well as greater abundance of a low abundance taxon Eggerthella lenta was associated with lower serum TG levels. Although this taxon has been mainly studied through its effects on xenobiotics metabolism,Citation64,Citation65 animal models have shown that it is associated with hepatic lipid metabolism.Citation66 Even though further studies are needed to test whether the abundance of Eggerthella lenta is causally related to lower hypertriglyceridemia, it has been hypothesized that this bacterium could have pleiotropic effects on host health through multiple mechanisms such as its ability to metabolize bile acids.Citation67
This study has some strengths and limitations. One limitation is the lack of follow-up. Such a clinical follow-up would have allowed us to establish whether the impaired increase of microbial diversity observed in overweight and obese children has a causal relationship, and thus, if the presence of obesity could prevent gut microbiota maturation. In addition, the study of the 16S rRNA gene only allows the analysis of microbial structure; thus, to further extend our results to a functional level, a metagenomic approach will be valuable. In contrast, a major strength of this study is the large sample size which allows for properly taking into account the natural biological variability in microbiota composition across subjects. In addition, the evaluation of the gut microbiota effect on the phenotype considers confounding variables, including age, gender and household income.
Conclusions
To our knowledge, this is the largest cross-sectional gut microbial-based study in school-aged children. Our data support that in developing countries, markers of SES capture important determinants of gut microbial variation. Furthermore, and although longitudinal studies are needed, our study provides evidence that the presence of overweight and obesity during childhood may impair the microbial diversity maturation associated with age. Finally, it also highlights that there are specific signatures associated with obesity and metabolic complications beyond geographic variation, that could represent new targets toward the prevention or treatment of overweight and obesity.
Future studies should include metagenomics analysis to explore the influence of such environmental factors on gut microbial functionality. In addition, the study of other microbial communities in the GI tract such as the virome could aid in the understanding of the gut microbiota maturation during childhood through interaction analysis between gut bacteria and viruses.
Methods
Study participants
This study was embedded in the “Obesity Research Study for Mexican Children” (ORSMEC), which is a population-based study in Mexico City including 6–12-y-old children recruited from a summer camp of children of employees of the Mexican Health Ministry (Convivencia Infantil, Sindicato de la Secretaria de Salud) and Hospital Infantil de Mexico. The study was designed to assess in children the prevalence and genetic determinants of obesity and metabolic traits. All children included were free of chronic medical illness. Parents or guardians of each child signed the informed consent form and children assented to participate. The study was approved by the Ethics Committee of participant institutions and was in accordance with the Helsinki declaration II.
This study includes the subset of 926 children from ORSMEC who provided a fecal sample, and whose sample provided high-quality Illumina data. Each participant was thoroughly assessed including demographic information and health-related phenotyped, via a self-administered questionnaire to the parents (including information about clinical history, current health status, and drug treatment) as well as a health assessment and extended clinical blood profiling included metabolomics.
For comparative purposes on alpha diversity, a small adult group was included. This comprised 26 normal-weight non-related subjects aged 18–60 y, with no reported chronical illnesses, recruited from different institutions in Mexico (Hospital Infantil de Mexico Federico Gomez, Instituto Mexicano del Seguro Social and Universidad de Guadalajara).
Stool sampling and DNA extraction
Fecal samples were collected at home in a sterile cup, and refrigerated overnight prior to storage at −70ºC until processing. DNA was extracted from 200 mg of feces using the QIAamp® DNA Stool Mini Kit (Qiagen, Inc.), eluted in a final volume of 200 µl and stored at −70°C until further analysis. Concentrations of extracted DNA from each sample were determined by spectrophotometry (Nanodrop 2000c) measurement, and an estimate of sample purity was determined by measuring the A260/A280 absorbance ratio.
Anthropometric and clinical parameters
Anthropometric measurements were determined as previously describedCitation34 and included weight, height, waist and hip circumferences. All instruments were calibrated following the standard methods of the manufacturers. Blood pressure (BP; mmHg) was measured using an automatic manometer (Microlife). Body fat mass percentage was obtained by bioelectrical impedance analysis (Quantum X Body Composition Analyzer, RJL Systems). Centers for Disease Control and Prevention 2000 growth charts were used as reference to determine body mass index (BMI) percentiles. Obesity status was defined as BMI percentile ≥95th, overweight between 85th and 95th percentile, normal-weight between the 5th and 85th percentile and underweight <5th BMI percentile for age and gender.Citation68 National Heart, Lung, and Blood Institute reference data were used to determine BP percentiles based on height, age and gender.Citation69 As suggested by the Expert Panel on Integrated Guidelines for Cardiovascular Health Risk Reduction in Children and Adolescents, hypertriglyceridemia was defined as serum triglyceride levels ≥100 mg/dL in children under 10 and ≥130 mg/dL in children ≥10 y old. While hypoalphalipoproteinemia was defined as HDL levels <40 mg/dL.Citation36 Metabolic syndrome was defined as established by De Ferranti,Citation70 with 3 or more of the following characteristics: TG≥100 mg/dL, HDL cholesterol <50 mg/dL, BP percentiles >90, glucose ≥ 110 mg/dL and waist circumference >75th percentile.
Blood sampling and biochemical analyses
Five milliliters of the blood samples were drawn after 8–12 h of fasting. For serum samples, a 30-min period was allowed for clotting before serum separation and then stored at −80ºC until further analysis. Serum levels of glucose, creatinine, uric acid, total cholesterol, HDL cholesterol, LDL cholesterol, TG, aspartate aminotransferase (AST), alanine aminotransferase (ALT), gamma-glutamyl transpeptidase (GGT) and C-reactive protein (CRP) were measured with commercially available standardized methods (UNICEL DxC600, Beckman Coulter). Insulin was determined using an Access 2 Immunoassay System (Beckman Coulter). Insulin resistance was indirectly estimated with the homeostasis model assessment for insulin resistance (HOMA-IR).
Metabolomics analysis
Serum amino acids and carnitines were measured by a targeted metabolomics approach using electrospray tandem mass spectrometry (Quattro Micro API tandem MS), as previously described.Citation34
Dietary records
In a subsample of the study population, a semi-quantitative Food Frequency Questionnaire (FFQ), previously validated for the Mexican population, was answered by the parents to estimate children’s dietary intakes over the previous year. This instrument includes 116 food items and 10 consumption frequencies.Citation71 Food items were grouped based on nutrients similarities as described in Flores et al.Citation72 Average daily energy and nutrient intakes were computed from consumption frequencies through the Evaluation System of Nutritional Habits and Nutrient Intake (SNUT). Food questionnaires with more than 30% of the food groups with extreme consumption, or considered outliers (established as >95th percentile from each food groupCitation73 and those with energy intakes higher than 2.5 SD above the mean were excluded from the analysis. For non-metric multidimensional analysis, missing values due to failure by participants, in variables with less than 10% of missing values, were imputed via the NIPALS algorithm. To control for the confounding effect of energy intake being associated with the phenotype food groups were adjusted by kilocalorie intake.Citation74 The final sample with dietary assessment comprised 438 children and had a similar distribution in age, gender and phenotype, compared to the whole dataset.
Sequencing of 16S rRNA
The V4 hypervariable region was sequenced using 515F and 806R primers, as suggested by the Earth Microbiome ProjectCitation75 and as previously described.Citation37 Briefly, PCR was performed on 100 ng DNA, and products were purified using Agencourt AMPure XP beads (Beckman Coulter) with an automatized protocol in the Agilent Bravo Automated Liquid Handling Platform (Agilent Technologies). Equimolar ratios of amplicons from the individual samples were pooled and sequenced using an Illumina MiSeq 2 × 250 platform. Size and concentration of each sequencing pool were determined by an Agilent D1000 ScreenTape for 4200 TapeStation System (Agilent Technologies) and a Qubit 2.0 fluorometer (Invitrogen), respectively.
Data processing and statistical analysis
Sequences were analyzed using QIIME 1.9.0.Citation76 Quality filters were used to remove sequences containing barcode mismatches, ambiguous bases, or low-quality reads (Phred quality score <30). After trimming barcodes, demultiplexing was performed. Operational taxonomic unit (OTU) read counts were calculated using the QIIME pipelineCitation75 (version 1.9.1; default parameters) with closed-reference OTU picking at 97% identity against the Greengenes database (version 13_08). Potential chimeras were detected with USearch61 and excluded from further analysis. Taxonomical classification was performed to generate phylum to species-level composition matrices.
Rarefactions curves were calculated using QIIME, subsampling in the range of 10–17,000 sequences, with a step of 1,000 sequences, and ten re-samplings on each step. Values were obtained for the Shannon diversity index, observed species and Chao1 richness estimate at a standardized sequencing depth. To explore the gut microbial “maturation” of older overweight/obese children (>12 y old, n = 59), we performed comparisons with normal-weight children <7 years old (n = 40), and normal-weight older children (>12 y old, n = 64). Particularly, a binary analysis at genus level (presence/absence) was performed, including only genera with a binary behavior (191/380 genera) in this children subset and, that were present in more than 1 subject among groups. Frequency was calculated as the number of children with non-zero abundance divided by the number of children within each group.
Core-microbiota was generated as OTUS observed in 95% of all individuals. Enterotyping was performed according to the original method described by Arumugam et al.Citation39 where the Calinski–Harabasz (CH) index suggested the optimal number of clusters and classification validity was evaluated using the Silhouette index. For association with environmental variables, a Pearson’s chi-squared test with 5% level of significance was used to compare the distribution of the enterotype among the mothers’ educational groups and monthly family income quartiles.
Bacterial co-abundance groups (CAGs)
CAGs were defined according to the methods described by Claesson et al.Citation40 Briefly, Kendall correlation coefficients between genera present in at least 25% of the individuals were calculated and then Hierarchical clustering with the Pearson correlation distance metric and Ward clustering was used to define co-abundant groups. Taxa with the highest median abundance served to name each CAG. The Kendall correlations were converted to a correlation distance metric and used as input for a permutational multivariate analysis of variance (PERMANOVA) to determine if the CAGs were significantly different from each other. The score of each CAG within each individual was calculated as the sum of z-scores from the relative abundance of genera belonging to the same CAG.Citation77
Microbiome variation
The contribution of each genus to microbiome variation was derived from canonical correspondence analysis (CCA) using normalized genus abundances. CCA was performed using the vegan R package function cca, which performs ordination based on abundances and variations of each taxa.Citation12
Covariate analysis
Metadata variables were considered if answered in at least 90% of all individuals via the self-administered questionnaire and to prevent redundancy they were further screened to detect correlation. Spearman’s correlations were calculated pairwise between these, and when the correlation was >0.8, the most representative feature was selected for further analysis. We next assessed how much variation of Bray–Curtis distance (at OTUs and genus level) can be explained by each of the continuous or categorical factors using the function envfit from the R package vegan. The P value was determined by 1000× permutations and was further adjusted for multiple testing using the Benjamini and Hochberg method.Citation78 Metadata including dietary information were also tested for associations with alpha-diversity measures (Chao richness estimate and Shannon index) by the Spearman rank correlation, adjusted by sequencing depth and corrected for multiple testing. Significance levels were defined at FDR<10%. To identify influencing factors differing between age stages, the sample population was stratified into two age groups (children: 6–10 y old vs early adolescents: ≥11 y old).
Furthermore, microbiome covariates were tested for association with abundances of common microbial taxa (defined as genera present in at least 25% of the individuals). For these, taxa abundance was first converted to log-transformed relative abundances, with zero counts handled by the addition of an arbitrary value, (10−6) Citation79. The residuals of the taxa abundances were taken from linear models, accounting for technical covariates including sequencing depth, sequencing run, extraction technician and sample collection year.Citation16 As residuals were not normally distributed, they were further normalized according to the Box–Cox method, which transforms data into a normal shape by using the parameter λ, and used in downstream analyses. Significance levels were defined at FDR<10%
In associations of microbial taxonomy with extrinsic factors, microbial taxonomy was considered the dependent variable while for association with phenotypic traits it was considered as the independent variable. In the latter, multivariate models included age, sex and monthly income as fixed covariates.
Targeted analysis of factors
Hypothesis-driven associations between specific taxa and phenotypes were assessed with multivariate logistic regression analysis, using stepwise modeling to determine the effect of other risk factors or potential confounders.
Disclosure of potential conflicts of interest
The authors declare that they have no competing interests.
Availability of data and materials
The datasets generated and/or analyzed are available from the corresponding authors.
Authors’ contributions
S-MR and S-CQ conceived the experiments, S-MR, E-OM, B-LC and R-VV performed microbiome analysis, E-OM, B-LC, J-MM, R-VV, L-MK and S-MR performed the data analysis and interpretation, H-VR, B-LC, P-LM, B-RN, J-S, R-VC, Z-RC, contributed to data collection and database generation, I-IG, M-VA performed metabolomic analysis, F-GP and C-AS performed biochemical measurements, S-MR, B-LC, S-CQ wrote the manuscript. All authors read and approved the manuscript.
Supplemental Material
Download Zip (963.7 KB)Acknowledgments
This work was supported by CONACYT grant #248765 to SM-R and Programa de Apoyo a Proyectos de Investigación Tecnológica (PAPIIT-UNAM IA202413) to SC-Q. We thank all the family volunteers who participated in this study.
We thank Alfredo Mendoza, Luz E. Guillén, Carmen Moreno, Adriana Lopez and Guadalupe Lopez for their technical assistance.
Supplementary material
Supplemental data for this article can be accessed on the publisher’s website.
Additional information
Funding
References
- Frank DN, St Amand AL, Feldman RA, Boedeker EC, Harpaz N, Pace NR. Molecular-phylogenetic characterization of microbial community imbalances in human inflammatory bowel diseases. Proc Natl Acad Sci U S A. 2007;104:13780–13785. doi:10.1073/pnas.0706625104.
- Ley RE, Turnbaugh PJ, Klein S, Gordon JI. Microbial ecology: human gut microbes associated with obesity. Nature. 2006;444:1022–1023. doi:10.1038/4441022a.
- Duvallet C, Gibbons SM, Gurry T, Irizarry RA, Alm EJ. Meta-analysis of gut microbiome studies identifies disease-specific and shared responses. Nat Commun. 2017;8:1784. doi:10.1038/s41467-017-01973-8.
- He Y, Wu W, Zheng HM, Li P, McDonald D, Sheng HF, Chen MX, Chen ZH, Ji GY, Zheng ZD, et al. Regional variation limits applications of healthy gut microbiome reference ranges and disease models. Nat Med. 2018;24:1532–1535. doi:10.1038/s41591-018-0164-x.
- Greenhalgh K, Meyer KM, Aagaard KM, Wilmes P. The human gut microbiome in health: establishment and resilience of microbiota over a lifetime. Environ Microbiol. 2016;18:2103–2116. doi:10.1111/1462-2920.13318.
- Aagaard K, Stewart CJ, Chu D. Una destinatio, viae diversae: does exposure to the vaginal microbiota confer health benefits to the infant, and does lack of exposure confer disease risk? EMBO Rep. 2016;17:1679–1684. doi:10.15252/embr.201643483.
- Backhed F, Roswall J, Peng Y, Feng Q, Jia H, Kovatcheva-Datchary P, Li Y, Xia Y, Xie H, Zhong H, et al. Dynamics and stabilization of the human gut microbiome during the first year of life. Cell Host Microbe. 2015;17:852. doi:10.1016/j.chom.2015.05.012.
- Baumann-Dudenhoeffer AM, D’Souza AW, Tarr PI, Warner BB, Dantas G. Infant diet and maternal gestational weight gain predict early metabolic maturation of gut microbiomes. Nat Med. 2018;24:1822–1829. doi:10.1038/s41591-018-0216-2.
- Laursen MF, Andersen LB, Michaelsen KF, Molgaard C, Trolle E, Bahl MI, Licht TR. Infant gut microbiota development is driven by transition to family foods independent of maternal obesity. mSphere. 2016;1. doi:10.1128/mSphere.00069-15.
- Stewart CJ, Ajami NJ, O’Brien JL, Hutchinson DS, Smith DP, Wong MC, Ross MC, Lloyd RE, Doddapaneni H, Metcalf GA, et al. Temporal development of the gut microbiome in early childhood from the TEDDY study. Nature. 2018;562:583–588. doi:10.1038/s41586-018-0617-x.
- Yassour M, Vatanen T, Siljander H, Hamalainen AM, Harkonen T, Ryhanen SJ, Franzosa EA, Vlamakis H, Huttenhower C, Gevers D, et al. Natural history of the infant gut microbiome and impact of antibiotic treatment on bacterial strain diversity and stability. Sci Transl Med. 2016;8:343ra81. doi:10.1126/scitranslmed.aad0917.
- Falony G, Joossens M, Vieira-Silva S, Wang J, Darzi Y, Faust K, Kurilshikov A, Bonder MJ, Valles-Colomer M, Vandeputte D, et al. Population-level analysis of gut microbiome variation. Science. 2016;352:560–564. doi:10.1126/science.aad3503.
- Jackson MA, Verdi S, Maxan ME, Shin CM, Zierer J, Bowyer RCE, Martin T, Williams FMK, Menni C, Bell JT, et al. Gut microbiota associations with common diseases and prescription medications in a population-based cohort. Nat Commun. 2018;9:2655. doi:10.1038/s41467-018-05184-7.
- Zhernakova A, Kurilshikov A, Bonder MJ, Tigchelaar EF, Schirmer M, Vatanen T, Mujagic Z, Vila AV, Falony G, Vieira-Silva S, et al. Population-based metagenomics analysis reveals markers for gut microbiome composition and diversity. Science. 2016;352:565–569. doi:10.1126/science.aad3369.
- Bonder MJ, Kurilshikov A, Tigchelaar EF, Mujagic Z, Imhann F, Vila AV, Deelen P, Vatanen T, Schirmer M, Smeekens SP, et al. The effect of host genetics on the gut microbiome. Nat Genet. 2016;48:1407–1412. doi:10.1038/ng.3663.
- Goodrich JK, Davenport ER, Beaumont M, Jackson MA, Knight R, Ober C, Spector TD, Bell JT, Clark AG, Ley RE. Genetic determinants of the gut microbiome in UK twins. Cell Host Microbe. 2016;19:731–743. doi:10.1016/j.chom.2016.04.017.
- Goodrich JK, Waters JL, Poole AC, Sutter JL, Koren O, Blekhman R, Beaumont M, Van Treuren W, Knight R, Bell JT, et al. Human genetics shape the gut microbiome. Cell. 2014;159:789–799. doi:10.1016/j.cell.2014.09.053.
- Rothschild D, Weissbrod O, Barkan E, Kurilshikov A, Korem T, Zeevi D, Costea PI, Godneva A, Kalka IN, Bar N, et al. Environment dominates over host genetics in shaping human gut microbiota. Nature. 2018;555:210–215. doi:10.1038/nature25973.
- Turpin W, Espin-Garcia O, Xu W, Silverberg MS, Kevans D, Smith MI, Guttman DS, Griffiths A, Panaccione R, Otley A, et al. Association of host genome with intestinal microbial composition in a large healthy cohort. Nat Genet. 2016;48:1413–1417. doi:10.1038/ng.3693.
- Ayeni FA, Biagi E, Rampelli S, Fiori J, Soverini M, Audu HJ, Cristino S, Caporali L, Schnorr SL, Carelli V, et al. Infant and adult gut microbiome and metabolome in rural bassa and urban settlers from Nigeria. Cell Rep. 2018;23:3056–3067. doi:10.1016/j.celrep.2018.05.018.
- Gomez A, Petrzelkova KJ, Burns MB, Yeoman CJ, Amato KR, Vlckova K, Modry D, Todd A, Jost Robinson CA, Remis MJ, et al. Gut microbiome of coexisting BaAka pygmies and Bantu reflects gradients of traditional subsistence patterns. Cell Rep. 2016;14:2142–2153. doi:10.1016/j.celrep.2016.02.013.
- Martinez I, Stegen JC, Maldonado-Gomez MX, Eren AM, Siba PM, Greenhill AR, Walter J. The gut microbiota of rural Papua New Guineans: composition, diversity patterns, and ecological processes. Cell Rep. 2015;11:527–538. doi:10.1016/j.celrep.2015.03.049.
- Rampelli S, Schnorr SL, Consolandi C, Turroni S, Severgnini M, Peano C, Brigidi P, Crittenden AN, Henry AG, Candela M. Metagenome sequencing of the Hadza hunter-gatherer gut microbiota. Curr Biol. 2015;25:1682–1693. doi:10.1016/j.cub.2015.04.055.
- Vangay P, Johnson AJ, Ward TL, Al-Ghalith GA, Shields-Cutler RR, Hillmann BM, Lucas SK, Beura LK, Thompson EA, Till LM, et al. US immigration Westernizes the human gut microbiome. Cell. 2018;175:962–972 e10. doi:10.1016/j.cell.2018.10.029.
- Magne F, O’Ryan ML, Vidal R, Farfan M. The human gut microbiome of Latin America populations: a landscape to be discovered. Curr Opin Infect Dis. 2016;29:528–537. doi:10.1097/QCO.0000000000000300.
- Caballero B, Vorkoper S, Anand N, Rivera JA. Preventing childhood obesity in Latin America: an agenda for regional research and strategic partnerships. Obes Rev. 2017;18(Suppl 2):3–6. doi:10.1111/obr.v18.S2.
- The Lancet Diabetes E. Obesity prevention in Latin America: now is the time. Lancet Diabetes Endocrinol. 2014;2:263. doi:10.1016/S2213-8587(14)70079-8.
- de la Cuesta-zuluaga J, Corrales-Agudelo V, Velasquez-Mejia EP, Carmona JA, Abad JM, Escobar JS. Gut microbiota is associated with obesity and cardiometabolic disease in a population in the midst of Westernization. Sci Rep. 2018;8:11356. doi:10.1038/s41598-018-29687-x.
- Fujio-Vejar S, Vasquez Y, Morales P, Magne F, Vera-Wolf P, Ugalde JA, Navarrete P, Gotteland M. The gut microbiota of healthy Chilean subjects reveals a high abundance of the phylum Verrucomicrobia. Front Microbiol. 2017;8:1221. doi:10.3389/fmicb.2017.01221.
- Stagaman K, Cepon-Robins TJ, Liebert MA, Gildner TE, Urlacher SS, Madimenos FC, Guillemin K, Snodgrass JJ, Sugiyama LS, Bohannan BJM. Market integration predicts human gut microbiome attributes across a gradient of economic development. mSystems. 2018;3. doi:10.1128/mSystems.00122-17.
- Bai J, Hu Y, Bruner DW. Composition of gut microbiota and its association with body mass index and lifestyle factors in a cohort of 7-18 years old children from the American gut project. Pediatr Obes. 2018. doi:10.1111/ijpo.12480.
- Nakayama J, Watanabe K, Jiang J, Matsuda K, Chao SH, Haryono P, La-Ongkham O, Sarwoko MA, Sujaya IN, Zhao L, et al. Diversity in gut bacterial community of school-age children in Asia. Sci Rep. 2015;5:8397. doi:10.1038/srep08397.
- Zhong H, Penders J, Shi Z, Ren H, Cai K, Fang C, Ding Q, Thijs C, Blaak EE, Stehouwer CDA, et al. Impact of early events and lifestyle on the gut microbiota and metabolic phenotypes in young school-age children. Microbiome. 2019;7:2. doi:10.1186/s40168-018-0608-z.
- Moran-Ramos S, Ocampo-Medina E, Gutierrez-Aguilar R, Macias-Kauffer L, Villamil-Ramirez H, Lopez-Contreras BE, Leon-Mimila P, Vega-Badillo J, Gutierrez-Vidal R, Villarruel-Vazquez R, et al. An amino acid signature associated with obesity predicts 2-year risk of hypertriglyceridemia in school-age children. Sci Rep. 2017;7:5607. doi:10.1038/s41598-017-05765-4.
- Tanner JM. Growth and maturation during adolescence. Nutr Rev. 1981;39:43–55. doi:10.1111/j.1753-4887.1981.tb06734.x.
- Expert Panel on Integrated Guidelines for Cardiovascular H, Risk Reduction in C, Adolescents, National Heart L, Blood I. Expert panel on integrated guidelines for cardiovascular health and risk reduction in children and adolescents: summary report. Pediatr. 2011;128(Suppl 5):S213–56. doi:10.1542/peds.2009-2107C.
- Lopez-Contreras BE, Moran-Ramos S, Villarruel-Vazquez R, Macias-Kauffer L, Villamil-Ramirez H, Leon-Mimila P, Vega-Badillo J, Sanchez-Munoz F, Llanos-Moreno LE, Canizalez-Roman A, et al. Composition of gut microbiota in obese and normal-weight Mexican school-age children and its association with metabolic traits. Pediatr Obes. 2018;13:381–388. doi:10.1111/ijpo.v13.6.
- Faust K, Raes J. Microbial interactions: from networks to models. Nat Rev Microbiol. 2012;10:538–550. doi:10.1038/nrmicro2832.
- Arumugam M, Raes J, Pelletier E, Le Paslier D, Yamada T, Mende DR, Fernandes GR, Tap J, Bruls T, Batto JM, et al. Enterotypes of the human gut microbiome. Nature. 2011;473:174–180. doi:10.1038/nature09944.
- Claesson MJ, Jeffery IB, Conde S, Power SE, O’Connor EM, Cusack S, Harris HM, Coakley M, Lakshminarayanan B, O’Sullivan O, et al. Gut microbiota composition correlates with diet and health in the elderly. Nature. 2012;488:178–184. doi:10.1038/nature11319.
- Maruvada P, Leone V, Kaplan LM, Chang EB. The human microbiome and obesity: moving beyond associations. Cell Host Microbe. 2017;22:589–599. doi:10.1016/j.chom.2017.10.005.
- Liu H, Chen X, Hu X, Niu H, Tian R, Wang H, Pang H, Jiang L, Qiu B, Chen X, et al. Alterations in the gut microbiome and metabolism with coronary artery disease severity. Microbiome. 2019;7:68. doi:10.1186/s40168-019-0683-9.
- Lynch SV, Pedersen O. The human intestinal microbiome in health and disease. N Engl J Med. 2016;375:2369–2379. doi:10.1056/NEJMra1600266.
- Del Chierico F, Abbatini F, Russo A, Quagliariello A, Reddel S, Capoccia D, Caccamo R, Ginanni Corradini S, Nobili V, De Peppo F, et al. Gut microbiota markers in obese adolescent and adult patients: age-dependent differential patterns. Front Microbiol. 2018;9:1210. doi:10.3389/fmicb.2018.01210.
- Schmidt TSB, Raes J, Bork P. The human gut Microbiome: from association to modulation. Cell. 2018;172:1198–1215. doi:10.1016/j.cell.2018.02.044.
- Liang C, Tseng HC, Chen HM, Wang WC, Chiu CM, Chang JY, Lu KY, Weng SL, Chang TH, Chang CH, et al. Diversity and enterotype in gut bacterial community of adults in Taiwan. BMC Genomics. 2017;18:932. doi:10.1186/s12864-016-3261-6.
- Smits SA, Leach J, Sonnenburg ED, Gonzalez CG, Lichtman JS, Reid G, Knight R, Manjurano A, Changalucha J, Elias JE, et al. Seasonal cycling in the gut microbiome of the Hadza hunter-gatherers of Tanzania. Science. 2017;357:802–806. doi:10.1126/science.aan4834.
- He Y, Wu W, Wu S, Zheng HM, Li P, Sheng HF, Chen MX, Chen ZH, Ji GY, Zheng ZD, et al. Linking gut microbiota, metabolic syndrome and economic status based on a population-level analysis. Microbiome. 2018;6:172. doi:10.1186/s40168-018-0557-6.
- Ruel MT. Operationalizing dietary diversity: a review of measurement issues and research priorities. J Nutr. 2003;133:3911S–3926S. doi:10.1093/jn/133.11.3911S.
- Kundu P, Blacher E, Elinav E, Pettersson S. Our gut microbiome: the evolving inner self. Cell. 2017;171:1481–1493. doi:10.1016/j.cell.2017.11.024.
- Hill CJ, Lynch DB, Murphy K, Ulaszewska M, Jeffery IB, O’Shea CA, Watkins C, Dempsey E, Mattivi F, Tuohy K, et al. Evolution of gut microbiota composition from birth to 24 weeks in the INFANTMET cohort. Microbiome. 2017;5:4. doi:10.1186/s40168-016-0213-y.
- Sawyer SM, Afifi RA, Bearinger LH, Blakemore SJ, Dick B, Ezeh AC, Patton GC. Adolescence: a foundation for future health. Lancet. 2012;379:1630–1640. doi:10.1016/S0140-6736(12)60072-5.
- Moore AM, Patel S, Forsberg KJ, Wang B, Bentley G, Razia Y, Qin X, Tarr PI, Dantas G. Pediatric fecal microbiota harbor diverse and novel antibiotic resistance genes. PLoS One. 2013;8:e78822. doi:10.1371/journal.pone.0078822.
- Falony G, Vieira-Silva S, Raes J. Richness and ecosystem development across faecal snapshots of the gut microbiota. Nat Microbiol. 2018;3:526–528. doi:10.1038/s41564-018-0143-5.
- Bello MGD, Knight R, Gilbert JA, Blaser MJ. Preserving microbial diversity. Science. 2018;362:33–34. doi:10.1126/science.aau8816.
- Lozupone CA, Stombaugh JI, Gordon JI, Jansson JK, Knight R. Diversity, stability and resilience of the human gut microbiota. Nature. 2012;489:220–230. doi:10.1038/nature11550.
- Del Chierico F, Nobili V, Vernocchi P, Russo A, Stefanis C, Gnani D, Furlanello C, Zandona A, Paci P, Capuani G, et al. Gut microbiota profiling of pediatric nonalcoholic fatty liver disease and obese patients unveiled by an integrated meta-omics-based approach. Hepatology. 2017;65:451–464. doi:10.1002/hep.v65.2.
- Fu J, Bonder MJ, Cenit MC, Tigchelaar EF, Maatman A, Dekens JA, Brandsma E, Marczynska J, Imhann F, Weersma RK, et al. The gut microbiome contributes to a substantial proportion of the variation in blood lipids. Circ Res. 2015;117:817–824. doi:10.1161/CIRCRESAHA.115.306807.
- Hu HJ, Park SG, Jang HB, Choi MK, Park KH, Kang JH, Park SI, Lee HJ, Cho SH. Obesity alters the microbial community profile in Korean adolescents. PLoS One. 2015;10:e0134333. doi:10.1371/journal.pone.0134333.
- Le Chatelier E, Nielsen T, Qin J, Prifti E, Hildebrand F, Falony G, Almeida M, Arumugam M, Batto JM, Kennedy S, et al. Richness of human gut microbiome correlates with metabolic markers. Nature. 2013;500:541–546. doi:10.1038/nature12506.
- Pallister T, Jackson MA, Martin TC, Glastonbury CA, Jennings A, Beaumont M, Mohney RP, Small KS, MacGregor A, Steves CJ, et al. Untangling the relationship between diet and visceral fat mass through blood metabolomics and gut microbiome profiling. Int J Obes (Lond). 2017;41:1106–1113. doi:10.1038/ijo.2017.70.
- Jackson MA, Bonder MJ, Kuncheva Z, Zierer J, Fu J, Kurilshikov A, Wijmenga C, Zhernakova A, Bell JT, Spector TD, et al. Detection of stable community structures within gut microbiota co-occurrence networks from different human populations. PeerJ. 2018;6:e4303. doi:10.7717/peerj.4303.
- Biagi E, Franceschi C, Rampelli S, Severgnini M, Ostan R, Turroni S, Consolandi C, Quercia S, Scurti M, Monti D, et al. Gut microbiota and extreme longevity. Curr Biol. 2016;26:1480–1485. doi:10.1016/j.cub.2016.04.016.
- Koppel N, Maini Rekdal V, Balskus EP. Chemical transformation of xenobiotics by the human gut microbiota. Science. 2017;356. doi:10.1126/science.aag2770.
- Spanogiannopoulos P, Bess EN, Carmody RN, Turnbaugh PJ. The microbial pharmacists within us: a metagenomic view of xenobiotic metabolism. Nat Rev Microbiol. 2016;14:273–287. doi:10.1038/nrmicro.2016.17.
- Claus SP, Ellero SL, Berger B, Krause L, Bruttin A, Molina J, Paris A, Want EJ, de Waziers I, Cloarec O, et al. Colonization-induced host-gut microbial metabolic interaction. MBio. 2011;2:e00271–10. doi:10.1128/mBio.00271-10.
- Clavel T, Desmarchelier C, Haller D, Gerard P, Rohn S, Lepage P, Daniel H. Intestinal microbiota in metabolic diseases: from bacterial community structure and functions to species of pathophysiological relevance. Gut Microbes. 2014;5:544–551. doi:10.4161/gmic.29331.
- Barlow SE, Expert C. Expert committee recommendations regarding the prevention, assessment, and treatment of child and adolescent overweight and obesity: summary report. Pediatrics. 2007;120(Suppl 4):S164–92. doi:10.1542/peds.2007-2329C.
- National High Blood Pressure Education Program Working Group on High Blood Pressure in C, Adolescents. The fourth report on the diagnosis, evaluation, and treatment of high blood pressure in children and adolescents. Pediatrics. 2004;114:555–576. doi:10.1542/peds.114.2.S2.555.
- de Ferranti SD, Gauvreau K, Ludwig DS, Neufeld EJ, Newburger JW, Rifai N. Prevalence of the metabolic syndrome in American adolescents: findings from the Third National Health and Nutrition Examination Survey. Circulation 2004;110:2494–2497. doi:10.1161/01.CIR.0000145117.40114.C7.
- Hernandez-Avila M, Romieu I, Parra S, Hernandez-Avila J, Madrigal H, Willett W. Validity and reproducibility of a food frequency questionnaire to assess dietary intake of women living in Mexico City. Salud Publica Mex. 1998;40:133–140. doi:10.1590/S0036-36341998000200005.
- Flores M, Macias N, Rivera M, Lozada A, Barquera S, Rivera-Dommarco J, Tucker KL. Dietary patterns in Mexican adults are associated with risk of being overweight or obese. J Nutr. 2010;140:1869–1873. doi:10.3945/jn.110.121533.
- Newby PK, Weismayer C, Akesson A, Tucker KL, Wolk A. Long-term stability of food patterns identified by use of factor analysis among Swedish women. J Nutr. 2006;136:626–633. doi:10.1093/jn/136.3.626.
- Willett WC, Howe GR, Kushi LH. Adjustment for total energy intake in epidemiologic studies. Am J Clin Nutr. 1997;65:1220S–1228S. discussion 1229S-1231S. doi:10.1093/ajcn/65.4.1220S.
- Caporaso JG, Kuczynski J, Stombaugh J, Bittinger K, Bushman FD, Costello EK, Fierer N, Pena AG, Goodrich JK, Gordon JI, et al. QIIME allows analysis of high-throughput community sequencing data. Nat Methods. 2010;7:335–336. doi:10.1038/nmeth.f.303.
- Caporaso JG, Lauber CL, Walters WA, Berg-Lyons D, Huntley J, Fierer N, Owens SM, Betley J, Fraser L, Bauer M, et al. Ultra-high-throughput microbial community analysis on the Illumina HiSeq and MiSeq platforms. Isme J. 2012;6:1621–1624. doi:10.1038/ismej.2012.8.
- Odamaki T, Kato K, Sugahara H, Hashikura N, Takahashi S, Xiao JZ, Abe F, Osawa R. Age-related changes in gut microbiota composition from newborn to centenarian: a cross-sectional study. BMC Microbiol. 2016;16:90. doi:10.1186/s12866-016-0708-5.
- Benjamini Y, Hochberg Y. Controlling the false discovery rate: a practical and powerful approach to multiple testing. J R Stat Soc Series B (Methodol). 1995;57:289–300. doi:10.1111/rssb.1995.57.issue-1.
- Menni C, Jackson MA, Pallister T, Steves CJ, Spector TD, Valdes AM. Gut microbiome diversity and high-fibre intake are related to lower long-term weight gain. Int J Obes (Lond). 2017;41:1099–1105. doi:10.1038/ijo.2017.66.