
ABSTRACT
Microbial dysbiosis is an established finding in patients with inflammatory bowel disease (IBD), but host-microbial interactions are poorly understood. We aimed to unravel the effect of microbiota exposure on intestinal epithelial cells. Confluent Transwell® organoid monolayers of eight UC patients and eight non-IBD controls were co-cultured for six hours with microbiota (3x10⁸ cells) of UC patients or a healthy volunteer (HV), in the presence or absence of an inflammatory cytokine mix. Transepithelial electrical resistance (TEER), fluorescein isothiocyanate (FITC) dextran measurements, and RNA sequencing were performed on epithelial cells, and 16S rRNA sequencing on microbiota samples before and after co-culture. Transcriptomic response following microbiota exposure was not different between epithelial cells from UC patients or non-IBD controls. Following UC microbiota exposure, but not HV microbiota, a strong decrease in epithelial barrier integrity was observed in both UC and HV epithelial cells by TEER and FITC dextran measurements. Exposure of inflamed epithelium to UC microbiota induced transcriptomic stress pathways including activation of EGR1, MAPK and JAK/STAT signaling, as well as AP-1 family and FOSL transcripts. Stress responses after HV microbiota stimulation were milder. We conclude that not the epithelial cell origin (UC versus non-IBD) but the microbial donor drives transcriptomic responses, as exposure to UC microbiota was sufficient to induce stress responses in all epithelial cells. Further research on therapies to restore the microbial balance, to remove the constant trigger of dysbiosis, is required.
Graphical abstract

1. Introduction
Inflammatory bowel disease (IBD) is a chronic inflammatory disorder of the gastrointestinal (GI) tract of unknown etiology and comprises two main entities, Crohn’s disease (CD) and ulcerative colitis (UC). In addition to a complex interplay between genetic predisposition, environmental factors and a dysregulated immune system, alterations in the gut microbiota have been associated with the onset and exacerbation of IBD.Citation1
A symbiotic microbiota is essential for vitamin and iron metabolism, immune maturation, epithelial barrier function, pathogen displacement and metabolic homeostasis. Alterations in the microbiota composition, classically called “dysbiosis”, have been linked to multiple disorders including IBD.Citation2,Citation3
The correlation between the gut microbiota and IBD has been highlighted in preclinical models in which inflammation could not develop in germ-free mice.Citation4 In contrast, transplantation of microbiota from colitis mice to wild-type mice promoted an inflammatory phenotype.Citation5 Human studies furthermore underscore the importance of the microbiome in triggering inflammation as fecal stream diversion following ileocolonic resection prevents early recurrence of Crohn’s disease.Citation6,Citation7 Compared to a healthy population, the shift in microbiota of IBD patients is characterized by a decrease in both biodiversity and richness.Citation8–10 Although dysbiosis in UC patients has been demonstrated repeatedly, effects on intestinal epithelial cells are not understood.
Interactions between microbiota and host take place at the intestinal epithelium. In homeostatic conditions, the intestinal epithelial layer forms a tight physical and chemical protective barrier, preventing contact of harmful bacteria and toxic agents present in the digestive lumen with the underlying tissues. A thick mucus layer is secreted by Goblet cells, while Paneth cells release antimicrobial defensins into this mucus.Citation11 In UC, the mucosal barrier is disrupted, resulting in undesired contact of bacteria with intestinal epithelial cells and invasion in the underlying tissue. This subsequently leads to the recruitment of immune cells to the lamina propria and exacerbates the inflammatory state of the tissue, provoking severe and eventually chronic inflammation.Citation1 Furthermore, persistent alterations in epithelial cells of IBD patients, including alterations in secretory and absorptive functions, and DNA methylations have been observed.Citation12–16
Whether a shift in microbiota is the cause or consequence of IBD remains largely unknown. The implications of host-microbial interactions between epithelial cells and microbiota of different origins, in balance or dysbiosis, needs further elucidation. Furthermore, the role of the host in this response, where epithelial cells of UC patients maintain intrinsic defects, should be unraveled. Therefore, our aim was to evaluate if 1) epithelial cells of UC patients are more sensitive towards microbiota stimulation compared to non-IBD controls and 2) to unravel the effects of microbiota exposure from balanced (healthy volunteer) or microbiota in dysbiosis (UC derived) toward patient specific epithelial cells. In order to do this, an ex vivo human organoid-derived Transwell® model was used.
2. Results
2.1 Patient-derived monolayers maintained patient-specific characteristics
To study interactions between intestinal epithelial cells and microbiota, we used an organoid-derived Transwell® model containing epithelial cells from UC patients or non-IBD controls. To enable the study of active UC, inflammation was (re-) induced in (patient-derived) epithelial monolayers with a previously optimized inflammatory mix.Citation13 Twenty-four hours exposure to an inflammatory cytokine mix of 100 ng/mL TNFα, 20 ng/mL IL1β and 1 µg/mL flagellin resulted in upregulation of inflammatory markers and activation of inflammatory pathways, similar to the observed signature previously reported for organoid cultures (Supplementary Figure 1A-C).Citation13
We compared organoid-derived monolayers from UC patients and non-IBD controls, in presence or absence of the inflammatory cytokine mix. Untreated UC organoid-derived monolayers maintained disease-specific characteristics, compared to non-IBD controls, with more pronounced changes following inflammatory stimulation. Principal component analysis (PCA) did not reveal a clear separation between UC and non-IBD derived monolayers in both non-inflamed and inflamed conditions, but displayed respectively 31 and 118 differentially expressed genes including IBD related characteristics (e.g. HLA-G, TNFRSF12A, CLDN1, MUC2) (Supplementary Figure 2A-D). Thus, patient-specific organoid-derived monolayers enable us to study IBD disease-specific interactions with microbiota, in presence or absence of an inflammatory phenotype, mimicking both UC in an active state and in remission.
2.2 Six hours exposure with 3 × 10⁸ microbial cells was optimal for co-culture with epithelial cells
To determine the optimal concentration and duration for co-culture of intestinal epithelial cells with microbiota, different experimental set-ups were evaluated by gene expression analysis and barrier integrity measurements. Concentrations of microbiota were calculated according to the in vivo used concentration during FMT and the corresponding epithelial surface area in the Transwell® system.Citation17 The organoid-derived epithelial cells in a confluent Transwell® set-up were exposed to increasing concentrations of microbiota of a healthy volunteer (2 x 10⁸, 3 x 10⁸, 5 × 10⁸ and 2 × 10⁹ cells) for 4, 6 and 16 hours.
Sixteen-hour co-culture experiments resulted in degradation of RNA of epithelial cells (Bioanalyzer, data not shown) and a disturbance of the microbiota community, and were therefore not further executed (Supplementary Figure 3A). A microbiota dose-dependent response of inflammatory markers and alterations in TEER measurements was observed with less pronounced effects at 4 hours (, Supplementary Figure 3B). To find an intermediate response between 2 × 10⁸ and 5 × 10⁸ cells, the epithelium was finally exposed to 3 × 10⁸ microbial cells for 6 hours and this set-up was used for follow-up experiments ().
Figure 1. Selection of conditions and barrier integrity measurements. (a-b) TEER measurements (a) and qPCR of inflammatory and tight junctions markers (b) after HV microbiota exposure (2 x 10⁸, 3 x 10⁸, 5 × 10⁸ and 2 × 10⁹ microbial cells) to UC epithelial cells during 4 or 6 hours. (n = 3 for all, except n = 2 for 6 H 2 × 10⁹ cells). (c-d) TEER measurements after 6 hours co-culture with CTRL, UC or HV microbiota (3 x 10⁸ cells) on UC or non-IBD epithelium, without (c) or with inflammatory cytokine mixture stimulation (d). N = 8 for all. (e) 4 kD FITC-dextran (2 mg/mL) permeability assay after 6 hours co-culture with CTRL, UC or HV microbiota (3 x 10⁸ cells) in inflamed epithelial cells. N = 8 for UC epithelium, n = 7 for NON-IBD. TEER is relative percentage compared to measurement start incubation, FITC compared to CTRL condition. CTRL, control; UC, UC microbiota; HV, healthy volunteer microbiota; IF, inflammation; 4 H, 4 hours; 6 H, 6 hours. * p <0.01;** p <0.05; *** p <0.01. Mann-Whitney test (unpaired data) or a Wilcoxon signed rank test (paired data).
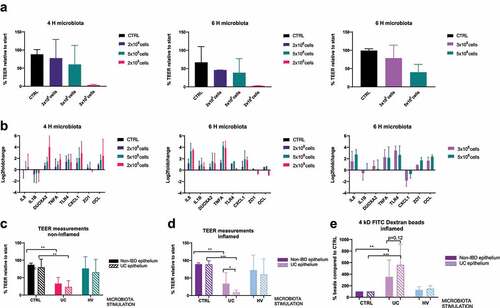
Epithelial cells, with or without prior inflammatory stimulation, were co-cultured for 6 hours with vehicle control or microbial cells (3x10⁸ cells) derived from UC patients or a healthy volunteer. After 6 hours, the integrity of the epithelial barrier showed no significant changes in TEER measurements in control conditions (vehicle control, no microbiota exposure), independent of the presence of inflammation ().
2.3 Exposure to microbiota did not induce a different response between epithelial cells from UC patients and non-IBD controls
In this section, we used transcriptomic analysis and barrier integrity measurements to directly evaluate the difference in host response between epithelial cells from UC patients or non-IBD controls following exposure to microbiota from UC patients or a healthy volunteer. Based on differences in untreated conditions between UC and non-IBD epithelial cells (Graphical abstract A1), we aimed to unravel if epithelial cells of UC patients were more sensitive toward microbiota exposure, compared to non-IBD controls. Monolayers of UC patients and non-IBD controls were exposed to microbiota derived from UC patients with active disease (Graphical abstract A2), or to microbiota of a healthy volunteer (Graphical abstract A3), both in presence or absence of the inflammatory stimuli.
Exposure to UC microbiota induced a clear decrease in epithelial barrier by TEER measurements of both UC and non-IBD epithelial cells, while this response was not observed after exposure of healthy volunteer microbiota (). Exposure to UC microbiota resulted in a significantly greater decrease in TEER of epithelial cells of UC patients compared to epithelial cells of non-IBD controls, if performed in presence of an inflammatory cytokine mix (). Although not significant, further analysis with 4kD FITC-dextran showed a trend for decreased barrier integrity in inflamed conditions ().
For transcriptomic analysis, PCA was driven by the origin of microbial treatment, followed by stimulation with the inflammatory mixture. However, no clear differential response between epithelial cells from UC patients or non-IBD controls exposed to microbiota was seen, whether stimulated with an inflammatory cytokine mix or not, both following UC or healthy volunteer microbiota stimulation ().
Figure 2. UC and HV microbiota stimulation on epithelial cells of UC patients and non-IBD controls. (a-b) Principal component analysis (PCA) of UC and non-IBD epithelium, with and without UC microbiota exposure (a) or healthy volunteer microbiota exposure (b) and with or without prior inflammatory cytokine mixture stimulation. Lines are drawn to indicate different groups. In all samples together, PCA is driven by microbiota stimulation (PC1), followed by inflammatory stimulation (PC2). (c-f) Heatmap showing expression levels of significant DEG (FDR <0.05) between UC and non-IBD epithelial cells in non-inflamed (c) and inflamed (d) conditions after UC microbiota exposure or between UC and non-IBD epithelial cells in non-inflamed (D) and inflamed (e) conditions after HV microbiota exposure. Labels are as following: tissue_exposure; CTRL: control; HV, healthy volunteer; IF, inflammation; NON-IBD, non-IBD control; UC: ulcerative colitis.
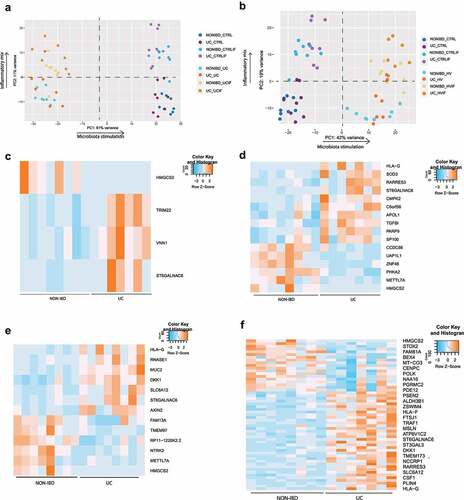
In the non-inflamed setting, exposure to UC microbiota resulted in the identification of 4 differentially expressed genes (FDR <0.05) between UC and non-IBD epithelial cells (). In inflamed conditions, treatment with UC microbiota caused 16 differentially expressed genes including PARP9, TGFBI and CMPK2 (). Seven of these 16 genes were significantly differentially expressed in unexposed conditions, while nine were specifically related to microbiota exposure. These genes were linked to mitochondrial pathways (HMGCS2, CMPK2) and repair of DNA damage (PARP9). However, aside from this limited number of genes, no clear distinct transcriptomic or barrier integrity response could be identified.
Exposure to microbiota from the healthy volunteer did neither result in a major differential response between UC and non-IBD epithelial cells (). In non-inflamed settings, only 13 differentially expressed genes were detected (). For inflamed settings, this increased up to 55 differentially expressed genes including MUC2, RNASE1, TGFBI (), but still remarkably lower than the control condition (no microbiota exposure) in which respectively 31 (non-inflamed) and 118 (inflamed) differentially expressed genes were found. Hence, also for healthy volunteer microbiota, transcriptional changes were driven by microbial exposure and not epithelial origin.
2.4 Co-expression modules were mainly associated with characteristics of untreated epithelial cells
To complement differential gene expression analysis, we used weighted gene co-expression network analysis (WGCNA) to assess clusters of genes with similar expression patterns. Comparison of epithelial cells from UC and non-IBD controls in both inflamed and non-inflamed conditions, resulted in the identification of 11 co-expression clusters ranging in size from 77 to 2015 genes. In absence of microbiota, three clusters significantly correlated with UC non-inflamed epithelium as compared to non-IBD epithelium; of which one cluster significantly correlated with inflamed UC epithelium (turquoise cluster). The significant clusters identified in absence of microbiota were involved in tight junction and integrin signaling, and DNA damage response (BRCA1). The pink cluster was linked to the role of PKR in interferon induction and antiviral responses. In contrast, upon exposure to microbiota from the healthy volunteer only one significant correlation (pink cluster) was identified in inflamed conditions (Supplementary Figure 4). Again, the highest number of involved clusters was detected in the control condition, indicating that differences between UC and non-IBD epithelial cells were mainly driven by baseline characteristics and not induced by exposure to microbiota of UC patients or the healthy volunteer.
2.5 UC microbiota induced a strong response in inflamed epithelial cells, that was not present following HV microbiota exposure
As a second research question, we aimed to analyze host-microbial interactions by studying the effect of different types of microbiota exposure (patient derived vs. healthy volunteer derived) toward epithelial cells (Graphical abstract B). As we did not observe a different transcriptional response between UC and non-IBD epithelial cells, we first analyzed the response in inflamed UC epithelial cells, to mimic active disease. Next, we also confirmed expression of key genes in non-inflamed and non-IBD epithelial cells.
For the first comparison, inflamed epithelial cells from UC patients were exposed to microbiota derived from UC patients with active disease, compared to inflammatory stimulation only (Graphical abstract B1). Barrier integrity measurements (TEER and FITC) showed a strong decrease following stimulation with UC microbiota (). Because of the high number of DEGs (6634 DEG, FDR ≤0.05), a more stringent cutoff (log2FC = 2, FDR ≤ 0.01) for downstream transcriptomic analysis was applied. This way, exposure of UC epithelial cells toward UC microbiota resulted in 354 DEG, including 110 downregulated and 244 upregulated genes, compared to the control condition (). Top upregulated genes included EGR1, FOSL1, FOSB and GEM and top downregulated genes comprised CHP2, SLC26A2, GPR128 and TM4SF20 (Supplementary Figure 5A).
Figure 3. Effect of UC microbiota on inflamed UC epithelial cells. (a) PCA displaying separate clustering between inflamed UC epithelial cells without and with exposure to UC microbiota. (b) Heatmap showing significant differentially expressed up- and downregulated genes (FDR ≤ 0.01 and absolute log2 fold change ≥2) between inflamed UC epithelial cells without and with UC microbiota exposure. (c-e) Functional enrichment analysis showing significant upregulated pathways between inflamed UC epithelial cells without and with exposure to UC microbiota by (c) Gene ontology molecular functions top 15 (d) Gene ontology biological processes top 15 (e) Reactome analysis. Labels are as following: tissue_exposure; CTRL: control; IF, inflammation; UC: ulcerative colitis.
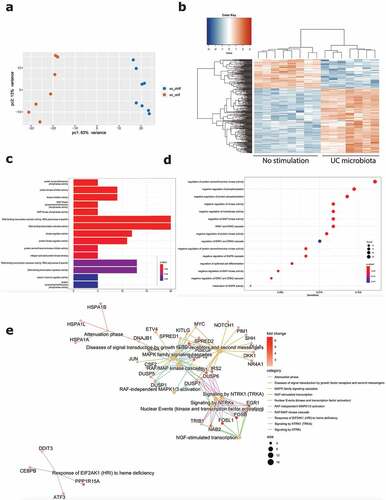
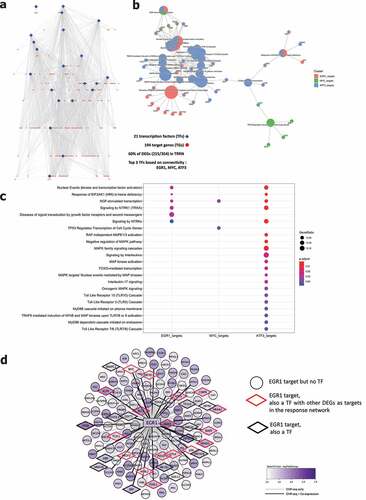
Analysis by gene ontology molecular functions demonstrated activation of molecular mechanisms including kinase inhibitor/regulator activities (e.g. CKS2, SPRY4, CCNE1) and DNA-binding transcription activators (e.g. EGR1, MYC, FOSB, KLF6) (). Gene ontology for biological processes identified negative regulation of multiple protein kinase activities (e.g. DKK1, IRS2, SFN) and enrichment of the MAPK and ERK1 and ERK2 cascade (e.g. ATF3, MYC, CDC6) (). Reactome analysis showed activation of multiple processes involved in the RAF/MAP pathway (e.g. DUSP1, IRS1-2, JUN) signaling by NTRKs (e.g. FOSB, FOSL1, IRS1-2) and nuclear events (e.g. FOSB, FOSL1) (). Evaluation of transcriptional regulators by transcriptional regulatory response network (TRRN) analysis showed 21 involved transcription factors (TFs) modulating expression of 194 target genes (TGs) (). The three major involved TFs (based on connectivity) include EGR1, MYC and ATF3 (). Based on the upregulation of many target genes (>100) including several other transcription factors, EGR1 appears to act as a master regulator mediating the influence of UC microbiota stimulation on epithelial cells ().
Figure 4. Transcriptional regulatory response network following UC microbiota stimulation. (a) Visualization of the transcriptional regulatory response network (TRRN) of UC epithelial cells following UC microbiota exposure. In the network, 21 transcription factors and 194 target genes were identified. Sixty percent of the overall differentially expressed genes are involved in this network. The top 3 transcription factors based on connectivity in the network are EGR1, MYC and ATF3. (b-c) Visualization of functions and pathways in which the top 3 transcription factors are involved. (d) EGR1 acts as a master upregulated by upregulating <101 genes and 32 other transcription factors following UC microbiota exposure on UC epithelial cells. Seventeen of the 32 EGR1 targeted transcription factors also regulated other DEGs in the response network.
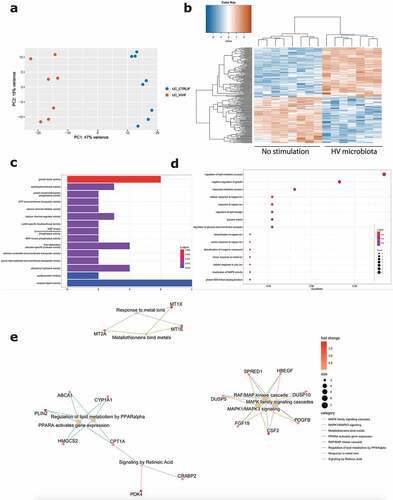
Next, we focused on the effect of exposure to microbiota of a healthy volunteer toward inflamed epithelial cells from UC patients (Graphical abstract B2). Barrier integrity measurements showed no significant decrease following exposure to healthy volunteer microbiota, compared to the control condition without microbiota (). Also transcriptomic analysis demonstrated less pronounced effects with only 196 DEGs (log2FC = 2, FDR ≤0.01; 6093 DEGs with FDR <0.05), including 102 upregulated and 94 downregulated genes (). The top upregulated genes included CSF2, MCF2L2, BCORL1 and ANKRD22, while downregulated genes included IFIT1, CXCL10, SNPH and SEPP1 (Supplementary Figure 5B). While UC microbiota top upregulated genes were UC microbiota specific (Supplementary Figure 5C), top upregulated genes following healthy volunteer microbiota were also observed following UC microbiota exposure and thus not microbiota specific (Supplementary Figure 5D). Moreover, the number of identified pathways was remarkably lower. Gene ontology showed activation of molecular mechanisms including growth factor activity (e.g. CFS2, FGF19), calcium channels and activations of several transmembrane transporters (e.g. PACSIN3, SLC25A42) (). Gene ontology for biological processes illustrated mainly a response toward copper and zinc ions (e.g. MT1E, MT2A), but also glucose import and regulation of lipid storage (e.g. PLIN2, ABCA1) (). In addition, Reactome analysis displayed limited pathways including the RAF/MAP pathway and response to metal ions (e.g. FGF19, CSF2) (). TRRN analysis did not reveal any meaningful results to infer master transcriptional regulators following exposure to microbiota from the healthy volunteer (data not shown).
Figure 5. Effect of healthy volunteer microbiota on inflamed UC epithelial cells. (a) PCA displaying separate clustering between inflamed UC epithelial cells without and with exposure to HV microbiota. (b) Heatmap showing significant differentially expressed up- and downregulated genes (FDR ≤ 0.01 and absolute log2 fold change ≥2) between inflamed UC epithelial cells without and with exposure to healthy volunteer microbiota. (c-e) Functional enrichment analysis showing significant upregulated pathways between inflamed UC epithelial cells without and with exposure to healthy volunteer microbiota by (c) Gene ontology molecular functions top 15 (d) Gene ontology biological processes top 15 (e) Reactome analysis. Labels are as following: tissue_exposure; CTRL: control; IF, inflammation; HV, healthy volunteer; UC: ulcerative colitis.
2.6 Exposure toward microbiota from patients with UC induced a more detrimental effect compared to microbiota of a healthy volunteer
Next, we directly compared the differences between exposure to UC microbiota or microbiota of a healthy volunteer (Graphical abstract B3). Comparison of DEGs in both conditions (both compared to the control condition) showed shared and unique genes to each set. From the DEGs in both conditions (CTRL vs. UC microbiota and CTRL vs. healthy volunteer microbiota), 46 of the upregulated genes and 33 of the downregulated genes were dysregulated in both conditions, while the remaining genes were unique for the type of microbiota used (Supplementary Figure 6A). Reactome pathway analysis showed unique pathways for UC microbiota (e.g. Nuclear events, Attenuation phase) or the healthy volunteer microbiota (e.g. PPARA activated gene expression, regulation of lipid metabolism), as well as shared pathways (Supplementary Figure 6B). Further analysis by additional databases demonstrated activation of the JAK-STAT pathway, GPCR signaling following UC microbiota but not after healthy volunteer exposure (Supplementary Figure 6C).
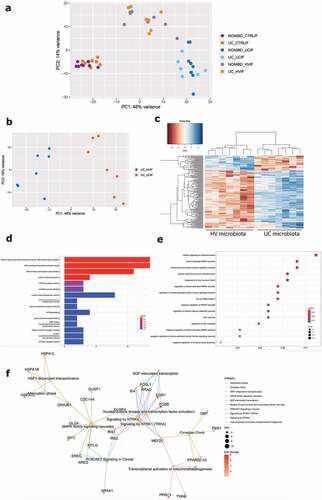
PCA including the control without microbiota exposure, UC microbiota and healthy volunteer microbiota samples showed clustering based on microbial treatment, with healthy volunteer microbiota located between the two extremes (). The direct comparison between exposure to UC or healthy volunteer derived microbiota on UC epithelial cells identified 161 DEG including 128 up- and 33 downregulated genes (). Molecular functions showed higher activation of DNA binding transcription activation (e.g. MYC, NR4A2), misfolded protein binding (e.g. HSPA1A-B) and ATPase activity after exposure toward UC microbiota (). Biological processes gene ontology analysis included multiple cell responses involved in (chemical) stress, tumor necrosis factor, and the MAPK and JNK cascade (e.g. DACT1, CCL20, MYC, CCN2), that were after UC microbiota (). Finally, Reactome analysis showed increased activation of PI3K/AKT signaling, the attenuation phase and activation of mitochondrial biogenesis (e.g. AREG, FOSB, IRS1-2) (), following UC microbiota exposure. Individual inflammatory markers (IL-8, TNF-α, CCL20) were higher expressed after UC microbiota exposure, compared to microbiota from a healthy volunteer (Supplementary Figure 7). We confirmed expression levels of key genes in (non-) inflamed epithelial cells from non-IBD controls and non-inflamed UC epithelial cells, and showed that PCA was driven by microbial treatment, followed by inflammatory stimulation, and not by epithelial origin (Supplementary Figure 8A-B).
Figure 6. Comparison of healthy volunteer microbiota and UC microbiota on epithelial cells. (a) PCA showing clustering driven by microbial treatment, with HV microbiota located between no treatment and UC microbiota. (b) PCA displaying separate clustering between inflamed UC epithelial cells with UC and HV microbiota exposure. (c) Heatmap showing significant differentially expressed up- and downregulated genes (FDR ≤ 0.01 and absolute log2 fold change ≥2) between inflamed UC epithelial cells with UC and HV microbiota exposure. (c-e) Functional enrichment analysis showing significant upregulated pathways between inflamed UC epithelial cells with UC and HV microbiota by (d) Gene ontology molecular functions top 15 (e) Gene ontology biological processes top 15 (f) Reactome analysis. Labels are as following: tissue_exposure; CTRL: control; HV, healthy volunteer; IF, inflammation; NON-IBD, non-IBD control; UC: ulcerative colitis.
2.7 The microbial composition is not influenced by the epithelial cell type
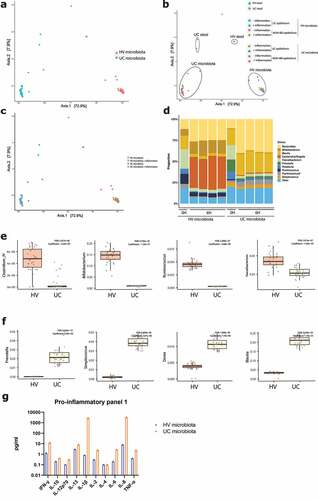
To analyze the microbial community, 16S rRNA sequencing was performed on microbiota samples, before and six hours after co-culture with epithelial cells. Principal coordinates analysis (PCoA) on individual microbial samples was driven by microbial treatment, and not by the co-cultured epithelial cell type (). Neither did inflammation affect the composition of microbial samples (). The composition shifted during the 6 hours of exposure, phyla of interest levels remained high after 6 hours (). We observed higher levels of Ruminococcus, Bifidobacteria, Faecalibacterium and Clostridium IV after 6 hours co-culture in the microbiota from the healthy volunteer, compared to the UC microbiota (). Accordingly, higher levels of Streptococcus, Blautia, Dorea and Prevotella were found in the microbial mix from UC patients after 6 hours (). Protein analysis of pro-inflammatory markers showed higher expression of IL-8 and IL-1β in microbiota samples of UC patients, compared to the healthy volunteer sample ().
Figure 7. 16S rRNA sequencing of microbiota samples before and after co-culture. (a) Principal coordinates analysis (PCoA) showing separate clustering based on microbiota origin (UC, n = 34 and HV microbiota, n = 34). (b) PCoA showing separate clustering of stool samples (UC and HV microbiota, both n = 2) and microbiota after 6 H co-culture (both n = 32). Circles drawn to indicate different treatment groups. (c) PCoA showing no effect of inflammation on microbiota composition. HV ± inflammation, both n = 16 (d) Composition of microbiota samples exposure at genus level. Samples after 6 hours from left to right, NON-IBD epithelium without and with inflammation, UC epithelium without and with inflammation. Stool sample n = 2, after 6 hours n = 8 for all samples. (e) After six hours, microbiota samples of the healthy volunteer show higher levels of Clostridium IV, Bifidobacterium, Ruminococcus and Faecalibacterium. (f) After six hours, microbiota samples of the UC donors show higher levels of Prevotella, Streptococcus, Dorea and Blautia. (g) Analysis of inflammatory markers of microbiota samples from the UC donors and HV prior to epithelial cell exposure by V-PLEX Pro-inflammatory Panel 1. HV, healthy volunteer; IF, inflammation; NON-IBD, non-IBD control; UC: ulcerative colitis; 0 H: 0 hours; 6 H: 6 hours.
3. Discussion
Epithelial cells from UC patients possess intrinsic defects, both in presence or absence of inflammatory stimuli.Citation12,Citation13 In this study, we examined if the epithelium from UC patients is more sensitive toward microbiota stimulation, compared to the epithelium from non-IBD controls. We also studied if different types of microbiota (balanced vs. dysbiosis) exert distinct effects on epithelial cells. Using organoid-derived monolayer cultures, no pronounced difference between the epithelium from UC patients and non-IBD controls after exposure to microbiota (balanced or dysbiosis) was seen. In contrast, compared to stimulation with microbiota from a healthy volunteer, exposure to microbiota from UC patients induced a damaged and stress induced phenotype in inflamed epithelial cells from UC patients. Expression of key genes was also confirmed in (non-) inflamed non-IBD epithelial cells.
FMT is proposed as a novel treatment strategy for patients with UC and several randomized control trials showed promising effects.Citation18–20 To further study mechanisms by which FMT might work, we applied microbiota samples with similar concentrations according to the treated surface. The aerobic setting, required for epithelial survival, limited the time-span of co-culture to six hours but was sufficient to induce major gene expression changes. The current organoid model is associated with its limitations and, for future experiments, models with both aerobic and anoxic chambers, and other cell types should be implement. Still, the combination of patient specific epithelial cells and microbial samples in the current set-up is superior to the use of traditional cell culture models.Citation21 Relative levels of several genera of interest were higher in healthy volunteer samples (e.g. Clostridium IV, Bifidobacterium, Ruminococcus, Faecalibacterium), indicating that also after six hours fecal donor characteristics were conserved. Following six hours co-culture, a relative higher percentage of the facultative anaerobe commensal, Escherichia (E.) coli was observed in healthy volunteer samples. E. coli can survive in aerobic conditions with limited nutrients and can easily adapt to the used culture conditions.Citation22,Citation23 Also in another study that used a co-culture model including an anaerobe compartment, the initial microbial community showed changes over time.Citation24
The inclusion of quantitative microbiome measurements (in addition to relative comparisons), emerged as a major change in the microbiome field.Citation25 Microbiota in dysbiosis from UC patients is associated with lower absolute bacterial cell counts and a decrease in biodiversity and richness.Citation8–10 Due to a much lower absolute microbial cell numbers in UC patients, a higher weight and volume of the original sample was needed to reach the required bacterial cell amount and corrected by equalizing fecal samples in the same volume of diluent. One factor we could hereby not take into account was the absolute numbers and species of fungi, viruses but also fibers and metabolites that can possibly contribute to the read-out. In addition, we found higher levels of IL-8 and IL-1β in the microbiota samples of UC patients, which might possibly contribute to an inflammatory response, although inflammation was previously induced. Furthermore, we analyzed response to one UC microbiota mix thus it should be investigated if this response is triggered by presence of specific phyla in UC microbiota that can potentially be targeted. Further experiments to unravel the role of specific bacterial strains, including mucus-associated bacteria should be performed. Complementary, inflammation may be patient specific and our inflammatory mix might not be representative for every patient. Also, mucus production is observed in these ex vivo monolayers but remains lower compared to the in vivo situation.Citation26 Of note, in UC patients with active disease, this mucus layer is often disrupted leading to contact between epithelial cells and the microbiota.Citation27
We acknowledge that some epithelial characteristics might fade over time during organoid cultures, but an IBD linked gene expression profile was maintained in the model. We observed a larger difference between UC and non-IBD derived organoids and, more pronounced UC specific phenotype, following inflammatory stimulation, and hypothesized that epithelial cells from UC patients were more sensitive toward microbiota stimulation. However, we could not identify a different response between both types of epithelial cells following microbiota stimulation. Conceivably, microbiota exposure, especially from UC patients, overpowers the baseline differences between epithelial cells and is a more important trigger compared to the host. However, it cannot be excluded that, in the presence of other components (e.g. patient specific immune cells), a different response would be observed.
Next, we evaluated direct effects of different types of microbiota on inflamed epithelial cells from UC patients. Exposure to microbiota from UC patients was sufficient to induce damage to the epithelial barrier and activate several stress pathways. Diverse pathways were dysregulated including signaling by NTRK and major activation of RAF/MAP, MAPK signaling and the JAK/STAT pathway following UC microbiota exposure. The top upregulated genes include FOSL1 and FOSB, both belong to the activator protein-1 (AP-1) family, modulated by the MAPK pathway.Citation28 The MAPK pathway activates through phosphorylation specific cellular responses to internal and external stress signals, including phosphorylation of pro-inflammatory proteins, and dysregulation of this pathway is linked to multiple diseases including IBD and tumorigenesis.Citation29–32 Activation of protein kinase inhibitors and regulators was observed after UC microbiota, and is linked to the IBD pathogenesis and microbial processes.Citation31,Citation33 Also, the JAK/STAT pathway is an important therapeutic target in IBD.Citation34 Several of the detected genes are involved in the regulation of intestinal cell apoptosis (ATF3Citation35), intestinal barrier function (SPRY4-IT1Citation36), inflammation and wound repair (DKK1Citation37).
Upon exposure to UC microbiota, EGR1 was identified as master regulator by TRRN analysis and is a transcription factor activated through MAPK signaling, involved in tissue injury, immune responses and modulation of TNF-α.Citation38–41 Dong et al. found increased gene expression and activation levels of EGR1 in biopsies from UC patients, compared to healthy controls.Citation42 Also MYC, another top three transcription factors, was found at higher levels in biopsies from patients with IBD by Macpherson et al. and linked to altered cell cycle control due to inflammatory processes.Citation43
By contrast, exposure to microbiota from a preselected healthy volunteer had milder effects. The top upregulated genes after exposure to healthy volunteer microbiota were also upregulated after UC microbiota, indicating that this is a general microbiota response and not specific to the type of microbiota.
The direct comparison between UC and healthy volunteer microbiota exposure demonstrated increased activation of stress cascades, indicating a higher stress level in epithelial cells when exposed to UC microbiota. Pathways involved in IL-4, −13, −17 signaling and the JNK pathway, a subgroup of MAP kinases, were upregulated. JNK1/2 kinase activity was found to be enriched in the colon of active IBD patients and represents a potential treatment target.Citation32,Citation44
Together, our results show that the type of microbiota, and not the origin of epithelial cells, drives epithelial cell response. Expression of key markers confirmed our findings in non-IBD epithelial cells, and UC epithelial cells without inflammatory stimulation. Although transplantation of microbiota from colitis to wild-type mice,Citation5 or restoration of the fecal stream in patients is sufficient to induce an inflammatory phenotype,Citation6,Citation7 we show that even in the absence of immune cells, exposure of epithelial cells to UC microbiota is sufficient to activate important stress and injury associated pathways, as well as IBD linked genes. Our results suggest that only targeting the immune cell infiltrate may not be sufficient to resolve inflammation, as contact between epithelial cells and microbiota is sufficient to induce stress and injury cascades.
Further research on microbiota modulation, either by FMT, multifunctional bacteria consortia, or other approaches including diets, should be performed to supplement classic treatment option and remove the constant trigger of dysbiosis. Combining conventional therapies (resolving inflammation), and restoration of microbiota will possibly lead to a prolonged maintenance of a balanced microbiota and overall homeostasis. How this should be reached remains one of the major IBD-related research questions in the coming years.
4. Material and methods
4.1 Patient biopsy collection
Eight non-IBD controls and eight patients diagnosed with active UC, classified as an endoscopic Mayo subscore of ≥2 but with an accessible margin between macroscopically inflamed and non-inflamed mucosa, were included at the University Hospitals Leuven (Leuven, Belgium). Fresh mucosal biopsies from non-inflamed colon segments were collected during routine endoscopy. Non-IBD controls underwent endoscopic evaluation for polyp screening or nonspecific gastrointestinal complaints, but did not have any macroscopic abnormalities. Baseline characteristics of UC patients, non-IBD controls and organoids are given in Supplementary table 1. The diagnosis of UC was based on ECCO-ESGAR guidelines for IBD.Citation45 Fresh fecal samples were collected from two patients within this cohort, as well as one healthy volunteer (selection criteria described below). The study was approved by the ethical committee of the University Hospitals Leuven (S53684 and S59525), and all patients gave written informed consent prior to sample collection. All authors had access to the study data and had reviewed and approved the final manuscript.
4.2 Processing of fecal samples
Fresh samples of a preselected healthy volunteer and two UC patients were stored at 4°C including an anaerobic patch and processed within five hours in a Whitley A35 Anaerobic Workstation. All weighted samples were dissolved in 0.9% saline, mixed with a magnetic stirrer, filtered using a Minisart syringe filter (5 µm). Next, the cells were counted using flow cytometry (BD AccuriTM C6) and diluted until 1010 bacterial cells/mL. The sample was supplemented with 10% glycerol and frozen at −80°C until further use.
The asymptomatic healthy volunteer was selected on high microbial load, and presence of phyla of interest.Citation46 Exclusion criteria included active smoking, antibiotic use in the past three months, any medical history, increased inflammation markers, the presence of enteric pathogens and familial history of IBD. The applied UC microbiota was a mix of three fecal samples from two distinct patients with active disease (Supplementary table 1) and classified as Bristol 6–7, linked to low bacterial abundance.Citation25,Citation47 Three UC samples were combined into one mix, to prevent a specific patient related species specific response, and an absolute higher weight of UC samples was required to obtain the same cell count as for the healthy volunteer. For optimization experiments (concentration and duration co-culture), another pre-screened healthy volunteer was used.
4.3 Crypt isolation, organoid and Transwell® culturing
Crypts were isolated, expanded as organoids and cultured as Transwell® cultures as described before.Citation13,Citation48 Further information can be found in the supplementary material and methods.
4.4 Co-culture microbial and epithelial cells
Inflammation was re-induced in confluent Transwell® cultures, 24 hours prior to microbiota co-culture, if applicable. Transwells® were exposed to 100 ng/mL TNFα (Invivogen, San Diego, California), 20 ng/mL IL1β (Peprotech, London, UK) and 1 µg/mL flagellin (tlrl-stfla, Invivogen), similar to previous organoid experiments.Citation13 Twenty-four hours later, cultures were washed three times with BM without antibiotics before the microbiota suspension (apical compartment) and – if applicable – the inflammatory cytokine mix (basolateral compartment) were added for six hours at 37°C and 5% CO2. Cells were stimulated with 3 × 10⁸ microbial cells or vehicle control (70 µl 0.9% NaCl and 230 µl BM without antibiotics). After six hours co-culture, TEER was remeasured. All cultures were washed three times with BM including penicillin and streptomycin. Cultures were used either for 1) hematoxylin and eosin staining 2) FITC-dextran (4 kD) permeability measurements, or 3) RNA extraction. These procedures are described in supplementary material and methods.
4.5 RNA sequencing
RNA libraries were prepared with TruSeq Stranded mRNA library kit (Illumina, California, USA) and sequenced by Illumina HiSeq4000 (Illumina), with an average sequencing depth of 23 million reads per sample. Three samples had to be excluded due to low quality reads (Supplementary table 2). RNA-seq data have been deposited in the ArrayExpress database at EMBL-EBI (www.ebi.ac.uk/arrayexpress) under accession number E-MTAB-10832.
4.6 Differential expression and functional enrichment analysis
Alignment of raw RNA-sequencing data to the human reference genome hg19 was performed through HISAT2, absolute counts were generated using HTSeq count v0.5.3p3. Only protein coding genes (as per GENCODE annotation – release 30 GRCh38.p12),Citation49 were considered. Only genes with greater than 10 counts in at least 80% of samples corresponding to the compared conditions were considered for further analysis. Post-normalization, differential expression analysis was performed using DESeq2.Citation50
Genes with FDR ≤ 0.05 (epithelial cell comparison) were considered to be differentially expressed genes (DEG). For microbiota comparison, a more stringent cutoff (FDR ≤ 0.01 and absolute log2 fold change ≥2) was applied due to the high number of DEG. Pathway analysis was performed in Ingenuity Pathway Analysis (QIAGEN Inc., https://www.qiagenbioinformatics.com/products/ingenuity-pathway-analysis,Citation51 on differentially expressed genes (FDR <0.05). Additionally, functional enrichment analysis of DEGs was performed using clusterProfilerCitation52 and ReactomePACitation53 packages. Enrichment events (FDR ≤ 0.1) corresponding to gene sets with at least 10 genes were considered statistically significant. WGCNA, additional functional enrichment analysis and Regulatory network construction are described in the supplementary material and methods.
4.7 16S rRNA sequencing
16S rRNA sequencing of microbial samples was performed before and after co-culture with epithelial cells and is described in the supplementary material and methods.
4.8 Mesoscale analysis
Levels of pro-inflammatory markers were measured in the microbiota samples using the V-PLEX Pro-inflammatory Panel 1 (human) Kit (Meso Scale Discovery, Rockville, MD) according to the manufacturer’s protocol. A 2-fold dilution of the applied microbiota samples (3x10⁸ cells in 70 µl) was measured on the Meso Scale Discovery (MSD) QuickPlex SQ120 M instrument and evaluated on the MSD software platform.
4.9 Statistics
Statistical analysis was performed with GraphPad Prism 9 software (San Diego, California, USA) and RStudio 4.0.4 (The R foundation, Vienna, Austria). All displayed significance values for RNA sequencing are adjusted p-values (FDR value) unless stated otherwise. TEER measurements were analyzed by a Mann-Whitney test (unpaired data) or a Wilcoxon signed rank test (paired data). Continuous variables on graphs were expressed as median and interquartile range (IQR).
Abbreviations
ADJ p value Adjusted p-value; BM Basal medium; CTRL Control; CXCL Chemokine (C-X-C motif) ligand; DEG Differentially expressed genes; FDR False discovery rate; FITC Fluorescein isothiocyanate; FMT Faecal microbiota transplantation; HM Human expansion medium; INF Inflamed; IQR Interquartile range; ISC Intestinal stem cells; NA Not applicable; NON-INF Non-inflamed; NS Not significant; PCA Principal component analysis; PCoA Principal coordinates analysis; RPS14 Ribosomal protein S14; RTqPCR Real-time quantitative polymerase chain reaction; TEER Transepithelial electrical resistance; TNF Tumor necrosis factor; TRRN Transcriptional regulatory response network; WGNCA Weighted gene co-expression network analysis; 16S rRNA 16S ribosomal RNA.
Transcript profiling
EMBL-EBI ArrayExpress database (www.ebi.ac.uk/arrayexpress) under accession number E-MTAB-10832.
Author contributions
KA: study concept and design, data acquisition, data analysis and interpretation, manuscript writing; PS, SaV: data analysis and interpretation, critical revision of the manuscript; SP, CL: data acquisition, critical revision of the manuscript; JS: study concept and design, data analysis and interpretation and critical revision of the manuscript; CC, BV, JR, SV, CV: study concept and design, data interpretation and critical revision of the manuscript; MF: study concept and design, data interpretation, supervision and critical revision of the manuscript. All authors approved the final version of the manuscript for publication.
Conference contributions
Part of this data has been presented as a poster presentation at European Crohn’s and Colitis Organisation, July 2021, virtual event, “Epithelial cells of patients with ulcerative colitis do not show an increased sensitivity after microbiota stimulation compared to non-IBD controls.” Part of this data will be presented as a poster presentation at European Crohn’s and Colitis Organisation, February 2022, Vienna, Austria “Microbiota, not host origin drives ex vivo epithelial response in ulcerative colitis patients and non-IBD controls.”
Data transparency
RNA sequencing data is publicly available at the EMBL-EBI ArrayExpress database (www.ebi.ac.uk/arrayexpress) under accession number E-MTAB-10832.
Supplemental Material
Download PDF (1.6 MB)Acknowlegdements
R-spondin-1 (originally from Calvin Kuo laboratory) and WNT3A producing cells were kindly provided by Hans Clevers (Hubrecht Institute, The Netherlands). The Noggin-Fc cell line was kindly provided by Gijs van den Brink (AMC, The Netherlands). We would like to thank Leen Rymenans for technical help in DNA extraction and library preparation.
Disclosure statement
Bram Verstockt
Financial support for research from Pfizer
Consultancy fees from Applied Strategic, Bristol Myers Squibb, Guidepont, Janssen and Sandoz
Lecture fees from Abbvie, Biogen, Chiesi, Falk, Ferring, Galapagos, Janssen, MSD, Pfizer, R-Biopharm, Takeda and Truvion
Jeroen Raes
Financial support for research from Beneo, Cargill, Colruyt group, Danone, DSM, J&J, MRM/Prodigest, Nestle, Pfizer and Takeda
Consulting and/or speaking fees from Aphea, Biofortis, DSM, Ferring, GSK, Janssen Pharmaceuticals, Metagenics, MSD, MRM/Prodigest, Nutricia, Takeda, Tsumura
Séverine Vermeire
Financial support for research from AbbVie, J&J, Pfizer, Galapagos, Takeda
Consulting and/or speaking fees from AbbVie, AbolerIS Pharma, AgomAb, Alimentiv, Arena Pharmaceuticals, AstraZeneca, Avaxia, BMS, Boehringer Ingelheim, Celgene, CVasThera, Dr Falk Pharma, Ferring, Galapagos, Genentech-Roche, Gilead, GSK, Hospira, Imidomics, Janssen, J&J, Lilly, Materia Prima, MiroBio, Morphic, MrMHealth, Mundipharma, MSD, Pfizer, Prodigest, Progenity, Prometheus, Robarts Clinical Trials, Second Genome, Shire, Surrozen, Takeda, Theravance, Tillots Pharma AG, Zealand Pharma
João Sabino
Consultancy fees from Janssen and Fresenius.
Speakers fees from Abbvie, Takeda, Ferring.
Marc Ferrante
Financial support for research from Abbvie, Amgen, Biogen, Janssen, Pfizer, Takeda, and Viatris.
Consultancy fees from Abbvie, Boehringer-Ingelheim, Celltrion, Janssen, Lilly, Medtronic, MSD, Pfizer, Sandoz, Takeda and Thermo Fisher.
Speakers fees from Abbvie, Amgen, Biogen, Boehringer-Ingelheim, Falk, Ferring, Janssen, Lamepro, MSD, Pfizer, Sandoz, Takeda, Truvion Healthcare, and Viatris.
The remaining authors have declared that no conflict of interest exist.
Supplementary material
Supplemental data for this article can be accessed online at https://doi.org/10.1080/19490976.2022.2089003
Additional information
Funding
References
- The human microbiota in health and diseaseGeremia A, Biancheri P, Allan P, Corazza GR, Di Sabatino A. Innate and adaptive immunity in inflammatory bowel disease. Autoimmun Rev. 2014;13(1):3–20. doi:10.1016/j.autrev.2013.06.004.
- Baohong W, Mingfei Y, Longxian L, Zongxin L, Lanjuan L. The human microbiota in health and disease. Engineering. Elsevier ;2017. Vol. 3, pp. 71–82.
- Halfvarson J, Brislawn CJ, Lamendella R, Vázquez-Baeza Y, Walters WA, Bramer LM, D’Amato M, Bonfiglio F, McDonald D. Gonzalez A and others. Dynamics of the human gut microbiome in inflammatory bowel disease. Nat Microbiol. 2017;2:17004. doi:10.1038/nmicrobiol.2017.4.
- Hudcovic T, Stĕpánková R, Cebra J, Tlaskalová-Hogenová H. The role of microflora in the development of intestinal inflammation: acute and chronic colitis induced by dextran sulfate in germ-free and conventionally reared immunocompetent and immunodeficient mice. Folia Microbiol (Praha). 2001;46(6):565–572. doi:10.1007/BF02818004.
- Zhou J, Zhou Z, Ji P, Ma M, Guo J, Jiang S. Effect of fecal microbiota transplantation on experimental colitis in mice. Exp Ther Med. 2019;17(4):2581–2586. doi:10.3892/etm.2019.7263.
- D’Haens GR, Geboes K, Peeters M, Baert F, Penninckx F, Rutgeerts P. Early lesions of recurrent Crohn’s disease caused by infusion of intestinal contents in excluded ileum. Gastroenterology. 1998;114(2):262–267. doi:10.1016/S0016-5085(98)70476-7.
- Rutgeerts P, Peeters M, Hiele M, Vantrappen G, Pennincx F, Aerts R, Kerremans R, Goboes G. Effect of faecal stream diversion on recurrence of Crohn’s disease in the neoterminal ileum. Lancet. 1991;338(8770):771–774. doi:10.1016/0140-6736(91)90663-A.
- Kim D, Zeng MY, Núñez G. The interplay between host immune cells and gut microbiota in chronic inflammatory diseases. Exp Mol Med. 2017;49(5):e339. doi:10.1038/emm.2017.24.
- Becker C, Neurath MF, Wirtz S. The intestinal microbiota in inflammatory bowel disease. ILAR J. 2015;56(2):192–204. doi:10.1093/ilar/ilv030.
- Nagao-Kitamoto H, Kamada N. Host-microbial cross-talk in inflammatory bowel disease. Immune Netw. 2017;17(1):1–12. doi:10.4110/in.2017.17.1.1.
- Van der Sluis M, De Koning BA, De Bruijn AC, Velcich A, Meijerink JP, Van Goudoever JB, Büller HA, Dekker J, Van Seuningen I, Renes IB. Muc2-deficient mice spontaneously develop colitis, indicating that MUC2 is critical for colonic protection. Gastroenterology. 2006;131(1):117–129. doi:10.1053/j.gastro.2006.04.020.
- Dotti I, Mora-Buch R, Ferrer-Picón E, Planell N, Jung P, Masamunt MC, Leal RF, Martín de Carpi J, Llach J, Ordás I. Alterations in the epithelial stem cell compartment could contribute to permanent changes in the mucosa of patients with ulcerative colitis. Gut. 2017;66(12):2069–2079. doi:10.1136/gutjnl-2016-312609.
- Arnauts K, Verstockt B, Ramalho AS, Vermeire S, Verfaillie C, Ferrante M. Ex vivo mimicking of inflammation in organoids derived from patients with ulcerative colitis. Gastroenterology. 2020;159(4):1564–1567. doi:10.1053/j.gastro.2020.05.064.
- Howell KJ, Kraiczy J, Nayak KM, Gasparetto M, Ross A, Lee C, Mak TN, Koo BK, Kumar N, Lawley T. DNA methylation and transcription patterns in intestinal epithelial cells from pediatric patients with inflammatory bowel diseases differentiate disease subtypes and associate with outcome. Gastroenterology. 2018;154(3):585–598. doi:10.1053/j.gastro.2017.10.007.
- Kraiczy J, Nayak KM, Howell KJ, Ross A, Forbester J, Salvestrini C, Mustata R, Perkins S, Andersson-Rolf A, Leenen E. DNA methylation defines regional identity of human intestinal epithelial organoids and undergoes dynamic changes during development. Gut. 2019;68(1):49–61. doi:10.1136/gutjnl-2017-314817.
- Nanki K, Fujii M, Shimokawa M, Matano M, Nishikori S, Date S, Takano A, Toshimitsu K, Ohta Y, Takahashi S. Somatic inflammatory gene mutations in human ulcerative colitis epithelium. Nature. 2020;577(7789):254–259. doi:10.1038/s41586-019-1844-5.
- Sarrabayrouse G, Landolfi S, Pozuelo M, Willamil J, Varela E, Clark A, Campos D, Herrera C, Santiago A, Machiels K. Mucosal microbial load in Crohn’s disease: a potential predictor of response to faecal microbiota transplantation. EBioMedicine. 2020;51:102611. doi:10.1016/j.ebiom.2019.102611.
- Paramsothy S, Kamm MA, Kaakoush NO, Walsh AJ, van den Bogaerde J, Samuel D, Leong RWL, Connor S, Ng W, Paramsothy R. Multidonor intensive faecal microbiota transplantation for active ulcerative colitis: a randomised placebo-controlled trial. Lancet. 2017;389(10075):1218–1228. doi:10.1016/S0140-6736(17)30182-4.
- Moayyedi P, Surette MG, Kim PT, Libertucci J, Wolfe M, Onischi C, Armstrong D, Marshall JK, Kassam Z, Reinisch W. Fecal microbiota transplantation induces remission in patients with active ulcerative colitis in a randomized controlled trial. Gastroenterology. 2015;149(1):102–109.e6. doi:10.1053/j.gastro.2015.04.001.
- Costello SP, Hughes PA, Waters O, Bryant RV, Vincent AD, Blatchford P, Katsikeros R, Makanyanga J, Campaniello MA. Mavrangelos C and others. effect of fecal microbiota transplantation on 8-week remission in patients with ulcerative colitis: a randomized clinical trial. JAMA. 2019;321(2):156–164. doi:10.1001/jama.2018.20046.
- Poletti M, Arnauts K, Ferrante M, Korcsmaros T. Organoid-based models to study the role of host-microbiota interactions in IBD. J Crohns Colitis. 2021;15(7):1222–1235. doi:10.1093/ecco-jcc/jjaa257.
- Fabich AJ, Jones SA, Chowdhury FZ, Cernosek A, Anderson A, Smalley D, McHargue JW, Hightower GA, Smith JT, Autieri SM. Comparison of carbon nutrition for pathogenic and commensal Escherichia coli strains in the mouse intestine. Infect Immun. 2008;76(3):1143–1152. doi:10.1128/IAI.01386-07.
- Conway T, Cohen PS. Commensal and pathogenic Escherichia coli metabolism in the gut. Microbiol Spectr. 2015;3(3). doi:10.1128/microbiolspec.MBP-0006-2014.
- Jalili-Firoozinezhad S, Gazzaniga FS, Calamari EL, Camacho DM, Fadel CW, Bein A, Swenor B, Nestor B, Cronce MJ. Tovaglieri A and others. A complex human gut microbiome cultured in an anaerobic intestine-on-a-chip. Nat Biomed Eng. 2019;3(7):520–531. doi:10.1038/s41551-019-0397-0.
- Vieira-Silva S, Sabino J, Valles-Colomer M, Falony G, Kathagen G, Caenepeel C, Cleynen I, van der Merwe S, Vermeire S, Raes J. Quantitative microbiome profiling disentangles inflammation- and bile duct obstruction-associated microbiota alterations across PSC/IBD diagnoses. Nat Microbiol. 2019;4(11):1826–1831. doi:10.1038/s41564-019-0483-9.
- VanDussen KL, Marinshaw JM, Shaikh N, Miyoshi H, Moon C, Tarr PI, Ciorba MA, Stappenbeck TS. Development of an enhanced human gastrointestinal epithelial culture system to facilitate patient-based assays. Gut. 2015;64(6):911–920. doi:10.1136/gutjnl-2013-306651.
- Johansson ME, Gustafsson JK, Holmén-Larsson J, Jabbar KS, Xia L, Xu H, Ghishan FK, Carvalho FA, Gewirtz AT. Sjövall H and others. Bacteria penetrate the normally impenetrable inner colon mucus layer in both murine colitis models and patients with ulcerative colitis. Gut. 2014;63(2):281–291. doi:10.1136/gutjnl-2012-303207.
- Sabzevary-Ghahfarokhi M, Shohan M, Shirzad H, Rahimian G, Bagheri N, Soltani A, Deris F, Ghatreh-Samani M, Razmara E. The expression analysis of Fra-1 gene and IL-11 protein in Iranian patients with ulcerative colitis. BMC Immunol. 2018;19(1):17. doi:10.1186/s12865-018-0257-9.
- Urosevic J, Nebreda AR, Gomis RR. MAPK signaling control of colon cancer metastasis. Cell Cycle. 2014;13(17):2641–2642. doi:10.4161/15384101.2014.946374.
- Kaminska B. MAPK signalling pathways as molecular targets for anti-inflammatory therapy–from molecular mechanisms to therapeutic benefits. Biochim Biophys Acta. 2005;1754(1–2):253–262. doi:10.1016/j.bbapap.2005.08.017.
- Coskun M, Olsen J, Seidelin JB, Nielsen OH. MAP kinases in inflammatory bowel disease. Clin Chim Acta. 2011;412(7–8):513–520. doi:10.1016/j.cca.2010.12.020.
- Mitsuyama K, Suzuki A, Tomiyasu N, Tsuruta O, Kitazaki S, Takeda T, Satoh Y, Bennett BL, Toyonaga A, Sata M. Pro-inflammatory signaling by Jun-N-terminal kinase in inflammatory bowel disease. Int J Mol Med. 2006;17:449–455.
- Yang L, Yan Y. Protein kinases are potential targets to treat inflammatory bowel disease. World J Gastrointest Pharmacol Ther. 2014;5(4):209–217. doi:10.4292/wjgpt.v5.i4.209.
- Salas A, Hernandez-Rocha C, Duijvestein M, Faubion W, McGovern D, Vermeire S, Vetrano S, Vande Casteele N. JAK-STAT pathway targeting for the treatment of inflammatory bowel disease. Nat Rev Gastroenterol Hepatol. 2020;17(6):323–337. doi:10.1038/s41575-020-0273-0.
- Gu L, Ge Z, Wang Y, Shen M, Zhao P. Activating transcription factor 3 promotes intestinal epithelial cell apoptosis in Crohn’s disease. Pathol Res Pract. 2018;214(6):862–870. doi:10.1016/j.prp.2018.04.013.
- Xiao L, Rao JN, Cao S, Liu L, Chung HK, Zhang Y, Zhang J, Liu Y, Gorospe M, Wang JY. Long noncoding RNA SPRY4-IT1 regulates intestinal epithelial barrier function by modulating the expression levels of tight junction proteins. Mol Biol Cell. 2016;27(4):617–626. doi:10.1091/mbc.E15-10-0703.
- Koch S, Nava P, Addis C, Kim W, Denning TL, Li L, Parkos CA, Nusrat A. The Wnt antagonist Dkk1 regulates intestinal epithelial homeostasis and wound repair. Gastroenterology. 2011;141(1):259–68, 268.e1–8. doi:10.1053/j.gastro.2011.03.043.
- Schmidt J, Stoffels B, Moore BA, Chanthaphavong RS, Mazie AR, Buchholz BM, Bauer AJ. Proinflammatory role of leukocyte-derived Egr-1 in the development of murine postoperative ileus. Gastroenterology. 2008;135(3):926–36, 936.e1–2. doi:10.1053/j.gastro.2008.05.079.
- Silverman ES, De Sanctis GT, Boyce J, Maclean JA, Jiao A, Green FH, Grasemann H, Faunce D, Fitzmaurice G, Shi GP. The transcription factor early growth-response factor 1 modulates tumor necrosis factor-alpha, immunoglobulin E, and airway responsiveness in mice. Am J Respir Crit Care Med. 2001;163(3 Pt 1):778–785. doi:10.1164/ajrccm.163.3.2003123.
- McMahon SB, Monroe JG. The role of early growth response gene 1 (egr-1) in regulation of the immune response. J Leukoc Biol. 1996;60(2):159–166. doi:10.1002/jlb.60.2.159.
- Wang B, Guo H, Yu H, Chen Y, Xu H, Zhao G. The role of the transcription factor EGR1 in cancer. Front Oncol. 2021;11:642547.
- Dong XY, Wu MX, Zhang HM, Lyu H, Qian JM, Yang H. Association between matrix Gla protein and ulcerative colitis according to DNA microarray data. Gastroenterol Rep. 2020;8(1):66–75. doi:10.1093/gastro/goz038.
- Macpherson AJ, Chester KA, Robson L, Bjarnason I, Malcolm AD, Peters TJ. Increased expression of c-myc proto-oncogene in biopsies of ulcerative colitis and Crohn’s colitis. Gut. 1992;33(5):651–656. doi:10.1136/gut.33.5.651.
- Roy PK, Rashid F, Bragg J, Ibdah JA. Role of the JNK signal transduction pathway in inflammatory bowel disease. World J Gastroenterol. 2008;14(2):200–202. doi:10.3748/wjg.14.200.
- Maaser C, Sturm A, Vavricka SR, Kucharzik T, Fiorino G, Annese V, Calabrese E, Baumgart DC, Bettenworth D, Borralho Nunes P. ECCO-ESGAR guideline for diagnostic assessment in IBD Part 1: initial diagnosis, monitoring of known IBD, detection of complications. J Crohns Colitis. 2019;13(2):144–164. doi:10.1093/ecco-jcc/jjy113.
- Vermeire S, Joossens M, Verbeke K, Wang J, Machiels K, Sabino J, Ferrante M, Van Assche G, Rutgeerts P, Raes J. Donor species richness determines faecal microbiota transplantation success in inflammatory bowel disease. J Crohns Colitis. 2016;10(4):387–394. doi:10.1093/ecco-jcc/jjv203.
- Vandeputte D, Kathagen G, D’hoe K, Vieira-Silva S, Valles-Colomer M, Sabino J, Wang J, Tito RY, De Commer L, Darzi Y. Quantitative microbiome profiling links gut community variation to microbial load. Nature. 2017;551(7681):507–511. doi:10.1038/nature24460.
- Vancamelbeke M, Laeremans T, Vanhove W, Arnauts K, Ramalho AS, Farré R, Cleynen I, Ferrante M, Vermeire S. Butyrate does not protect against inflammation-induced loss of epithelial barrier function and cytokine production in primary cell monolayers from patients with ulcerative colitis. J Crohns Colitis. 2019;13(10):1351–1361. doi:10.1093/ecco-jcc/jjz064.
- Harrow J, Frankish A, Gonzalez JM, Tapanari E, Diekhans M, Kokocinski F, Aken BL, Barrell D, Zadissa A, Searle S. GENCODE: the reference human genome annotation for The ENCODE Project. Genome Res. 2012;22(9):1760–1774. doi:10.1101/gr.135350.111.
- Love MI, Huber W, Anders S. Moderated estimation of fold change and dispersion for RNA-seq data with DESeq2. Genome Biol. 2014;15(12):550. doi:10.1186/s13059-014-0550-8.
- Krämer A, Green J, Pollard J, Tugendreich S. Causal analysis approaches in ingenuity pathway analysis. Bioinformatics. 2014;30(4):523–530. doi:10.1093/bioinformatics/btt703.
- Yu G, Wang LG, Han Y, He QY. clusterProfiler: an R package for comparing biological themes among gene clusters. OMICS. 2012;16(5):284–287. doi:10.1089/omi.2011.0118.
- Yu G, He QY. ReactomePA: an R/Bioconductor package for reactome pathway analysis and visualization. Mol Biosyst. 2016;12(2):477–479. doi:10.1039/C5MB00663E.