
ABSTRACT
Opioid crisis is an ongoing epidemic since the past several decades in the United States. Opioid use-associated microbial dysbiosis is emerging as a key regulator of intestinal homeostasis and behavioral responses to opioid. However, the mechanistic insight into the role of microbial community in modulating host response is unavailable. To uncover the role of opioid-induced dysbiosis in disrupting intestinal homeostasis we utilized whole genome sequencing, untargeted metabolomics, and mRNA sequencing to identify changes in microbiome, metabolome, and host transcriptome respectively. Morphine treatment resulted in significant expansion of Parasuterella excrementihominis, Burkholderiales bacterium 1_1_47, Enterococcus faecalis, Enterorhabdus caecimuris and depletion of Lactobacillus johnsonii. These changes correlated with alterations in lipid metabolites and flavonoids. Significant alteration in microbial metabolism (metabolism of lipids, amino acids, vitamins and cofactors) and increased expression of virulence factors and biosynthesis of lipopolysaccharides (LPS) and lipoteichoic acid (LTA) were observed in microbiome of morphine-treated animals. In concurrence with changes in microbiome and metabolome extensive changes in innate and adaptive immune response, lipid metabolism, and gut barrier dysfunction were observed in the host transcriptome. Microbiome depleted mice displayed lower levels of inflammation, immune response and tissue destruction compared to mice harboring a dysbiotic microbiome in response to morphine treatment, thus establishing dysbiotic microbiome as mediator of morphine gut pathophysiology. Integrative analysis of multi-omics data highlighted the associations between Parasutterella excrementihominis, Burkholderiales bacterium 1_1_47, Enterococcus faecalis, Enterorhabdus caecimuris and altered levels of riboflavin, flavonoids, and lipid metabolites including phosphocholines, carnitines, bile acids, and ethanolamines with host gene expression changes involved in inflammation and barrier integrity of intestine. Omic analysis also highlighted the role of probiotic bacteria Lactobacillus johnsonii, metabolites flavonoids and riboflavin that were depleted with morphine as important factors for intestinal homeostasis. This study presents for the first time ever an interactive view of morphine-induced changes in microbial metabolism, strain level gut microbiome analysis and comprehensive view of changes in gut transcriptome. We also identified areas of potential therapeutic interventions to limit microbial dysbiosis and present a unique resource to the opioid research community.
Introduction
Opioid drugs are the gold standard for managing peri- and post-operative pain. However, long-term use of opioids for pain management is limited by adverse side effects, including tolerance, addiction, hyperalgesia, organ damage, cognitive impairments, and adverse effects on respiratory and gastrointestinal systems. Despite these known consequences, a staggering number of opioid prescriptions (i.e., 142,816,781) were dispensed in the year 2020 alone in the United States.Citation1 In addition, the total number of opioid-involved overdose deaths rose from 21,088 in 2010 to 68,630 in 2020.Citation2 Taken together, there is a critical need for understanding the etiology of opioid use disorder and developing adjunctive therapies to minimize the side effects of opioid drug use.
Several recent studies have shown adverse effects of opioids use on the gastrointestinal system, impacting the intestinal barrier function,Citation3 inducing microbial dysbiosis,Citation4–7 and modulating opioid induced bowel dysfunction.Citation8 Notably, opioid-induced gut microbial dysbiosis is observed in both preclinical and clinical studies,Citation4,Citation5,Citation9–12 with a signature profile that show a depletion of bacteria belonging to genera Lactobacillus, Bifidobacterium, and Clostridium, and an expansion of Enterococcus faecalis.Citation5–7,Citation13 However, these studies are limited by the low resolution of 16s sequencing technique, that leads to the identification of opioid use associated taxonomic alterations at the genus level. Additionally, clinical studies had relatively small opioid patient cohort and were confounded by polydrug use, alcohol use, and different dietary habits in the study population.
In addition to alterations in the gut microbiome, opioid use is known to modulate the gut metabolome, with alterations observed as early as 24 hours following morphine use.Citation6 In cohort studies, altered urinary and fecal metabolites were observed in opioid usersCitation14 and in methadone-maintained patients.Citation15 However, in the absence of metagenomic alteration data and comprehensive analysis of metabolite changes from such studies, the role of the gut microbiome in mediating opioid-associated metabolite changes remain largely unknown.
Growing evidence continue to indicate a crucial role for the gut microbiome and metabolome in regulating neuro inflammation,Citation16 development of antinociceptive tolerance,Citation7,Citation11 opioid-dependent behaviors, alterations to reward and behavioral responses to opioids.Citation17,Citation18 and withdrawal symptoms.Citation16,Citation19 Additionally, opioid use and gut microbiome are associated with exacerbated progression of HIV,Citation12,Citation20,Citation21 colitis,Citation22 chronic cirrhosis,Citation9 and increased virulence of hospital acquired infections and sepsis.Citation23–25 Despite these advances, the role of opioid-associated changes in microbial composition and metabolism in modulating the host immune response, function and metabolism remains uncharacterized. Thus, it is of importance to comprehensively study the morphine-mediated early changes in gut microenvironment and identify potential therapeutic targets to limit microbial dysbiosis and thus delay the development of opioid-associated comorbidities.
In this study, to bridge these gaps in knowledge we conducted a comprehensive analysis of early changes in gut microenvironment by measuring changes in gut microbial communities (shotgun metagenomics), transcriptional changes in gut tissues (RNA seq) and changes in ileal metabolites (untargeted metabolomics) in mice treated with and without morphine for 16 hours. Separate cohorts of mice treated with antibiotics were used to elucidate the role of microbiome in morphine-mediated changes in the small intestine as demonstrated in study design (Supplementary Fig. S1). Different datasets were integrated to delineate the complex relationship between the microbiome, metabolome, host metabolism and immune response in the context of morphine. This study has identified several new mechanisms and potential therapeutic targets that may help future researchers understand the causal relationship between opioid-induced gut dysbiosis, gut barrier disruption, and the development of opioid use disorder.
Methods
Experimental animals
All animal experiments were conducted in accordance with the guidelines of Institutional Animal Care and Use Committee (IACUC). Eight-week-old, pathogen free, C57BL/6 male mice (https://www.jax.org/strain/000664) were purchased from Jackson Laboratories (Bar Harbor, ME, USA). Animals were maintained in a 12-h light/dark cycle, with constant temperature (72 ± 1°F) and 50% humidity with food and tap water provided ad libitum. A maximum of five mouse were housed per cage. All the procedures were conducted according to the guidelines set forth by the National Institute of Health Guide for the Care and Use of Laboratory Animals at the University of Miami.
Animal treatment and sample harvesting
The animals were anesthetized using isoflurane (Pivetal®) and a 25 mg slow-release morphine pellet or placebo pellet was implanted subcutaneously. The pellets were obtained from National Institute on Drug Abuse. All efforts were made to minimize suffering during and after surgery. For depletion of the gut microbiota, a pan-antibiotics + antifungal cocktail [vancomycin 32 (mg/kg), bacitracin (80 mg/kg), metronidazole (80 mg/kg), neomycin (320 mg/kg), and pimaricin (0.192 mg/kg)] was prepared every day in drinking water. The cocktail was administered by oral gavage for 7 days as described previously.Citation7 Animals were euthanized using CO2 chamber followed by cervical dislocation. Luminal content was flushed out from terminal ileum and flash frozen for metabolomic analysis and metagenomics analysis. Ileum tissue were collected, and flash frozen for RNA extraction and preserved in 10% neutral formalin for histological analysis.
RNA extraction
RNA was extracted from flash frozen terminal ileum from the control and treatment groups, using RNeasy Plus Universal Mini Kit from Qiagen (catalog No. 73404) following manufacturer’s instructions. Briefly, the tissue was homogenized for 90 sec in TRIzolTM (Invitrogen, catalog no. 15596026) using a MagNA Lyser (Roche Diagnostics), followed by non-enzymatic removal of genomic DNA. High quality RNA was extracted using RNeasy spin columns. Total RNA was quantified by using a Nanodrop and the integrity was assessed by using an Agilent 2100 Bioanalyzer. The RNA samples with RNA integrity number (RIN) greater than 8 were used for subsequent RNA -sequencing.
Histological evaluation and immunofluorescence staining
Excised ileal section was fixed in 10% neutral buffer formalin for 24 hours and embedded in paraffin. 8 µm section was mounted on microscopy glass slide and stained with hematoxylin and eosin (H&E) for histological evaluation. H&E-stained slides were randomized and coded for histological evaluation in a blinded fashion. For immunofluorescence staining with tight junction protein, fixed ileal sections were deparaffinized using xylene and passed through series of graded alcohol for rehydration. Heat antigen retrieval was performed using citrate antigen retrieval buffer (DAKO) and tissue section was blocked with 5% BSA. Ileal tissue sections were stained with anti-Claudin-1 antibody (Invitrogen, catalog no. 51–9000) at a dilution of 1:100 in PBS + 1%BSA overnight at 4°C. Anti-rabbit Alexa 488 conjugated secondary antibody (Invitrogen, catalog no. A-11008) was added at a dilution of 1:800 for 1 hour at room temperature. Ileal tissue section was mounted under coverslip using ProLong Gold antifade mounting media with DAPI (Invitrogen, catalog no. P36935) and visualized using fluorescence microscope (Leica Microsystems, Germany).
Real-time PCR
Total RNA from terminal intestinal tissue section was extracted using RNeasy Plus Universal Mini Kit from Qiagen (Catalog No. 73404) and quantified using a Nanodrop (Agilent Technologies). cDNA was synthesized from 2 µg of RNA using High-Capacity cDNA Reverse Transcription Kit (Applied BiosystemsTM , Catalogue no. 4368814) as per manufacturer’s protocol. Quantitative real-time PCR (qRT- PCR) was performed on LightCyclerⓇ 480 II (Roche) using SYBRⓇ Green I master mix (Roche). Expression levels of measured genes was normalized to 18S rRNA gene by 2-ΔΔCt method. Primers for gene analysis were purchased from Sigma and list of primers used in the study are provided in .
Table 1. Primer used in the study for small intestine gene expression.
Library preparation and sequencing
mRNA was purified from total RNA from using poly T-magnetic beads and strand specific library was constructed by using NEBNext Ultra RNA library prep kit. After quality control, the libraries were sequenced paired end by using Illumina sequencers for a read length of 150 base pairs. The sequencing service was provided by “Novogene”. The raw data was filtered to remove low quality reads and adaptors. Clean reads were mapped to the mouse transcriptome using “STAR” software. The subsequent differential gene expression analysis was performed using DESeq2 R package (log2 (Fold change) > 1, P adj < .05).Citation26 Functional enrichment analysis was performed using “ClusterProfiler”Citation27 to identify enriched biological process and pathways including Gene ontology (GO) and KEGGCitation28 pathways. Differentially expressed genes were further analyzed using ToppGeneCitation29 and ToppCluster.Citation30 CytoscapeCitation31 was utilized for visualization of significantly enriched GOs, pathways and disease. Cytoscape.v3.9.0 was used to visualize the network.
DNA extraction
DNA was extracted from the luminal content of ileum using DNeasyPowerSoil Kit (Catalogue No. 12888–100) from Qiagen according to manufacturer’s instruction. The extracted DNA was quantified by Qubit 4.0 fluorometer.
Metagenomic sequencing
The libraries were constructed using Nextra XT DNA library preparation kits. After QC analysis, the libraries were sequenced as 2 × 150bp reads at a depth of 20 million reads on an Illumina NovaSeq6000 sequencer.
Data analysis and taxonomic profiling
The sequenced reads were uploaded and analyzed using the Cosmos ID cloud platform and bioinformatics pipeline.Citation32,Citation33 Briefly, the unassembled reads were analyzed by using data mining K-mer algorithm. Taxonomic assignment was carried out by matching the specific K-mers identified in the sequenced samples to the unique, shared K-mers and marker genes of the reference genomes present in highly curated GenBookTM reference database. A threshold based on internal Cosmos ID statistics was assigned to avoid false positives. Use of this unique K-mer based approach was proven to be accurate in taxonomic assignment up to species, sub species and strain level at multi kingdoms, including bacteria, virus, protists and fungi.
Relative abundance and diversity matrices
Abundance of each organism was calculated based on the K-mers unique to the organism, their observed frequency and size of the reference genome. The changes in relative abundance at all taxonomic levels was calculated and presented as a percentage. Differently altered taxa were identified by linear discriminant analysis of effect size (LEfSe) using Kruskal-Wallis test with a p value < .05 and linear discriminant analysis (LDA) score > 2.0 and represented in a cladogram.Citation34 Changes in alpha and beta diversity resulting from the treatment were presented using Shannon and Bray-Curtis dissimilarity matrices. Non-parametric PERMANOVA analysis “adonis” function was utilized for statistical analysis of Bray-Curtis dissimilarity matrices.
Functional profiling
Metagenomic shotgun reads of control and morphine treatment groups were analyzed using HUMAnN2 2.8.1. to identify bacterial community functional potential.Citation35 Briefly, mouse reads were removed by mapping to the mouse genome using Bowtie2. UniRef 90Citation36 and MetaCycCitation37 databases were used to annotate the gene family, and pathway abundances respectively. MetaPhlAn2 2.9Citation38 was used to map the gene and pathway abundances to bacteria (species, genus or unclassified) in control and morphine treatment groups. Genes were further regrouped in KEGG orthology (KO) and GO using the “humann2_regroup_table” function. Gene and pathway abundances were normalized using read per kilo base to account for gene length and further normalized to total microbial reads. The final values of gene and pathway abundances were presented as number of copies per million (CPM) in log2 scale. Moderated t test calculated using the “limma” function in R, adjusted for multiple hypothesis testing (FDR) was used to compare gene, KO and pathway abundance between the control and morphine treatment groups. The KOs were grouped into higher functional groups using Microbiome Analyst.Citation39
Untargeted metabolomics
Untargeted metabolomic analysis of harvested samples was done by Michigan Regional Comprehensive Metabolomics Resource Core (MRC2) (Ann Arbor, MI, USA). Metabolite extraction was done in Methanol: Acetonitrile: Acetone (1:1:1) solution with internal standards.
Samples were reconstituted in solvent containing Methanol and H2O (2:98). 100 µl sample was added to 400 µl extraction solvent and reconstituted in 100 µl reconstitution solvent. For untargeted metabolomics, samples were analyzed on 1290 Liquid chromatography, coupled with 6530 qTOF mass spectroscopy (Agilent Technologies, Santa Clara, CA, USA). Same chromatography was used for positive and negative modes. Raw data was processed using MassHunter Qual and ProFinder software (Agilent), and analyzed with MassProfiler Pro package using recursive analysis workflow (Agilent). Data normalization was performed using custom R-scripts (internal to Michigan Regional Comprehensive Metabolomics Resource Core (MRC2) (Ann Arbor, MI, USA). 243 annotated compounds were identified in our sample by comparing the observed mass and retention time to the in-house library. Remaining unannotated compounds were listed with their observed mass and retention times.
Multi-omics integration-network analysis
Integration of multi-omics data from transcriptome, metagenome and metabolomics was done through correlation analysis. Bacteria, significantly altered metabolites (102) and a total of 1075 DEGs (910 upregulated and 165 down regulated genes) involved in inflammatory signaling, tissue damage, lipid signaling were used for integration analysis and are listed in supplementary file 5. Corresponding data frame for calculation of correlations was prepared and processed in R and function rcorr was used to compute spearman correlation coefficient for all possible pairs of matrices. The significance of pair wise correlation was determined after adjusting for false discovery rate using Benjamini-Hochberg procedure using Hmisc package in R.Citation40,Citation41 Using Spearman correlation, we identified significantly altered metabolites and DEGs whose expression covaried with dysbiotic microbiome. Also included in the network were various DEGs that covaried with changes in metabolites since microbiome can mediate changes in gene expression through production and transformation of various metabolites. All significant correlations greater than or equal to± 0.6 were used to create a core network. Separate sub networks were constructed by selecting for significantly altered bacterial taxa at species level, metabolites and DEGs. Statistically significant positive and negative correlations between taxa-metabolites; taxa-genes that are greater than 0.7 are included in the network, and top 25% of correlations between metabolites and genes were represented in the sub network. Significant correlations were imported to Cytoscape 3.8.2 for visualization of the correlation network.
Statistical analysis
For microbiome analysis, differently altered taxa were identified by LEfSeCitation34 using Kruskal-Wallis test with a p value < 0.05 and LDA score > 2.0. Nonparametric PERMANOVA analysis using “adonis” function was utilized for statistical analysis of Bray-Curtis dissimilarity matrices. Changes in relative abundance of microbial strains were computed using non-parametric Mann-Whitney test (p value < 0.05) in GraphPad prism. For analysis of functional changes in metagenome, moderated t-test calculated using the “limma” function in R,Citation42 adjusted for multiple hypothesis testing (FDR) using Benjamini-Hochberg procedure was used to compare gene and pathway abundance between the control and morphine treatment groups (P adj < .05). The changes in KEGG metabolic pathways between the groups was calculated by T-test after correction for false discovery with a cut off of P adj < 0.05. Changes in expression of virulence factors were computed using Mann-Whitney test (p value < 0.05). For metabolite analysis, after inter quantile normalization the changes in metabolite analysis were calculated using moderated T-test with Padj < 0.05. For RNA-sequencing, differential gene expression analysis was performed using DESeq2 R package and genes with an expression of log2 (Fold change) > 1, and P adj < 0.05 (Benjamini-Hochberg correction) were considered significant. For real-time qPCR analysis, significance of altered expression is calculated using non-parametric Mann-Whitney test (P value < 0.05) using GraphPad prism. For multi-omics integration network, the significance of correlation between all bacterial species, metabolites and DEGs was calculated using “Hmisc” packageCitation41 accounting for multiple testing using Benjamini-Hochberg procedure with a P adj < 0.05.
Results
Morphine treatment induces taxonomic and functional dysbiosis in small intestinal microbiome
To understand the effects of morphine treatment on the gut microbiome, we performed whole genome shotgun sequencing of mouse ileal microbiome. We identified a total of 63 taxa at the species level (47 bacteria, 3 fungi, 1 archaeon, 11 viruses, and 2 phages) (Supplementary file1). Beta diversity analysis () as calculated by Bray-Curtis dissimilarity matrices of the combined taxa shows a distinct clustering of the control and treatment groups. Significantly altered taxa identified by LEfSe with a p value < 0.05 and LDA score > 2.0 were represented in cladogram (). Further analysis of the bacterial taxa alone revealed alterations in alpha diversity (Shannon and Simpson indices) and beta diversity (Bray-Curtis) in morphine-treated mice compared to the control mice (Supplementary Fig. S2A, 2B). Morphine treatment resulted in significant expansion of Parasutterella excrementihominis, Burkholderiales bacterium 1_1_47, Enterococcus faecalis, Staphylococus xylosus, Firmicutes bacterium M10–2, Bifidobacterium pseudolongum and Enterorhabdus caecimuris and depletion of Lactobacillus johnsonii (). Consistent changes were observed at strain level (Supplementary Fig. S2C).
Figure 1. Morphine treatment induces taxonomic and functional dysbiosis in small intestinal microbiome. (a) Beta diversity of phylogenic relative abundance of ileal microbiome at species level in control and morphine group calculated as Bray-Curtis dissimilarity matrix. PERMANOVA analysis (p = .026) show significant changes in microbial composition. (b) Cladogram showing the differentially abundant microbial taxa, including bacteria, archaea, virus, fungi identified by LEfSe analysis (P < .05 Krushkal-wallis test, LDA > 2.0). Green represents taxa abundant in morphine group compared to control; blue, represents taxa abundant in control group compared to morphine group. (u_s: unclassified species, u_g: unclassified genus, u_f: unclassified family, u_c: unclassified class, u_o: unclassified order) (c) Principal component analysis based on relative abundance of KOs discriminates the functional signature of control and morphine microbiome. (d) Overview of microbiome functional profile based on KEGG metabolism in control and morphine groups. Bar graph showing enrichment of GO modules involved in (e) LPA and LTA biosynthesis, (f) lipid metabolism, (g) vitamin metabolism, (h) amino acid metabolism, and (i) other biologically important GO modules. n = 5 mice per group. Data (e, f, g, h, and i) were analyzed using moderated t-test (mean± standard error of mean (SEM), *p adj ≤ .05, **p adj ≤ .01, ***p adj ≤ .001, ****p adj ≤ .0001. n = 5 per group.
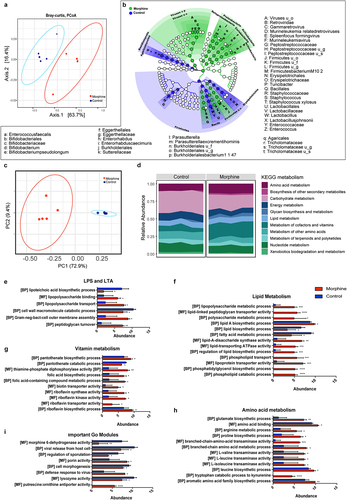
Furthermore, morphine treatment significantly increased abundance of virus belonging to the genus Gamma retrovirus (). Of note, the alpha and beta diversities for viruses did not change significantly suggesting that morphine caused subtle changes in viral taxa (Supplementary Fig. S2E-F). Among archaea, we observed a significant depletion of Methanococcus maripaludis following morphine treatment (Supplementary Fig. S2C).
We next analyzed metagenomic data to identify functional changes by mapping microbial reads using HUMAnN pipeline. The identified reads were then assigned to microbial pathways, GO, and KO. Morphine treatment causes significant alteration to 201 KOs (Supplementary Fig.3; Supplementary file 1). The Principal Coordinate Analysis (PCoA) plot based on the relative abundance of the KOs in control and morphine-treated groups suggest that morphine significantly altered the functional profile of bacterial community (). In addition, grouping of KOs into KEGG metabolic pathways suggest that morphine treatment increased amino acid transport and metabolism, metabolism of cofactors and vitamins, lipid metabolism; and decreased xenobiotics biodegradation and metabolism, and carbohydrate metabolism (; Supplementary file 1). Additionally, we identified 3198 Uniref genes that were grouped into GOs, and we observed significant changes in 460 GO modules (Supplementary file 1). Interestingly, higher abundance of GO modules detected in the metagenome of morphine-treated mice was involved in production of bacterial cell membrane components and transport including lipoteichoic acid (LTA) biosynthetic process, peptidoglycan turnover, gram negative bacteria cell outer membrane assembly, lipopolysaccharide (LPS) binding and transport (). Also, in morphine treatment groups increased expression of genes involved in production of virulence factors in Bacteroides fragilis (Supplementary Fig. S2D) were observed, indicating an increased pathogenicity in morphine microbiome.
We also observed an enrichment of GOs involved in lipid metabolism, including lipid A and phosphatidylglycerol biosynthetic process, phospholipid transport and lipoprotein transporter activity and a downregulation of GOs involved in fatty acid metabolic process and lipid biosynthetic process in morphine-treated group compared to the control (), suggesting a dysregulation of lipid metabolism in microbiome of morphine treatment group. Moreover, significant enrichment in GO modules involved in biosynthesis of vitamins (Vitamins B1, B2, B5 and folic acid) (), and biosynthesis of amino acids including glutamate and catabolism of tryptophan to kynurenine (), were observed in morphine microbiome compared to the controls. Furthermore, an increased abundance of GOs involved in defense response to virus was observed in microbiome from morphine-treated mice. Interestingly, we also observed decrease in GOs involved in morphine 6-dehydrogenase activity, viral release from host cell and lysozyme activity in microbiome of morphine-treated mice (). These findings collectively indicate that morphine use results in multi-kingdom level compositional alterations and also induces bacterial functional dysbiosis.
Morphine use results in broad changes in small intestinal metabolome and highlights changes in lipid metabolism
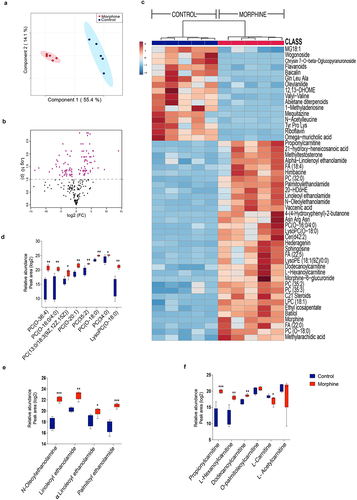
To fully characterize the impact of compositional and the functional dysbiosis, we performed metabolite profiling of ileal luminal content of morphine treated and control mice using untargeted Liquid chromatography-mass spectrometry (LC-MS). We have identified and annotated 243 metabolites of which 115 metabolites (53 depleted, 62 enriched) were significantly altered with morphine treatment (Supplementary file 2). The partial least squares-discriminant analysis (PLS_DA) plot differentiated morphine metabolome from the control group (). Metabolite changes with morphine treatment are represented in the volcano plot (, Supplementary file 2). The top 50 altered metabolites are represented as a heat map (). Enrichment of various lipid metabolites including ethanolamines (N-Oleolethanolamine (OEA), Linoleoyl ethanolamide (LEA), Alpha-linolenoyl ethanolamide (αLEA) and Palmitoyl ethanolamide (PEA)), phosphocholines (PCs) (PC(O-20:1), PC (13:0/18:3 (9z,12z,15z), PC(35:2), PC(0–18:0), PC (35:3), Fatty acids (FA) (myristoleic acid, methyl arachidic acid, FA(22:0), FA(20:2), and FA(22:4)), propionylcarnitine, L-hexanoylcarnitine, dodecanoylcarnitine and metabolites of linolic acid, mainly, 12,13-DHOME were observed in morphine metabolome (). While, depletion of vitamin Riboflavin, flavonoids (genistin, daidzin, naringenin1-O-glucuronide, wogonoside, baicalin), L-carnitine, spermidines and bile acids (BAs) (ursodeoxycholic acid, alpha-muricholic acid, omega-muricholic acid, cholic acid, hyocholic acid, and glycocholic acid), was observed in morphine group (, and Supplementary file 2). Also, depletion of endocannabinoid receptor ligand 4-Quinolone-3-Carboxamide CB2 Ligand, all-trans-retinoic acid (atRA), and zearalenone 4-sulfate were observed in luminal metabolome of morphine group (Supplementary file S2). Furthermore, we observed significant enrichment of morphine metabolite morphine 6-glucoronide (M6G) indicating altered metabolism of morphine ().
Figure 2. Morphine use results in broad changes in small intestinal metabolome. (a) Score plot showing Partial Least Squares-discriminant analysis (PLS-DA) of morphine and control ileal metabolite profile (variance is explained by PC1 (55.4%) and PC2 (14.1%)). (b) Volcano plot showing most significant metabolites identified by univariate analysis. 115 out of 243 metabolites were significantly different in morphine compared to control samples. (c) Heat map showing top 50 metabolites significantly altered across control and morphine groups. Box plots showing log2 fold changes in relative abundance (Peak area) of (d) phosphocholines, (e) N-acylethanolamines, and (f) carnitines. n = 5 per group. Data (d, e, and f) were analyzed using moderated t-test; the box-and-whisker plot indicates the minimum and maximum distribution (whiskers) and the upper and lower quartile limits (box), with the median value shown as a line. *p adj ≤ .05, **p adj ≤ .01, ***p adj ≤ .001, ****p adj ≤ .0001.
Morphine induced changes in small intestine transcriptome include heightened expression of inflammation associated genes and alterations in lipid metabolism
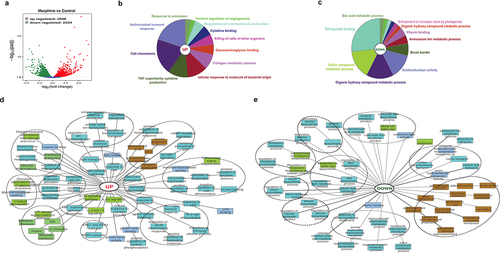
We defined core ileal morphine gene expression signature composed of 5140 (2606 upregulated, 2534 downregulated) differentially expressed genes (DEGs) ( and Supplementary file 3). ClueGo and ToppCluster were used for gene enrichment analysis. Broadly, ClueGo pie chart for upregulated DEGs showed significant enrichment for immune cell chemotaxis and related humoral and cytokine response (). Simultaneously, enrichment in response against protozoan and bacterial molecules is also observed (). A robust decrease in overall metabolic processes was observed (). ToppCluster analysis was performed on upregulated () and downregulated genes () for detailed representation of enriched biological process including significant pathways, GOs and disease. Compared to control, morphine upregulated gene signature shows enrichment of GOs and pathways associated with defense responses such as interleukin signaling pathways, innate and adaptive immune cell activation, response to bacteria and LPS etc. Notably, other upregulated GOs such as MAPK and ERK1/2 signaling cascade, vascular inflammation, endothelial dysfunction, and O-linked glycosylation, were also emphasized in morphine group. The downregulated gene signature for morphine treatment showed a robust decrease in cell-cell junction, actin cytoskeleton and anchoring junction, which were further reflected in the severely damaged tissue morphology observed in H&E stained intestinal section (Supplementary Fig.4A) and tight junction staining (Supplementary Fig.4B) in intestinal sections in morphine treated mice. Using a separate cohort of mice, we validated morphine mediated upregulation of inflammatory markers using real time PCR (Supplementary Fig. 4C). Genes involved in diverse metabolic process, including steroid, lipid, alcohol biosynthesis were downregulated (). Interestingly, upregulation of GOs involved in lipid binding, lipid transport, and lipid catabolic processes was also noted, indicating widespread dysregulation of metabolic process after morphine treatment.
Figure 3. Global overview of small intestine transcriptome changes in morphine treated mice. (a) Volcano plot of the 5140 differentially expressed genes between morphine and control group (Log2 (fold change) > 1; Padj <.005). Functional annotation enrichment analyses of (b) 2606 upregulated and (c) 2534 downregulated genes after morphine using ClueGO charts. Detailed functional annotation enrichment analyses of the (d) 2606 upregulated and (e) 2534 downregulated core genes using ToppGene, ToppCluster, and Cytoscape are shown. GO: biological process (teal), cellular component (brown), and molecular function (blue gray), disease (green). The full list of gene set enrichment results and P values are in Supplementary file 3.
Morphine mediated changes in murine intestinal transcriptome profiles are influenced by gut microbiota
To obtain insight into genome wide impact of dysbiotic microbiome characteristic of morphine treatment on the host transcriptome, we compared mRNA expression levels in morphine-treated group and Abx+morphine (AM) group that is treated with morphine in the absence of microbiome. We observed 1371 (667 upregulated and 704 downregulated) DEGs in morphine-treated group compared to AM group ( and Supplementary file 4), indicating that the expression of the 1371 genes was mediated by morphine microbiome. Functional annotation enrichment analysis was performed on all significant DEGs (p ≤ 0.05) using ClueGo, ToppGene and ToppCluster as mentioned previously. ClueGo pie chart depicts enrichment of various immune regulatory processes as well as cellular response to biotic stimuli such as molecules of bacterial, viral or fungal origin in morphine group (). A simultaneous decrease in response to xenobiotic stimulus was also observed after morphine treatment (). Further analysis on DEGs using ToppCluster analysis revealed an increase in innate and adaptive immune response as well as cytokine signaling in morphine group compared to AM group implicating dysbiotic microbiome as a mediator of inflammation (). The role of gut microbiota in driving inflammation following morphine treatment was further validated using germ free (GF) mouse, where morphine mediated upregulation of pattern recognition receptor (Tlr4), cytokines (Il6, Il1β, Il18, Tnfα), chemokines (Cxcl1, Cxcl2, Cxcl17) and matrix metallopeptidase 16 (Mmp16) involved in tissue damage was not observed (Supplementary Fig. S5) in GF mice.
Figure 4. Morphine mediated changes in murine intestinal transcriptome profiles are influenced by gut microbiota. (a) Volcano plot of the 1371 differentially expressed genes between morphine and AM group (Log2 (fold change) > 1; Padj <.005). Functional annotation enrichment analyses of the (b) 667 upregulated and (c) 704 downregulated genes after morphine using ClueGO charts. Detailed functional annotation enrichment analyses of the (d) 667 upregulated and (e) 704 downregulated core genes using ToppGene, ToppCluster, and Cytoscape are shown. GO: biological process (teal), cellular component (brown), and molecular function (blue gray), disease (green). The full list of gene set enrichment results and P values are in Supplementary file 4.
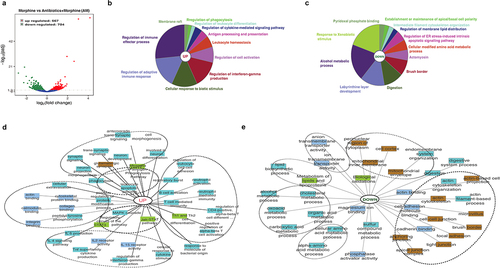
Several metabolic process pathways including amino-acid metabolic processes, alcohol metabolic processes, lipids and lipoprotein metabolic processes were downregulated robustly () in morphine group compared to AM group, indicating the role of microbiome in these metabolic processes. Another significant downregulation was observed in cellular components involved with intestinal permeability such as tight junction, cell-cell junction, anchoring junction, actin cytoskeleton (). Taken together, the comparative analysis of gene expression patterns across the morphine group and AM group identified dysbiotic microbiome as a mediator for inflammation and metabolic dysregulation.
Systematic molecular correlations across multi-omes integrating morphine mediated changes in microbiome, metabolome, and host transcriptome
Next, to identify the direct microbial-host interactions and indirect interactions mediated by metabolites, we constructed a large-scale interaction network spanning the three omics measurements. Using Spearman correlation, we identified metabolites and DEGs whose expression covaried with changes in microbiome. Also included were various DEGs that covaried with changes in metabolites. In total, we identified 15,617 significant correlations between the three data sets (Supplementary file 5). Filtered network was generated for visualization by integrating the significant Spearman correlations between taxa, metabolites, and DEGs (). The resulting network contained 1672 significant correlations, including both positive and negative correlations value greater than 0.7 (Padj <0.05) between 251 nodes from three measurement types (Supplementary file 6).
Figure 5. Systematic molecular correlations across multi-omes integrating morphine mediated changes in microbiome, metabolome, and host transcriptome. Host microbiome interaction network (Spearman coefficient ≥ ± 0.7) showing significant correlations between microbiome, metabolites and DEGs (P adj ≤ 0.05). Microbial species, metabolites, and DEGs are represented as nodes; microbiome (blue square), metabolite (orange circle), DEGs (gray triangle). Lines represent statistically significant correlations and are colored red for positive and blue for negative correlations.
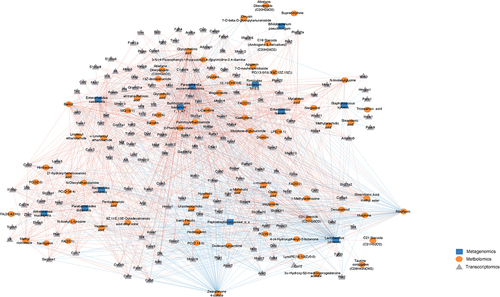
The bacteria P. excrementihominis and B. bacterium 1_1_47 were well connected in the network, accounted for large number of the interactions, and were associated with 76% and 75% of nodes respectively. P. excrementihominis and B. bacterium 1_1_47 positively correlated with M6G, ethanolamines, fatty acids, phosphocholines and had large number of positive correlations with many genes involved in inflammatory and immune responses (, Supplementary Fig. S6A). Pathogenic bacterial taxa E. faecalis and S. xylosus positively correlated with long chain fatty acid (LCFA) metabolites such as myristoleic acid, tricosanoic acid, methyl arachidic acid, eicosadienoic acid, and docosanoic acid. E. faecalis also correlated with changes in ethanolamine. E. faecalis and S. xylosus, and LCFAs correlated with genes involved in lipid binding, transport, localization, and catabolic processes, implicating these taxa in dysfunction of lipid metabolism. Increased N-acylethanolamines (NAEs) levels were negatively corelated with L. johnsonii and Peptostreptococcaceae and had strong positive correlations to P. excrementihominis, B. bacterium 1_1_47, E. faecalis, E. caecimuris, and A. municiphila. Interestingly NAEs also had strong positive correlations to DEGs involved in inflammatory response including Il6, Tlr4, Tlr2, Nlrp3, Nos2, Ccrl2, Cxcl9, Cxcr2 Ccl17, Ccl22, etc. (Supplementary Fig. S6B).
The probiotic bacteria L. johnsonii and commensal Peptstreptococcaceae of unclassified species had major number of negative correlations accounting to 44% and 9% of negative interactions respectively. We also observed strong negative correlations between probiotic bacteria L. johnsonii and several intestinal metabolites including phosphocholines (PC (32:0), PC (0–18:0), PC (35:2)), flavonoids (batilol and hederagenin), ethanolamines and FA (20:4) (, Supplementary Fig. 5A). Moreover, positive correlations were observed between L. johnsonii and several 1° and 2° BAs (Supplementary file 5) as well as with riboflavin. L. johnsonii positively correlated with genes involved in metabolism of lipids and lipid biosynthesis pathways including fatty acid-binding proteins (Fabp6) 6, acyl-CoA synthetase family member 2 (Acsf2), and per2-circadian rhythm (Per2) as well as genes involved in cellular junction such as Abcc2, Ank3, Pmp22, Mmp7, Mmp9, Mmp10, Mmp19 etc. (). Also, L. johnsonii and Peptostreptococcaceae negatively correlated with the upregulated genes involved immune cell chemotaxis and cellular response to cytokine stimulus.
The metabolites riboflavin, zearoline 4-sulfate, M6G, flavanoids, lipid metabolites including fatty acids, phosphocholines, ethanolamines, along with bile acids and carnitines were featured prominently in the network and showed strong correlations to changes in bacterial species and host transcription highlighting metabolites as important mediators of host microbiome interactions.
Discussion
The premise of our work was to 1) comprehensively study the morphine treatment associated changes in ileal microbiome composition and metabolic function. 2) Define the consequence of microbial dysfunction on the host by utilizing transcriptomics and metabolomics. 3) Leverage our findings to identify interventional therapeutic strategies to limit microbial dysbiosis implicated in the development of inflammation.
This is the first study to demonstrate morphine associated multi-kingdom level dysbiosis that was characterized by taxonomic alterations in bacteria, archea, virus, and fungi. Significant enrichment of E. faecalis, S. xylosus, E. caecimuris, P. excrementihominis and Burkholderiales bacterium were observed in the morphine microbiome. Similar microbial perturbations were previously observed in various disease conditions. For example, E. caecimuris, was first characterized from a mouse model of spontaneous colitisCitation43 and is associated with dysbiosis in Crohn’s disease (CD) and autism spectrum disorder.Citation44,Citation45 Parasutterella spp. was previously shown to be abundant in the ileal submucosa of CD patients,Citation46,Citation47 in dysbiotic microbiome of hypertriglyceridemia-related acute pancreatitis,Citation48 and in stool samples of inflammatory bowel syndrome patients,Citation49 and increased abundance of Parasutterella spp. positively correlated to intestinal inflammation.Citation49 Consistent with these findings, the enriched bacteria that include P. excrementihominis, B. bacterium, and E. caecimuris strongly correlated with upregulated genes involved in immune cell chemotaxis and cellular response to cytokine stimulus highlighting the role of these enriched pathobionts in inflammation. Moreover, several of these genes involved in the cellular response to cytokine, including Il18, Il33, Il18bp, Il7r, Il17rc, Il4ra, Il2rg, Il10ra, Il2rb, Il15ra, Il2ra, and Nfil3 showed significant downregulation in AM group compared to the morphine group. These findings clearly indicate that morphine-induced microbial dysbiosis leads to the initiation of host immune response and intestinal inflammation.
Significant depletion of L. johnsonii NCC533 observed in morphine-treated samples corroborates with previous studies showing depletion of bacterial genus Lactobacillus in rodent models and human opioid studies.Citation10,Citation11,Citation18 Decrease in commensal bacteria might be facilitating the expansion of pathogenic bacteria as observed in morphine microbiome. In support of this, L. johnsonii was also shown to inhibit the growth of pathogens like E. faecalis, E. coli, and Salmonella enterica in coculture.Citation50 Lactobacillus can also provide protection against pathogenic invasion by enhancing and maintaining intestinal barrier integrity through regulation of tight junction proteins.Citation51–54 Our integration data is in accordance with these findings and show a positive correlation of L. johnsonii with intestinal barrier related cellular components such as cell-cell junction, brush border membrane, tight junction, and anchoring junction proteins. While it is negatively correlated with genes involved in inflammatory response. Interestingly, the treatment with probiotic cocktail consisting of Lactobacillus has significantly reduced morphine-induced gut epithelial barrier disruption, decreased intestinal inflammation, and development of analgesic tolerance,Citation7 thus highlighting the protective role of Lactobacillus.
Metagenomic functional analysis provided much-needed insight into the changes in the functional potential of the gut bacteria after morphine treatment. Notably, in morphine treatment groups, bacteria displayed an increased potential for LPS, LTA biosynthesis, and increased expression of virulence factors. These findings collectively indicate a taxonomic shift toward a proinflammatory and pathogenic state in morphine microbiome.
Morphine treatment induced simultaneous changes in bacterial and host lipid metabolism are coherent with the increased abundance of various lipid metabolites (ethanolamines, PCs, and FAs) observed in the morphine metabolome. Enrichment of ethanolamines was also observed under various pathological conditions such as in the serum of healthy humans after acute stress, in inflammatory bowel disease (IBD) stool samples, and in colitis model of T-cell transfer.Citation55,Citation56 Bacterial species harboring ethanolamine utilization (Eut B/C) genes can utilize ethanolamine provided by dead cells as a carbon and nitrogen source, thus providing a growth advantage,Citation57–60 and Eut B/C genes have been implicated in pathogenesis and colonization of E. coli in urinary tract infections and CD.Citation59,Citation61 Our metagenomic data indicate an increased abundance of EutC gene in E. faecalis, thus might provide it with a competitive advantage over commensal microbiota. Also, N-acylethanolamines (NEAs) augmentation led to the expansion of pathogenic E. coli, E. faecalis, and Ruminococcus gnavus and resulted in the shift of complex ex-vivo microbial cultures to a more IBD like microbiome.Citation55 Our integration results are in tandem with this, and NAEs had strong positive correlations to P. excrementihominis, B. bacterium 1_1_47, E. faecalis, E. caecimuris and A. municiphila, and DEGs involved in inflammatory response thereby implicating NEAs in the expansion of certain pathogenic bacterial taxa and inflammation.
Accumulation of PCs, another major lipid metabolite group was observed in morphine metabolome. PCs, regulate many biological processes and act as precursors for choline, betaine, and acetylcholine, and influence DNA methylation through one-carbon pathway.Citation62 Importantly, increased abundance of PCs was observed in people with opioid use disorder compared to opioid users.Citation14 Gut bacterial metabolism of choline is implicated in the production of trimethylamine o-oxide (TMAO), a harmful metabolite.Citation63,Citation64 Also, bacterial utilization of choline influences the choline availability to host and thus affect the DNA methylation levels and had transgenerational effect on development of anxiety.Citation65 Considering the high incidence of opioid use in pregnant population and females of childbearing age, and evidence of microbial dysbiosis in mothers and neonates prenatally exposed to hydromorphone,Citation4,Citation13 future studies dissecting dysbiotic microbiome mediated changes in PC metabolism in line with TMAO production, and changes in DNA methylation are much needed.
Furthermore, a decrease in riboflavin was observed in morphine metabolome. Decreased riboflavin levels were also noted in patients using opioids.Citation66 Riboflavin has anti-inflammatory property and its supplementation was shown to inhibit the activation of inflammasome NLRP3,Citation67 protect from LPS-induced septic shock,Citation68 enhance phagocytosis, and limit inflammation.Citation69 Consistently, depletion of riboflavin negatively correlated with several inflammatory response genes such as Tlr2, Il6, Il18, Nlrp12, Ccl22, Cxcr2 and Ccl17. Riboflavin is vital for the maintenance of redox potential, protein synthesis, and survival of microbes,Citation70 and thus, as an adaptive mechanism, an increase in the riboflavin biosynthesis and transporter genes was observed in morphine microbiome. However, other bacterial taxa which lack the genomic capability to produce riboflavin, including L. johnsonii NCC335,Citation71 a morphine mediated decrease in riboflavin availability can be detrimental. Correspondingly, in our integration analysis, depletion of riboflavin positively correlated with depletion of L. johnsonii and Peptostreptococcaceae and negatively correlated with expansion of P. excremntihominis, B. bacterium and E. caecimuris. Riboflavin supplementation in humans was shown to modulate microbiome.Citation72 Riboflavin in the form of flavin adenine dinucleotide and flavin mononucleotide participates in deactivation of reactive oxygen species (ROS).Citation70 Our results and of others indicate that morphine treatment results in inflammatory milieu, activation of macrophages, and influx of neutrophils, which is associated with increased production of ROS and oxidative stress.Citation73 An increased expression of genes Cox1, Duoxa1, Duoxa2, Nos1, Nos2, and Nos3 was indicative of increased oxidative stress in intestinal tissue of morphine treated mice. The increased oxygen radical could favor the expansion of facultative anaerobic bacteria at the expense of obligate anaerobes as observed in morphine dysbiotic bacteria.
In addition to riboflavin, other metabolite changes indicate a decrease in antioxidant levels in the morphine treatment groups, including depletion of spermidine, phenylpropionate, and flavonoids. Flavonoids are shown to improve barrier function and limit inflammation.Citation74 These findings suggest a potential use for riboflavin and flavonoids as potent nutritional targets and need to be tested in preclinical models of opioid use.
Additionally, BAs are shown to regulate the gut mucosal immune responses. We observed downregulation of bile acids transporter genes Asbt, Ostα, and Ostβ which can directly influence the bioavailability of bile acid to intestinal immune cells. Vitamin A metabolite, atRA plays a crucial role in modulating adaptive mucosal immunity and gut tropism in lymphocytes. Vitamin A in the form of retinal is metabolized to atRA by retinol dehydrogenase (RDH) and retinal dehydrogenases in small intestine. Morphine-induced depletion of atRA negatively correlated with genes involved in cellular response to cytokine stimulus, inflammatory response, and TH1 type immune response, signifying the role of atRA in maintaining mucosal immune homeostasis. Alongside, we observed a positive correlation between atRA and morphine depleted commensal L. johnsonii. Although the literature on the role of the gut microbiome on RA metabolism is sparse, recently commensal bacterial taxa from class Clostridia is shown to modulate RA concentration by suppressing the expression of Rdh7.Citation75 We observed a significant decrease in expression of Rdh7 gene in morphine treated group compared to the AM group further confirming the role of microbiome in retinoic acid metabolism.
Together, these findings further highlight the roles of dysbiotic microbiome, alterations in bacterial and host lipid metabolism riboflavin, and flavonoids, etc., in regulating inflammation and host physiology. It is imperative to further understand the relationship between opioid induced alterations in lipid metabolism and opioid associated gut pathology. This study also provided an understanding of the bidirectional host microbiome interactions. However, there are a few limitations to the current study. Firstly, some of these associations remain correlative and warrant further experimental confirmation. Another limitation of the study is the use of an untargeted metabolomics approach, which led to a measure of relative abundances and not absolute concentrations of metabolites. Although we haven’t measured systemic changes in metabolites in blood/serum, the luminal metabolite would serve as a proxy for serum measures. Lastly, even though our metagenomic data have identified significant changes in methanogenic archaea Methanococcus maripaludis, fungi, and viruses in the morphine microbiome, the data is still in its infancy and the functional consequences of these taxonomical changes were not assessed and further studies are warranted to understand their role in production of metabolites and morphine pathophysiology. Our data implies a novel therapeutic intervention targeting ethanolamine metabolism to limit deleterious changes in the gut microbiome following opioid use. Our study also suggests that NEA and PCs can be used as potential biomarkers for intestinal damage and inflammation. In addition, we have identified riboflavin and flavonoids as potent nutritional targets to limit dysbiosis and inflammation. Data from our study hence provide much-needed groundwork and aids in the identification of biomarkers and targets for therapeutic interventions against opioid associated comorbidities and to help understand human studies where mechanistic work such as this is impossible.
Abbreviation
LEfSe, linear discriminant analysis of effect size; LDA, linear discriminant analysis; FDR, false discovery rate; GO, gene ontology; KOs, KEGG orthologs; PCoA, Principial Coordinate Analysis; LC-MS, Liquid chromatography-mass spectrometry; PC, phosphocholines; FA, Fatty acids; M6G, morphine 6-glucoronide; NEA, N-acylethanolamines; DEGs, differentially expressed genes; FC, fold change; GF, germ free; LPS, lipopolysaccharides; LTA, lipoteichoic acid; CD, Crohn’s disease; IBD, inflammatory bowel disease; Eut, ethanolamine utilization; TMA, trimethylamine; TMAO, Trimethylamine O-oxide; ROS, reactive oxygen species; BSH, bacterial bile salt hydrolase; RDH, retinol dehydrogenase; atRA, all-trans-retinoic acid.
Author contributions
U.K., R.J., S.M. and S.Ro. conceived the study design; U.K., R.J. and S.M. performed sample collection; U.K., R.J., S.M., G.N.C. and E.V. conducted in-vivo and ex-vivo experiments; U.K., Y.B., P.K.S. and J.T. performed statistical and bioinformatic analyses; U.K., R.J., S.M. and S.Ro. assisted in data analyses and interpretation. U.K., R.J., S.M. drafted the manuscript; S.Ro and S.Ra provided critical revisions and approved the final manuscript., S.Ro. provided funding and resources.
Data and material availability
The data that support the findings of the study are available in Genbank repository at https://www.ncbi.nlm.nih.gov/geo/query/acc.cgi?acc=GSE230096 with reference number “GSE230096”.
Supplemental Material
Download Zip (36.4 MB)Acknowledgments
We thank histology research laboratory directed by the Department of Pathology & Laboratory Medicine for processing and sectioning intestinal samples. We thank the writing center of University of Miami for assistance with grammar.
Disclosure statement
No potential conflict of interest was reported by the author(s).
Supplementary material
Supplemental data for this article can be accessed online at https://doi.org/10.1080/19490976.2023.2246184
Additional information
Funding
References
- Serices USDoHa H. 2021. What is the U.S. Opioid Epidemic.
- NIDA. 2022. Oerdose death rate.
- Meng J, Yu H, Ma J, Wang J, Banerjee S, Charboneau R, Barke RA, Roy S. 2013. Morphine induces bacterial translocation in mice by compromising intestinal barrier function in a TLR-dependent manner. Plos One. 8:e54040. doi: 10.1371/journal.pone.0054040.
- Abu Y, Tao J, Dutta R, Yan Y, Vitari N, Kolli U, Roy S. 2021. Brief hydromorphone exposure during pregnancy sufficient to induce maternal and neonatal microbial dysbiosis. J Neuroimmune Pharmacol. 17:367–20. doi: 10.1007/s11481-021-10019-2.
- Banerjee S, Sindberg G, Wang F, Meng J, Sharma U, Zhang L, Dauer P, Chen C, Dalluge J, Johnson T, et al. 2016. Opioid-induced gut microbial disruption and bile dysregulation leads to gut barrier compromise and sustained systemic inflammation. Mucosal Immunol. 9(6):1418–1428. doi: 10.1038/mi.2016.9.
- Wang F, Meng J, Zhang L, Johnson T, Chen C, Roy S. 2018. Morphine induces changes in the gut microbiome and metabolome in a morphine dependence model. Sci Rep. 8(1):3596. doi: 10.1038/s41598-018-21915-8.
- Zhang L, Meng J, Ban Y, Jalodia R, Chupikova I, Fernandez I, Brito N, Sharma U, Abreu MT, Ramakrishnan S, et al. 2019. Morphine tolerance is attenuated in germfree mice and reversed by probiotics, implicating the role of gut microbiome. Proc Natl Acad Sci U S A. 116(27):13523–13532. doi: 10.1073/pnas.1901182116.
- Akbarali HI, Dewey WL. 2019. Gastrointestinal motility, dysbiosis and opioid-induced tolerance: is there a link? Nat Rev Gastroenterol Hepatol. 16(6):323–324. doi: 10.1038/s41575-019-0150-x.
- Acharya C, Betrapally NS, Gillevet PM, Sterling RK, Akbarali H, White MB, Ganapathy D, Fagan A, Sikaroodi M, Bajaj JS, et al. 2017. Chronic opioid use is associated with altered gut microbiota and predicts readmissions in patients with cirrhosis. Aliment Pharmacol Ther. 45(2):319–331. doi: 10.1111/apt.13858.
- Barengolts E, Green SJ, Eisenberg Y, Akbar A, Reddivari B, Layden BT, Dugas L, Chlipala G. 2018. Gut microbiota varies by opioid use, circulating leptin and oxytocin in African American men with diabetes and high burden of chronic disease. PLoS One. 13:e0194171. doi: 10.1371/journal.pone.0194171.
- Kang M, Mischel RA, Bhave S, Komla E, Cho A, Huang C, Dewey WL, Akbarali HI. 2017. The effect of gut microbiome on tolerance to morphine mediated antinociception in mice. Sci Rep. 7:42658. doi: 10.1038/srep42658.
- Sindberg GM, Callen SE, Banerjee S, Meng J, Hale VL, Hegde R, Cheney PD, Villinger F, Roy S, Buch S, et al. 2019. Morphine potentiates dysbiotic microbial and metabolic shifts in acute SIV infection. J Neuroimmune Pharmacol. 14(2):200–214. doi: 10.1007/s11481-018-9805-6.
- Abu Y, Roy S. 2021. Prenatal opioid exposure and vulnerability to future substance use disorders in offspring. Exp Neurol. 339:113621. doi: 10.1016/j.expneurol.2021.113621.
- Li YY, Ghanbari R, Pathmasiri W, McRitchie S, Poustchi H, Shayanrad A, Roshandel G, Etemadi A, Pollock JD, Malekzadeh R, et al. 2020. Untargeted metabolomics: Biochemical Perturbations in Golestan cohort study opium users Inform Intervention Strategies. Front Nutr. 7:584585. doi: 10.3389/fnut.2020.584585.
- Cruz-Lebron A, Johnson R, Mazahery C, Troyer Z, Joussef-Pina S, Quinones-Mateu ME, Strauch CM, Hazen SL, Levine AD. 2021. Chronic opioid use modulates human enteric microbiota and intestinal barrier integrity. Gut Microbes. 13:1946368. doi: 10.1080/19490976.2021.1946368.
- O’Sullivan SJ, Malahias E, Park J, Srivastava A, Reyes BAS, Gorky J, Vadigepalli R, Van Bockstaele EJ, Schwaber JS. 2019. Single-cell Glia and Neuron gene expression in the Central Amygdala in opioid Withdrawal Suggests inflammation with correlated gut dysbiosis. Front Neurosci. 13:665. doi: 10.3389/fnins.2019.00665.
- Hofford RS, Mervosh NL, Euston TJ, Meckel KR, Orr AT, Kiraly DD. 2021. Alterations in microbiome composition and metabolic byproducts drive behavioral and transcriptional responses to morphine. Neuropsychopharmacology. 46:2062–2072. doi: 10.1038/s41386-021-01043-0.
- Lee K, Vuong HE, Nusbaum DJ, Hsiao EY, Evans CJ, Taylor AMW. 2018. The gut microbiota mediates reward and sensory responses associated with regimen-selective morphine dependence. Neuropsychopharmacology. 43(13):2606–2614. doi: 10.1038/s41386-018-0211-9.
- Simpson S, Kimbrough A, Boomhower B, McLellan R, Hughes M, Shankar K, de Guglielmo G, George O. 2020. Depletion of the microbiome alters the recruitment of neuronal ensembles of oxycodone intoxication and withdrawal. eNeuro. 7. doi: 10.1523/ENEURO.0312-19.2020.
- Johnson SD, Fox HS, Buch S, Byrareddy SN. 2021. Chronic opioid administration is associated with prevotella-dominated dysbiosis in SIVmac251 infected, cART-treated Macaques. J Neuroimmune Pharmacol. 17:3–14. doi: 10.1007/s11481-021-09993-4.
- Meng J, Banerjee S, Zhang L, Sindberg G, Moidunny S, Li B, Robbins DJ, Girotra M, Segura B, Ramakrishnan S, et al. 2019. Opioids impair intestinal epithelial repair in HIV-infected humanized mice. Front Immunol. 10:2999. doi: 10.3389/fimmu.2019.02999.
- Sharma U, Olson RK, Erhart FN, Zhang L, Meng J, Segura B, Banerjee S, Sharma M, Saluja AK, Ramakrishnan S, et al. 2020. Prescription opioids induce gut dysbiosis and exacerbate colitis in a murine model of inflammatory bowel disease. J Crohns Colitis. 14(6):801–817. doi: 10.1093/ecco-jcc/jjz188.
- Banerjee S, Meng J, Das S, Krishnan A, Haworth J, Charboneau R, Zeng Y, Ramakrishnan S, Roy S. 2013. Morphine induced exacerbation of sepsis is mediated by tempering endotoxin tolerance through modulation of miR-146a. Sci Rep. 3:1977. doi: 10.1038/srep01977.
- Wang F, Meng J, Zhang L, Roy S. 2020. Opioid use potentiates the virulence of hospital-acquired infection, increases systemic bacterial dissemination and exacerbates gut dysbiosis in a murine model of Citrobacter rodentium infection. Gut Microbes. 11(2):172–190. doi: 10.1080/19490976.2019.1629237.
- Wang F, Roy S. 2017. Gut homeostasis, microbial dysbiosis, and opioids. Toxicol Pathol. 45(1):150–156. doi: 10.1177/0192623316679898.
- Love MI, Huber W, Anders S. 2014. Moderated estimation of fold change and dispersion for RNA-seq data with DESeq2. Genome Biol. 15(12):550. doi: 10.1186/s13059-014-0550-8.
- Yu G, Wang LG, Han Y, He QY. 2012. clusterProfiler: an R package for comparing biological themes among gene clusters. OMICS. 16:284–287. doi: 10.1089/omi.2011.0118.
- Kanehisa M, Furumichi M, Tanabe M, Sato Y, Morishima K. 2017. KEGG: new perspectives on genomes, pathways, diseases and drugs. Nucleic Acids Res. 45:D353–D61. doi: 10.1093/nar/gkw1092.
- Chen J, Bardes EE, Aronow BJ, Jegga AG. 2009. ToppGene Suite for gene list enrichment analysis and candidate gene prioritization. Nucleic Acids Res. 37(2):W305–11. doi: 10.1093/nar/gkp427.
- Kaimal V, Bardes EE, Tabar SC, Jegga AG, Aronow BJ. 2010. ToppCluster: a multiple gene list feature analyzer for comparative enrichment clustering and network-based dissection of biological systems. Nucleic Acids Res. 38(2):W96–102. doi: 10.1093/nar/gkq418.
- Shannon P, Markiel A, Ozier O, Baliga NS, Wang JT, Ramage D, Amin N, Schwikowski B, Ideker T. 2003. Cytoscape: a software environment for integrated models of biomolecular interaction networks. Genome Res. 13:2498–2504. doi: 10.1101/gr.1239303.
- Hasan NA, Young BA, Minard-Smith AT, Saeed K, Li H, Heizer EM, McMillan NJ, Isom R, Abdullah AS, Bornman DM, et al. 2014. Microbial community profiling of human saliva using shotgun metagenomic sequencing. PLoS One. 9(5):e97699. doi: 10.1371/journal.pone.0097699.
- Lax S, Smith DP, Hampton-Marcell J, Owens SM, Handley KM, Scott NM, Gibbons SM, Larsen P, Shogan BD, Weiss S, et al. 2014. Longitudinal analysis of microbial interaction between humans and the indoor environment. Sci. 345(6200):1048–1052. doi: 10.1126/science.1254529.
- Segata N, Izard J, Waldron L, Gevers D, Miropolsky L, Garrett WS, Huttenhower C. 2011. Metagenomic biomarker discovery and explanation. Genome Biol. 12:R60. doi: 10.1186/gb-2011-12-6-r60.
- Franzosa EA, McIver LJ, Rahnavard G, Thompson LR, Schirmer M, Weingart G, Lipson KS, Knight R, Caporaso JG, Segata N, et al. 2018. Species-level functional profiling of metagenomes and metatranscriptomes. Nat Methods. 15(11):962–968. doi: 10.1038/s41592-018-0176-y.
- Suzek BE, Wang Y, Huang H, McGarvey PB, Wu CH, UniProt C. 2015. UniRef clusters: a comprehensive and scalable alternative for improving sequence similarity searches. Bioinformatics. 31:926–932. doi: 10.1093/bioinformatics/btu739.
- Karp PD, Riley M, Paley SM, Pellegrini-Toole A. 2002. The MetaCyc database. Nucleic Acids Res. 30:59–61. doi: 10.1093/nar/30.1.59.
- Truong DT, Franzosa EA, Tickle TL, Scholz M, Weingart G, Pasolli E, Tett A, Huttenhower C, Segata N. 2015. MetaPhlAn2 for enhanced metagenomic taxonomic profiling. Nat Methods. 12:902–903. doi: 10.1038/nmeth.3589.
- Chong J, Liu P, Zhou G, Xia J. 2020. Using microbiome analyst for comprehensive statistical, functional, and meta-analysis of microbiome data. Nat Protoc. 15(3):799–821. doi: 10.1038/s41596-019-0264-1.
- Goveia J, Rohlenova K, Taverna F, Treps L, Conradi LC, Pircher A, Geldhof V, de Rooij LPMH, Kalucka J, Sokol L, et al. 2020. An integrated gene expression landscape profiling approach to identify lung tumor endothelial cell heterogeneity and angiogenic candidates. Cancer Cell. 37:21–36 e13. doi: 10.1016/j.ccell.2019.12.001.
- Mihindukulasuriya KA, Mars RAT, Johnson AJ, Ward T, Priya S, Lekatz HR, Kalari KR, Droit L, Zheng T, Blekhman R, et al. 2021. Multi-omics analyses show disease, diet, and transcriptome interactions with the virome. Gastroenterology. 161:1194–207 e8. doi: 10.1053/j.gastro.2021.06.077.
- Ritchie ME, Phipson B, Wu D, Hu Y, Law CW, Shi W, Smyth GK. 2015. Limma powers differential expression analyses for RNA-sequencing and microarray studies. Nucleic Acids Res. 43:e47. doi: 10.1093/nar/gkv007.
- Clavel T, Duck W, Charrier C, Wenning M, Elson C, Haller D. 2010. Enterorhabdus caecimuris sp. nov., a member of the family Coriobacteriaceae isolated from a mouse model of spontaneous colitis, and emended description of the genus Enterorhabdus Clavel et al. 2009. Int J Syst Evol Microbiol. 60(7):1527–1531. doi: 10.1099/ijs.0.015016-0.
- Opstelten JL, Plassais J, van Mil SW, Achouri E, Pichaud M, Siersema PD, Oldenburg B, Cervino ACL. 2016. Gut microbial diversity is reduced in smokers with Crohnʼs disease. Inflamm Bowel Dis. 22:2070–2077. doi: 10.1097/MIB.0000000000000875.
- de Theije CG, Wopereis H, Ramadan M, van Eijndthoven T, Lambert J, Knol J, Garssen J, Kraneveld AD, Oozeer R. 2014. Altered gut microbiota and activity in a murine model of autism spectrum disorders. Brain Behav Immun. 37:197–206. doi: 10.1016/j.bbi.2013.12.005.
- Chiodini RJ, Dowd SE, Chamberlin WM, Galandiuk S, Davis B, Glassing A, Smidt H. 2015. Microbial population differentials between mucosal and submucosal intestinal tissues in advanced Crohn’s disease of the ileum. PLoS One. 10(7):e0134382. doi: 10.1371/journal.pone.0134382.
- Sim WH, Wagner J, Cameron DJ, Catto-Smith AG, Bishop RF, Kirkwood CD. 2010. Novel Burkholderiales 23S rRNA genes identified in ileal biopsy samples from children: preliminary evidence that a subtype is associated with perianal Crohn’s disease. J Clin Microbiol. 48(5):1939–1942. doi: 10.1128/JCM.02261-09.
- Huang C, Chen J, Wang J, Zhou H, Lu Y, Lou L, Zheng J, Tian L, Wang X, Cao Z, et al. 2017. Dysbiosis of intestinal microbiota and decreased antimicrobial peptide level in paneth cells during hypertriglyceridemia-related acute necrotizing pancreatitis in rats. Front Microbiol. 8:776. doi: 10.3389/fmicb.2017.00776.
- Chen YJ, Wu H, Wu SD, Lu N, Wang YT, Liu HN, Dong L, Liu T-T, Shen X-Z. 2018. Parasutterella, in association with irritable bowel syndrome and intestinal chronic inflammation. J Gastroenterol Hepatol. 33:1844–1852. doi: 10.1111/jgh.14281.
- Davoren MJ, Liu J, Castellanos J, Rodriguez-Malave NI, Schiestl RH. 2019. A novel probiotic, Lactobacillus johnsonii 456, resists acid and can persist in the human gut beyond the initial ingestion period. Gut Microbes. 10(4):458–480. doi: 10.1080/19490976.2018.1547612.
- Yi H, Wang L, Xiong Y, Wang Z, Qiu Y, Wen X, Jiang Z, Yang X, Ma X. 2018. Lactobacillus reuteri LR1 Improved expression of genes of tight junction proteins via the MLCK pathway in IPEC-1 cells during infection with Enterotoxigenic Escherichia coli K88. Mediators Inflamm. 2018:1–8. doi: 10.1155/2018/6434910.
- Montalto M, Maggiano N, Ricci R, Curigliano V, Santoro L, Di Nicuolo F, et al. 2004. Lactobacillus acidophilus protects tight junctions from aspirin damage in HT-29 cells. Digestion. 69:225–228. doi: 10.1159/000079152.
- Anderson RC, Cookson AL, McNabb WC, Park Z, McCann MJ, Kelly WJ, Roy NC. 2010. Lactobacillus plantarum MB452 enhances the function of the intestinal barrier by increasing the expression levels of genes involved in tight junction formation. BMC Microbiol. 10:316. doi: 10.1186/1471-2180-10-316.
- Yu Q, Yuan L, Deng J, Yang Q. 2015. Lactobacillus protects the integrity of intestinal epithelial barrier damaged by pathogenic bacteria. Front Cell Infect Microbiol. 5:26. doi: 10.3389/fcimb.2015.00026.
- Fornelos N, Franzosa EA, Bishai J, Annand JW, Oka A, Lloyd-Price J, Arthur TD, Garner A, Avila-Pacheco J, Haiser HJ, et al. 2020. Growth effects of N-acylethanolamines on gut bacteria reflect altered bacterial abundances in inflammatory bowel disease. Nature Microbiol. 5(3):486–497. doi: 10.1038/s41564-019-0655-7.
- Franzosa EA, Sirota-Madi A, Avila-Pacheco J, Fornelos N, Haiser HJ, Reinker S, Vatanen T, Hall AB, Mallick H, McIver LJ, et al. 2019. Gut microbiome structure and metabolic activity in inflammatory bowel disease. Nature Microbiol. 4:293–305. doi: 10.1038/s41564-018-0306-4.
- Zhou J, Xiong X, Wang K, Zou L, Lv D, Yin Y. 2017. Ethanolamine metabolism in the mammalian gastrointestinal tract: mechanisms, patterns, and importance. Curr Mol Med. 17(2):92–99. doi: 10.2174/1566524017666170331161715.
- Kaval KG, Garsin DA, Sperandio V. 2018. Ethanolamine utilization in bacteria. mBio. 9. doi: 10.1128/mBio.00066-18.
- Sintsova A, Smith S, Subashchandrabose S, Mobley HL, Raffatellu M. 2018. Role of ethanolamine utilization genes in host colonization during urinary tract infection. Infect Immun. 86(3). doi: 10.1128/IAI.00542-17.
- Garsin DA. 2010. Ethanolamine utilization in bacterial pathogens: roles and regulation. Nat Rev Microbiol. 8(4):290–295. doi: 10.1038/nrmicro2334.
- Ormsby MJ, Logan M, Johnson SA, McIntosh A, Fallata G, Papadopoulou R, et al. 2019. Inflammation associated ethanolamine facilitates infection by Crohn’s disease-linked adherent-invasive Escherichia coli. EBioMedicine. 43:325–332. doi: 10.1016/j.ebiom.2019.03.071.
- Gurwara S, Ajami NJ, Jang A, Hessel FC, Chen L, Plew S, Wang Z, Graham D, Hair C, White D, et al. 2019. Dietary nutrients involved in one-carbon metabolism and colonic mucosa-associated gut microbiome in individuals with an endoscopically normal colon. Nutrients. 11(3):11. doi: 10.3390/nu11030613.
- Yang S, Li X, Yang F, Zhao R, Pan X, Liang J, Tian L, Li X, Liu L, Xing Y, et al. 2019. Gut microbiota-dependent marker TMAO in promoting cardiovascular disease: inflammation mechanism, clinical prognostic, and potential as a therapeutic target. Front Pharmacol. 10:1360. doi: 10.3389/fphar.2019.01360.
- Geng J, Yang C, Wang B, Zhang X, Hu T, Gu Y, Li J. 2018. Trimethylamine N-oxide promotes atherosclerosis via CD36-dependent MAPK/JNK pathway. Biomed Pharmacother. 97:941–947. doi: 10.1016/j.biopha.2017.11.016.
- Romano KA, Martinez-Del Campo A, Kasahara K, Chittim CL, Vivas EI, Amador-Noguez D, Balskus EP, Rey FE. 2017. Metabolic, epigenetic, and transgenerational effects of gut bacterial choline consumption. Cell Host & Microbe. 22:279–90e7. doi: 10.1016/j.chom.2017.07.021.
- Ghanbari R, Li Y, Pathmasiri W, McRitchie S, Etemadi A, Pollock JD, Poustchi H, Rahimi-Movaghar A, Amin-Esmaeili M, Roshandel G, et al. 2021. Metabolomics reveals biomarkers of opioid use disorder. Transl Psychiatry. 11(1):103. doi: 10.1038/s41398-021-01228-7.
- Ahn H, Lee GS. 2020. Riboflavin, vitamin B2, attenuates NLRP3, NLRC4, AIM2, and non-canonical inflammasomes by the inhibition of caspase-1 activity. Sci Rep. 10(1):19091. doi: 10.1038/s41598-020-76251-7.
- Shih CK, Chen CM, Chen CY, Liu JF, Lin HW, Chou HT, Li S-C. 2010. Riboflavin protects mice against liposaccharide-induced shock through expression of heat shock protein 25. Food Chem Toxicol. 48:1913–1918. doi: 10.1016/j.fct.2010.04.033.
- Dey S, Bishayi B. 2016. Riboflavin along with antibiotics balances reactive oxygen species and inflammatory cytokines and controls Staphylococcus aureus infection by boosting murine macrophage function and regulates inflammation. J Inflamm (Lond). 13(1):36. doi: 10.1186/s12950-016-0145-0.
- Yoshii K, Hosomi K, Sawane K, Kunisawa J. 2019. Metabolism of dietary and microbial Vitamin B family in the regulation of host Immunity. Front Nutr. 6:48. doi: 10.3389/fnut.2019.00048.
- Pridmore RD, Berger B, Desiere F, Vilanova D, Barretto C, Pittet AC, Zwahlen M-C, Rouvet M, Altermann E, Barrangou R, et al. 2004. The genome sequence of the probiotic intestinal bacterium Lactobacillus johnsonii NCC 533. Proc Natl Acad Sci U S A. 101(8):2512–2517. doi: 10.1073/pnas.0307327101.
- Steinert RE, Sadaghian Sadabad M, Harmsen HJ, Weber P. 2016. The prebiotic concept and human health: a changing landscape with riboflavin as a novel prebiotic candidate? Eur J Clin Nutr. 70(12):1348–1353. doi: 10.1038/ejcn.2016.119.
- Mittal M, Siddiqui MR, Tran K, Reddy SP, Malik AB. 2014. Reactive oxygen species in inflammation and tissue injury. Antioxid Redox Signal. 20(7):1126–1167. doi: 10.1089/ars.2012.5149.
- Wang W, Xia T, Yu X. 2015. Wogonin suppresses inflammatory response and maintains intestinal barrier function via TLR4-MyD88-TAK1-mediated NF-kappaB pathway in vitro. Inflamm Res. 64:423–431. doi: 10.1007/s00011-015-0822-0.
- Grizotte-Lake M, Zhong G, Duncan K, Kirkwood J, Iyer N, Smolenski I, Isoherranen N, Vaishnava S. 2018. Commensals suppress intestinal epithelial cell retinoic acid synthesis to regulate interleukin-22 activity and prevent microbial dysbiosis. Immunity. 49:1103–15 e6. doi: 10.1016/j.immuni.2018.11.018.