
ABSTRACT
The role of diet and the gut microbiome in the etiopathogenesis of irritable bowel syndrome (IBS) is not fully understood. Therefore, we investigated the interplay between dietary risk factors and gut microbiota in IBS subtypes using a food frequency questionnaire and stool metagenome data from 969 participants aged 18–65 years in the ZOE PREDICT 1 study, an intervention study designed to predict postprandial metabolic responses. We identified individuals with IBS subtype according to the Rome III criteria based on predominant bowel habits during symptom onset: diarrhea (i.e. looser), constipation (i.e. harder), and mixed. Participants with IBS-D (n = 59) consumed more healthy plant-based foods (e.g. whole grains, leafy vegetables) and fiber, while those with IBS-C (n = 49) tended to consume more unhealthy plant-based foods (e.g. refined grains, fruit juice) than participants without IBS (n = 797). Microbial diversity was nominally lower in patients with IBS-D than in participants without IBS or with IBS-C. Using multivariable-adjusted linear regression, we identified specific microbiota variations in IBS subtypes, including slight increases in pro-inflammatory taxa in IBS-C (e.g. Escherichia coli) and loss of strict anaerobes in IBS-D (e.g. Faecalibacterium prausnitzii). Our analysis also revealed intriguing evidence of interactions between diet and Faecalibacterium prausnitzii. The positive associations between fiber and iron intake and IBS-diarrhea were stronger among individuals with a higher relative abundance of Faecalibacterium prausnitzii, potentially driven by carbohydrate metabolic pathways, including the superpathway of β-D-glucuronide and D-glucuronate degradation. In conclusion, our findings suggest subtype-specific variations in dietary habits, gut microbial composition and function, and diet-microbiota interactions in IBS, providing insights into potential microbiome-informed dietary interventions.
Introduction
Irritable bowel syndrome (IBS) is a prevalent chronic disorder affecting approximately 1 in 10 people globally.Citation1 IBS is characterized by recurrent abdominal pain and changes in stool frequency and form. The impact of IBS extends beyond its symptoms, leading to increased healthcare resource utilization and impairment of the overall quality of life among individuals with IBS.
IBS can be classified into subtypes based on the predominant bowel habits during symptom onset: constipation (IBS-C), diarrhea (IBS-D), mixed (IBS-M), and unclassified (IBS-U). These subtypes are associated with distinct symptom profiles, treatment targets, and inflammatory biomarkers,Citation2,Citation3 suggesting a heterogeneous etiology. Although the exact pathophysiology of IBS is largely unknown, abnormalities in intestinal motility, permeability, and visceral hypersensitivity are potential contributors. Moreover, evidence for patient-preferred treatment approaches, such as dietary modification remains limited.Citation4 While a diet high in fructose and other short-chain fermentable carbohydrates may worsen IBS symptoms,Citation5,Citation6 soluble fiber may represent an effective treatment option.Citation7
Recently, the gut microbiome, which reflects the host genetics, diet, and health, has been suggested to play a potential role in IBS.Citation8–11 Studies transplanting the fecal microbiota from IBS patients into gnotobiotic murine models showed that IBS microbiota drove increased pain sensation, innate immune activation, and altered transit time.Citation10,Citation11 Additionally, probiotic supplementation has been shown to have small effects on managing IBS symptoms in randomized controlled trials.Citation12 However, the gut microbiota variations in IBS subtypes remain underexplored, and findings from human gut microbiome studies in IBS have been inconsistent,Citation8,Citation9,Citation13,Citation14 likely due to modest sample sizes, lack of dietary information, differences in microbial profiling techniques, and differentiation of IBS subtypes.
To address these limitations, we utilized gut metagenomic data and extensive dietary data from the ZOE PREDICT 1 study to examine the associations between habitual diet, gut microbiota, and IBS subtypes.
Resutls
Among the 969 participants, we identified 172 (17.8%; IBS-C: n = 49, IBS-D: n = 59, IBS-M: n = 64) participants who had IBS symptoms, which is comparable to the prevalence of IBS reported in the general UK population (12%).Citation15 We did not identify significant differences in BMI, education, smoking status, antibiotic use, and probiotic use among participants with and without IBS, whereas those with IBS tended to be younger and more likely to be women ().
Table 1. Participants characteristics.
Habitual dietary intakes
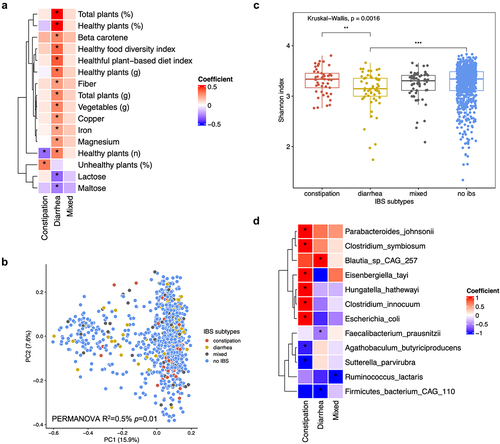
Compared to those without IBS, participants with IBS-D tended to have a higher intake of healthy plant-based foods (e.g., whole grains, leafy vegetables, legumes, nuts, and seeds) and iron, and a lower intake of maltose and lactose (, Supplementary Table S1). In contrast, participants with IBS-C tended to consume unhealthy plant-based foods (e.g., refined grains, fruit juice, and potato) than those without IBS.
Figure 1. Dietary intakes and gut microbial composition differed by IBS subtypes.
Gut microbial taxonomic and functional features
According to the permutational multivariate analysis of variance (PERMANOVA), the overall gut microbial community differed slightly across IBS subtypes (, p-value = .01), although IBS subtype only explained a small portion of the variation in the overall gut microbiota composition (R2 = 0.5%). The gut microbiome alpha-diversity was different across IBS subtype (, Kruskal-Wallis test: p-value = .0016), with a slightly lower alpha-diversity in IBS-D as compared to IBS-C subtype and non-IBS. Other diversity metrics showed similar differences across IBS subtype (Supplementary Figure S1).
Among the 170 gut taxa, 12 taxa were associated with IBS subtypes [Benjamini-Hochberg adjusted p-value < .10, , Supplementary Table S2], after adjusting for a wide range of host factors, including age, sex, education, and dietary quality. Compared to non-IBS, healthy commensal anaerobes were depleted in IBS-D, including Faecalibacterium prausnitzii and Firmicutes bacterium CAG 110. IBS-C was associated with an elevated relative abundance of opportunistic pathogens, such as Escherichia coli. The additional adjustment for the Bristol stool scale only slightly attenuated the results (Supplementary Table S3).
Among the 301 functional pathways, 30 pathways were associated with IBS subtypes (Supplementary Figure S2, Supplementary Table S4). Compared to the non-IBS group, a few pathways of amino acid biosynthesis, sulfur metabolism, and sugar degradation were depleted in IBS-D, including the superpathway of sulfate assimilation and cysteine biosynthesis and the fucose degradation pathway. In contrast, compared to non-IBS, a few energy metabolism pathways were enriched in IBS-C, including the superpathway of thiamine diphosphate biosynthesis II.
Strain-level analysis of gene families showed that some genomic regions of Alistipes putredinis (e.g., ABC-type multidrug transport system), Bacteroides vulgatus (transcriptional regulator), and F. praustnitzii (Class V aminotransferase) were negatively associated with IBS-D, and those of Clostridium comes (e.g., Class II aldolase/adducin family protein) were positively associated with IBS-C (Supplementary Figure S3–6). Many of the proteins containing these domains are part of carbohydrate metabolism, including glycogen phosphorylase from Class V aminotransferaseCitation16 and L-fuculose phosphate aldolase from Class II aldolase/adducin family protein that is involved in fucose metabolism.Citation17 The deoxyhexose sugar fucose is a common component of human gut mucosal surfaces and an important dietary nutrient in establishing healthy microbiota.Citation18 Alterations in the fucosylation pattern are associated with infection, intoxication, and inflammatory diseases, including Crohn’s diseases.Citation19 There appeared to be no overall strain-level selective pressures that explain the variance in IBS subtypes, according to the phylogenetic logistic mixed model (data not shown).
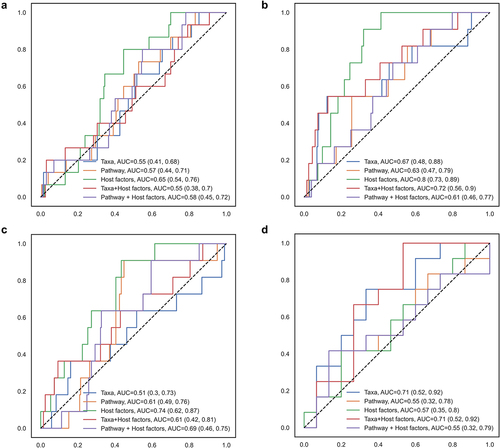
Random forest classification showed that although outperformed by host factors, including diet, BMI, and probiotic use (), gut microbial taxa and functional pathways showed moderate accuracy from machine learning models in differentiating IBS-D from IBS-C [Area under the curve (AUC): taxa = 0.71, pathway = 0.55, host factors = 0.57] or non-IBS (AUC: taxa = 0.67, pathway = 0.63, host factors = 0.80). The combination of host factors with taxa or pathway did not materially improve the accuracy of prediction. Taxa and pathways identified in the random forest model overlapped with those identified in the linear regressions (Supplementary Figure S7, Supplementary Figure S8, Supplementary Figure S9), including the pathogenic E. coli in distinguishing IBS-C, and Firmicutes bacterium CAG 110 in distinguishing IBS-D.
Figure 2. Random forest model classifying IBS subtypes according to gut microbial taxa, functional pathways, and host factors.
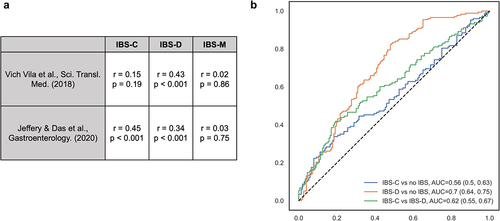
Our results are comparable to those of previous studies ().Citation8,Citation9,Citation13 Our taxonomic-level parameter estimates for IBS-C and IBS-D were moderately correlated with those in prior studies, whereas there was little agreement for IBS-M. The more consistent correlation for IBS-D (r: 0.43 vs. 0.34, p < .001 in both comparisons) compared to IBS-C (r = 0.15, p = .19 vs. r = 0.45, p < .001) is likely to be partly attributed to the rapid transit time in IBS-D. However, only 10–50% of our IBS-associated taxa were found to be associated with IBS in prior studies,Citation8,Citation13 including F. prausnitzii, E. coli, and Clostridium symbiosum, which could be due to differences in patient populations and definitions of IBS (Rome IV vs. Rome III). Additionally, a random forest model trained based on our data showed moderate performance in classifying IBS-C, IBS-D, and healthy controls in Mars et al. (IBS-C vs. no IBS: AUC = 0.56; IBS-D vs. no IBS: 0.70; IBS-C vs. IBS-D: AUC = 0.62).
Figure 3. Taxonomic-level results were comparable with prior studies.
Diet-microbiota interaction
Most IBS-associated taxa were correlated with IBS-associated dietary factors (Supplementary Figure S10). Healthy dietary factors, such as healthful plant-based diet index, vegetables, and magnesium, were negatively correlated with pro-inflammatory taxa, such as E. coli and Clostridium innocuum, and were positively correlated with probiotic anaerobes, F. prausnitzii and Agathobaculum butyriciproducens.
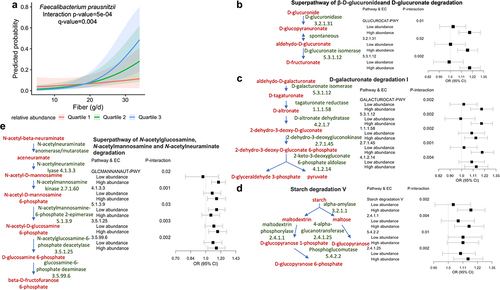
Our interaction analysis indicated that the associations between a couple key IBS dietary risk factors and IBS-D were dependent on the relative abundances of F. prausnitzii (Supplementary Table S5). The positive associations of fiber and iron intake with IBS-D were stronger when the relative abundance of F. prausnitzii was higher (). Among the IBS-D-associated pathways that contributed from F. prausnitzii (Supplementary Table S6), the superpathway of β-D-glucuronide and D-glucuronate degradation (GLUCUROCAT-PWY), D-galacturonate degradation I (GALACTUROCAT-PWY), starch degradation V, and superpathway of N-acetylglucosamine, N-acetylmannosamine, and N-acetylneuraminate degradation (GLCMANNANAUT-PWY) drove the modifying role of F. prausnitzii in IBS-D response to dietary fiber and iron (, Supplementary Table S7).
Figure 4. The association between dietary fiber and IBS-D varied by the relative abundance of Faecalibacterium prausnitzii.
Secondary analyses
Analyses in women (Supplementary Figure S11, Supplementary Table S8–9) and in participants without multiply imputed dietary intake (Supplementary Table S10–11), though slightly attenuated, produced similar association of individual dietary factors (100% and 31% overlap, respectively), the overall gut microbial composition, and individual taxa (25% and 75% overlap, respectively) with IBS subtypes. The overall gut microbial community and alpha diversity were slightly different between participants without and without IBS when analyzed without subtype stratification (Supplementary Figure S12), with only 5 and 4 taxa associated with IBS (Rome III criteria) and self-reported IBS diagnoses (Supplementary Table S12), respectively. There was little differences in the taxonomic profiles between participants with (n = 26) and without IBS-C (n = 128) among participants with frequent constipation (Supplementary Table S13), and between participants with (n = 24) and without IBS-D (n = 99) among participants with frequent diarrhea (Supplementary Table S14).
Discussion
In a well-characterized cohort of adults with whole gut metagenome data and comprehensive dietary assessment, we observed distinct habitual dietary intakes and gut microbiota variations according to IBS subtype. Compared to participants without IBS, participants with IBS-D had higher intakes of healthy plant-based foods (e.g., whole grains, whole fruits, vegetables, legumes), magnesium, and iron, and lower intakes of maltose and lactose, which were common triggers for IBS symptoms such as bloating and diarrhea.Citation20 While IBS-C was associated with a slight increase in typically pro-inflammatory bacteria (e.g., Escherichia coli), IBS-D was associated with a loss of commensal, butyrate-producing anaerobic bacteria (e.g., Faecalibacterium prausnitzii), explaining the overall lower microbial diversity in IBS-D. Although outperformed by other risk factors, such as age, sex, and diet, as expected for the multifactorial etiology of IBS, gut microbial taxa and functional pathways were independent machine learning predictors distinguishing participants with IBS-D from those with IBS-C or without IBS.
Our study also suggests that the gut microbiota could potentially modify the association between diet and IBS subtypes. Specifically, the positive associations between dietary fiber and iron intake and IBS-D were stronger when the relative abundance of F. prausnitzii was higher, which was potentially driven by several glycan metabolic pathways, including GLUCUROCAT-PWY and its key enzyme glucuronidase. Microbial glucuronidase, which catalyzes the hydrolysis of β-glucuronide and can remove glucuronic acid from its conjugate with hydrophobic xenobiotics, thereby releasing xenobiotics into the gut lumen and affecting the activities and toxicities of various xenobiotics and drugs.Citation21 For example, microbial glucuronidase can reactivate the excreted metabolite of irinotecan, a chemotherapy drug for colorectal cancer, causing adverse gut responses such as diarrhea.Citation22 Dietary fiber can reduce irinotecan toxicity partially through increased cecal butyrate levels.Citation23 In turn, an elevated level of glucuronidase may diminish the benefits of fiber in IBS-D. Taken together, our findings add evidence to the subtype-specific microbiome-IBS associations and provide insights into microbiome-informed and subtype-specific dietary interventions for IBS.
Our results compare favorably with previous findings,Citation8,Citation9,Citation13 with moderate correlations between parameter estimates for individual taxa and acceptable performance of between-study machine learning predictions, indicating potential generalizability. Our study showed similar findings in decreased overall microbial diversity and decreased relative abundance of the butyrate-producing F. prausnitzii in IBS-D.Citation8,Citation13,Citation14 F. prausnitzii is one of the most dominant anaerobes in the human gut and plays an important role in gut wellbeing, protecting against inflammatory bowel disease and colorectal cancer, largely due to its putative anti-inflammatory properties.Citation24 Murine models showed that F. prausnitzii could restore the colonic serotonin levels to normal in chemical-induced chronic low-grade inflammation.Citation25 Serotonin is a crucial neurotransmitter modulating gastrointestinal motility and nociception,Citation26 both of which are involved in IBS pathophysiology. Specifically, a rodent IBS model demonstrated that a daily dose of F. prausnitzii A2–165 strain for 10 days could markedly reduce colonic hypersensitivity and strengthen the intestinal epithelial barrier,Citation27 implicating the possible use of F. prausnitzii as a treatment for IBS. Since butyrate can ameliorate inflammation and modulate visceral sensitivity,Citation28 selective loss of butyrate-producers may contribute to abdominal pain in patients with IBS. A randomized, placebo-controlled clinical trial has shown that microencapsulated sodium butyrate can reduce pain during defecation in IBS patients.Citation29 Additionally, the loss of beneficial anaerobes may partially contribute to the association we observed between healthy plant-based foods and IBS-D, since in the absence of microbes necessary for carbohydrate fermentation, these typically beneficial foods may actually have negative impacts on health.Citation30 For example, a recent study using colonic biopsies cultured ex vivo and an adult randomized controlled trial demonstrated that dietary β-fructan induced inflammation in patients with active inflammatory bowel disease who lack fermentative microbes.Citation31
IBS-associated decreases in strictly anaerobic bacteria and potentially increased inflammation may allow for the proliferation of non-fastidious, facultative bacteria such as Escherichia coli, which was increased in the gut of our IBS-C patients. Moreover, we found that taxa that have been linked to colorectal cancer (e.g., Hungatella hathewayi and Eisenbergiella tayi)Citation32,Citation33 and the gut-brain axis (e.g., Parabacteroides johnsonii)Citation34,Citation35 were slightly increased in IBS-C. The enrichment of Parabacteroides has been correlated with decreased hippocampal function and alterations in gene expression in dopaminergic signaling and neurodegenerative disease in ratsCitation35 as well as increased plasma proline and depression scores in humans.Citation34
The strengths of our study include the large sample size, the use of shotgun metagenomic sequencing data, and comprehensive measurements of participant characteristics, including dietary intake, enabling us to explore the complicated gut microbial composition and functions in IBS subtypes with high resolution and control for potential confounders.
One of the limitations of our study was its cross-sectional design. We were unable to discern causal mechanisms or disentangle any changes in diet and the gut microbiome following the progression and variations of IBS symptoms.Citation4 It is possible that the observed positive associations between plant-based foods and IBS-D could be partially due to adherence to dietary recommendations from health care providers in an effort to treat symptoms. Moreover, we could not distinguish between the intake of soluble and insoluble fibers, which might have differential effects on IBS symptoms.Citation7 Although we used a detailed questionnaire to assess IBS subtypes, which was more sensitive than self-reported physician diagnosis of IBS, we did not have information on the severity or duration of IBS.
In summary, our findings suggest IBS subtype-specific variations in gut microbial composition, function, and diet-microbiota interactions, providing insights into potential biomarkers of IBS and microbiome-informed personalized dietary interventions for IBS treatment. Longitudinal studies are warranted to confirm our results. Furthermore, a randomized controlled feeding trial may help unravel whether IBS patients have a differential response to dietary interventions depending on their gut microbiome composition and disease subtype.
Material and methods
Study population
The ZOE PREDICT 1 was a single-arm, single-blinded multinational intervention study (NCT03479866) conducted between June 5th, 2018, and May 8th, 2019. The study enrolled a primary cohort (1,002 healthy adults) from London, UK, and a validation cohort (100 healthy adults) from Boston, MA, USA. The eligibility criteria (e.g., aged 18–65 years) have been previously described.Citation36 Ethical approval for the study was obtained from the Research Ethics Committee and Integrated Research Application System (IRAS 236,407) in the UK and from the institutional review board (Mass General Brigham IRB 2018P002078) in the US. The trial was conducted in accordance with the Good Clinical Practice and Declaration of Helsinki. Written informed consent was obtained from all the participants. In the current study, we included 969 UK participants who provided stool samples and completed questionnaires during the baseline clinical visit.
Assessment of IBS symptoms
In the baseline survey, we asked the participants if they experienced symptoms consistent with Rome III for IBS. We asked participants if they experienced abdominal discomfort or pain, starting at least six months prior and occurring at least 3 days per month in the past three months, associated with at least two of the following symptoms: discomfort or pain related to defecation, altered defecation frequency, or altered stool consistency. The Rome III criteria have been shown to perform modestly in predicting the clinical diagnosis of IBS.Citation37 Participants were categorized by subtype using predominant (≥25% of bowel movements) change in stool form when the abdominal discomfort or pain started: constipation (IBS-C) if they reported harder stools, diarrhea (IBS-D) if they reported looser stools, mixed (IBS-M) subtype if they reported both harder and softer stools, and unclassified (IBS-U) subtype if they reported none of these changes. Participants with IBS-U were subsequently excluded from the analysis because of the small sample size (n = 3). The participants also reported whether they had ever been diagnosed with IBS by a physician.
Baseline stool sample collection, metagenomic sequencing, quality control, and profiling
Sample collection and sequencing procedures have been reported in more detail elsewhere.Citation38 Specifically, participants self-collected stool samples at home using the EasySampler collection kit (ALPCO). Samples were stored at ambient temperature until receipt in the laboratory, where they were homogenized, aliquoted, and stored at −80°C. The sample collection procedure was internally validated by testing different DNA extraction kits, storage conditions, and sequencing techniques.
Before metagenomic sequencing, a Fragment Analyzer (Agilent Technologies) was used to assess sample quality and quantity. For DNA fragmentation, end-repair, and A-tailing, the NEBNext Ultra II FS DNA module (cat #E7810S/L) was used. For adapter ligation, the NEBNext Ultra II Ligation module (cat #E7595S/L) was used. Using the Illumina NovaSeq600 platform, libraries were sequenced for 300 bp paired-end reads and a 1.1 nM library was used for flow cell loading. The NovaSeq control software NCS v1.5, Illumina data analysis pipeline RTA 3.3.5, and Bcl2fastq v2.20 were used. A preprocessing pipeline (https://github.com/SegataLab/preprocessing) was used for the quality control. Following the general guidelines,Citation39 we performed taxonomic (MetaPhlAn v.3.0)Citation40 and functional (HUMAnN v.3.0 and UniRef database release 2014–07)Citation41 profiling using the bioBakery analysis environment. Reads aligned with MAPQ values of < 5 were filtered. A total of 1107 taxa 1001 pathways were discovered. The average number of species for individuals without IBS, with IBS-C, IBS-D, and IBS-M were 119 ± 17, 116 ± 20, 111 ± 17, and 115 ± 17, respectively.
We computed within-person diversity (alpha diversity) using the Shannon diversity index, Simpson’s diversity index, and richness, as well as between-person diversity (beta diversity) using Bray-Curtis dissimilarity and Jaccard distance.
Assessment of habitual diet
Habitual diet in the past year was assessed using the 131-item European Prospective Investigation into Cancer and Nutrition (EPIC) food frequency questionnaire (FFQ), which has been validated against pre-established biomarkers.Citation42 Nutrient intakes were estimated using the FETA software (v2.53).Citation43 FFQs were excluded if > 10 food items were unanswered and if the ratio of estimated total energy intake and participant’s basal metabolic rate estimated by the Harris Benedict equation was > 2SD away from the mean (<0.52 or > 2.58).Citation44
Food categorization and the calculation of dietary indices have been described previously:Citation38 including the healthy food diversity (HFD) index, healthy eating index (HEI) 2010, plant-based diet index (PDI), and alternative Mediterranean diet (aMED) score.
Statistical analysis
To compare differences in participants’ characteristics and gut microbial alpha-diversity by IBS subtype, we used the Kruskal-Wallis test for continuous variables and the Chi-square test for categorical variables. For gut microbial alpha diversity, pairwise comparisons between each group were performed using the Wilcoxon rank-sum test. We performed PERMANOVA using the vegan R packageCitation45 to assess whether microbial beta diversity differed by IBS subtype, which was visualized using principal coordinate analysis (PCoA).
We used linear regression with MaAsLin2Citation46 to identify individual dietary risk factors, taxa, and pathways associated with IBS subtypes after adjusting for the following self-reported risk factors selected a priori: sex, age, educational attainment, smoking, menopausal status, menopausal hormone therapy, antibiotic use in the past three months, regular probiotic use, body mass index, total energy intake, and overall diet quality assessed by the HEI 2010 score (not adjusted for dietary risk factors). Dietary risk factors were standardized using z-scores. The taxa and pathway relative abundances were normalized by total sum scaling and log-transformed. After filtering those with low prevalence (≤0.1) or low abundance (≤0.0001%), we analyzed 170 taxa and 301 pathways in linear regression. Continuous covariates were z-score standardized, with five participants (0.5%) missing BMI imputed with the median value. Missing dietary information among 71 (7.3%) participants was multiply imputed using the SAS PROC MI procedure (Markov Chain Monte Carlo method) based on IBS status, the above-mentioned covariates, as well as other participant characteristics, including physical activity, hypertension, hypercholesterolemia, and multivitamin intake.
We conducted strain-level analysis using ANPAN (https://github.com/biobakery/anpan) to (1) identify gene families contributed by each taxon that were associated with IBS subtypes via logistic regression models adjusted for age and sex, and (2) assess whether the phylogenetic structure of each taxon was associated with IBS subtypes via logistic mixed models adjusted for age and sex, with the phylogenetic structure as the random effect. Gene families were filtered based on the initial gene prevalence [>5 and <;(N-5) positives per group], species prevalence, and final gene prevalence (removing marginal genes that became almost constant). Phylogenies were estimated for each taxon from gene matrices using the ape package.
To investigate the potential interplay between diet and gut microbiota in IBS subtypes, we first examined the correlations between IBS-associated dietary factors and IBS-associated taxa using HAllA (v.0.8.20), a computational method for pattern discovery in high-dimensional datasets.Citation47 We then selected correlated diet and taxa and tested their interactions (continuous variables) in each IBS subtype using a multivariable-adjusted binomial model. Furthermore, to identify the pathways underlying the diet-taxa interaction, we examined pathways contributed by each species associated with IBS subtypes via the linear models described above and examined the interactions between diet and these pathways as well as the involved enzymes. We excluded highly correlated pathways (Pearson correlation > 0.9) while keeping the most abundant one in each correlated cluster as representative.
We employed random forest analysis based on the scikit-learn Python packageCitation48 for the machine learning classification of IBS subtypes according to host factors (regression model covariates), gut microbial taxa, functional pathways, the combination of host factors and taxa, and the combination of host factors and pathways. We implemented a 5-fold cross-validation approach and estimated the area under the curve (AUC) with 95% confidence intervals based on a 75/25 random split of training and testing datasets and 9999 resamples for the bootstrap distribution.
We compared our findings with those of previous studiesCitation8,Citation9,Citation13 by testing the Pearson correlation between taxonomic-level parameter estimates and assessing the performance of a random forest model trained by our data in predicting IBS subtypes in Mars et al.Citation9
To test the robustness of our findings, we conducted sensitivity analyses by (1) additionally adjusting for the Bristol stool scale to examine whether different stool consistency affect the results, (2) repeating the analyses in female participants (N = 701), (3) repeating the analyses in participants (N = 898) without imputation of dietary information, and (4) analyzing IBS (without subtype stratification) and self-reported doctor diagnosis of IBS (n = 125) as secondary outcomes. Additionally, among participants with frequent constipation or diarrhea (hard/lumpy or loose/mushy/watery stools ≥ 50% of the time in the past 3 months), we conducted multivariate linear regression analyses to compare the differences between participants without IBS and those with IBS-C and IBS-D, respectively.
We corrected p-values for multiple hypotheses testing using the Benjamini-Hochberg method and considered an adjusted p-value (q-value) <0.10 as statistically significant.
Abbreviations
| aMED | = | alternative Mediterranean diet |
| EPIC | = | European Prospective Investigation into Cancer and Nutrition |
| FFQ | = | food frequency questionnaire |
| HEI | = | healthy eating index |
| HFD | = | healthy food diversity |
| hPDI | = | healthful plant-based diet index |
| IBS | = | irritable bowel syndrome |
| IBS-C | = | irritable bowel syndrome constipation |
| IBS-D | = | irritable bowel syndrome-diarrhea |
| IBS-M | = | irritable bowel syndrome-mixed |
| IBS-U | = | irritable bowel syndrome-unclassified |
| PDI | = | plant-based diet index |
| PREDICT | = | Personalized Responses to Dietary Composition Trial |
| uPDI | = | unhealthful plant-based diet index |
Supplemental Material
Download PDF (4 MB)Supplemental Material
Download MS Excel (316.4 KB)Acknowledgments
We thank the participants of the Zoe PREDICT 1 study, staff of Zoe Global, and all members of the Segata, Berry, and Spector laboratories for running the study, data collection, and data processing.
Disclosure statement
ZOE PREDICT 1 was supported by Zoe Ltd., for which Dr. Chan and Dr. Drew served as investigators. Dr. Chan served as a consultant for Pfizer Inc. and Boehringer Ingelheim for unrelated studies and a grant support from Pfizer Inc. and Freenome for unrelated studies. Dr. Huttenhower and Dr. Segata are on the Scientific Advisory Board of Zoe Ltd. Dr. Berry and Dr. Spector have equity in Zoe Ltd. Mr. Wolf is an employee of Zoe Ltd. Dr. Staller has received research support from Ironwood and Urovant and has served as a consultant for Anji, Ardelyx, Arena, Gelesis, GI Supply, Restalsis, and Sanofi. No other disclosures have been reported.
Data availability statement
Gut metagenome sequencing data can be accessed from the European Nucleotide Archive (accession number: PRJEB39223). Other data, analytical methods, and study materials can be made available to collaborators upon reasonable request from https://twinsuk.ac.uk/resources-for-researchers/access-our-data/.
Supplementary material
Supplemental data for this article can be accessed online at https://doi.org/10.1080/19490976.2023.2262130
Additional information
Funding
References
- Oka P, Parr H, Barberio B, Black CJ, Savarino EV, Ford AC. Global prevalence of irritable bowel syndrome according to Rome III or IV criteria: a systematic review and meta-analysis. Lancet Gastroenterol Hepatol. 2020;5(10):908–13. doi:10.1016/S2468-1253(20)30217-X.
- Kibune-Nagasako C, García-Montes C, Silva-Lorena SL, Aparecida-Mesquita M. Irritable bowel syndrome subtypes: clinical and psychological features, body mass index and comorbidities. Rev Esp Enferm Dig. 2016;108(2):59–64. doi:10.17235/reed.2015.3979/2015.
- Choghakhori R, Abbasnezhad A, Hasanvand A, Amani R. Inflammatory cytokines and oxidative stress biomarkers in irritable bowel syndrome: association with digestive symptoms and quality of life. Cytokine. 2017;93:34–43. doi:10.1016/j.cyto.2017.05.005.
- Chey WD, Kurlander J, Eswaran S. Irritable bowel syndrome: a clinical review. Jama. 2015;313(9):949–958. doi:10.1001/jama.2015.0954.
- Melchior C, Douard V, Coëffier M, Gourcerol G. Fructose and irritable bowel syndrome. Nutr Res Rev. 2020;33(2):235–243. doi:10.1017/S0954422420000025.
- Staudacher HM, Whelan K. The low FODMAP diet: recent advances in understanding its mechanisms and efficacy in IBS. Gut. 2017;66(8):1517–1527. doi:10.1136/gutjnl-2017-313750.
- Bijkerk C, De Wit N, Muris J, Whorwell P, Knottnerus J, Hoes A. Soluble or insoluble fibre in irritable bowel syndrome in primary care? Randomised placebo controlled trial. Bmj. 2009;339(aug27 2):b3154–b3154. doi:10.1136/bmj.b3154.
- Vich Vila A, Imhann F, Collij V, Jankipersadsing SA, Gurry T, Mujagic Z, Kurilshikov A, Bonder MJ, Jiang X, Tigchelaar EF, et al. Gut microbiota composition and functional changes in inflammatory bowel disease and irritable bowel syndrome. Sci Transl Med. 2018;10(472):eaap8914. doi:10.1126/scitranslmed.aap8914.
- Mars RA, Yang Y, Ward T, Houtti M, Priya S, Lekatz HR, Tang X, Sun Z, Kalari KR, Korem T, et al. Longitudinal multi-omics reveals subset-specific mechanisms underlying irritable bowel syndrome. Cell. 2020;182(6):1460–73. e17. doi:10.1016/j.cell.2020.08.007.
- Crouzet L, Gaultier E, Del’homme C, Cartier C, Delmas E, Dapoigny M, Fioramonti J, Bernalier-Donadille A. The hypersensitivity to colonic distension of IBS patients can be transferred to rats through their fecal microbiota. Neurogastroent Motil. 2013;25(4):e272–e282. doi:10.1111/nmo.12103.
- De Palma G, Lynch MD, Lu J, Dang VT, Deng Y, Jury J, Umeh G, Miranda PM, Pigrau Pastor M, Sidani S, et al. Transplantation of fecal microbiota from patients with irritable bowel syndrome alters gut function and behavior in recipient mice. Sci Transl Med. 2017;9(379):eaaf6397. doi:10.1126/scitranslmed.aaf6397.
- McKenzie Y, Thompson J, Gulia P, Lomer M. British dietetic association systematic review of systematic reviews and evidence‐based practice guidelines for the use of probiotics in the management of irritable bowel syndrome in adults (2016 update). J Hum Nutr Diet. 2016;29(5):576–592. doi:10.1111/jhn.12386.
- Jeffery IB, Das A, O’Herlihy E, Coughlan S, Cisek K, Moore M, Bradley F, Carty T, Pradhan M, Dwibedi C, et al. Differences in fecal microbiomes and metabolomes of people with vs without irritable bowel syndrome and bile acid malabsorption. Gastroenterology. 2020;158(4):1016–28. e8. doi:10.1053/j.gastro.2019.11.301.
- Pittayanon R, Lau JT, Yuan Y, Leontiadis GI, Tse F, Surette M, Moayyedi P. Gut microbiota in patients with irritable bowel syndrome—a systematic review. Gastroenterology. 2019;157(1):97–108. doi:10.1053/j.gastro.2019.03.049.
- Hungin A, Whorwell P, Tack J, Mearin F. The prevalence, patterns and impact of irritable bowel syndrome: an international survey of 40 000 subjects. Aliment Pharmacol Ther. 2003;17(5):643–650. doi:10.1046/j.1365-2036.2003.01456.x.
- El-Sayed AS, Shindia AA. PLP-Dependent Enzymes: a Potent Therapeutic Approach for Cancer and Cardiovascular Diseases. In: Targets Gene Ther. United Kingdom: IntechOpen; 2011. p. 119–146.
- Dreyer MK, Schulz GE. Catalytic mechanism of the metal-dependent fuculose aldolase from Escherichia colias derived from the structure. J Mol Biol. 1996;259(3):458–466. doi:10.1006/jmbi.1996.0332.
- Garber JM, Hennet T, Szymanski CM. Significance of fucose in intestinal health and disease. Mol Microbiol. 2021;115(6):1086–1093. doi:10.1111/mmi.14681.
- McGovern DP, Jones MR, Taylor KD, Marciante K, Yan X, Dubinsky M, Ippoliti A, Vasiliauskas E, Berel D, Derkowski C, et al. Fucosyltransferase 2 (FUT2) non-secretor status is associated with Crohn’s disease. Hum Mol Genet. 2010;19(17):3468–3476. doi:10.1093/hmg/ddq248.
- Yang J, Deng Y, Chu H, Cong Y, Zhao J, Pohl D, Misselwitz B, Fried M, Dai N, Fox M, et al. Prevalence and presentation of lactose intolerance and effects on dairy product intake in healthy subjects and patients with irritable bowel syndrome. Clin Gastroenterol Hepatol. 2013;11(3):262–8. e1. doi:10.1016/j.cgh.2012.11.034.
- Dashnyam P, Mudududdla R, Hsieh T-J, Lin T-C, Lin H-Y, Chen P-Y, Hsu C-Y, Lin C-H. β-glucuronidases of opportunistic bacteria are the major contributors to xenobiotic-induced toxicity in the gut. Sci Rep. 2018;8(1):16372. doi:10.1038/s41598-018-34678-z.
- Guthrie L, Gupta S, Daily J, Kelly L. Human microbiome signatures of differential colorectal cancer drug metabolism. npj Biofilm Microbio. 2017;3(1):27. doi:10.1038/s41522-017-0034-1.
- Lin XB, Farhangfar A, Valcheva R, Sawyer MB, Dieleman L, Schieber A, Gänzle MG, Baracos V. The role of intestinal microbiota in development of irinotecan toxicity and in toxicity reduction through dietary fibres in rats. PloS One. 2014;9(1):e83644. doi:10.1371/journal.pone.0083644.
- Lopez-Siles M, Duncan SH, Garcia-Gil LJ, Martinez-Medina M. Faecalibacterium prausnitzii: from microbiology to diagnostics and prognostics. ISME J. 2017;11(4):841–852. doi:10.1038/ismej.2016.176.
- Martín R, Miquel S, Chain F, Natividad JM, Jury J, Lu J, Sokol H, Theodorou V, Bercik P, Verdu EF, et al. Faecalibacterium prausnitzii prevents physiological damages in a chronic low-grade inflammation murine model. BMC Microbiol. 2015;15(1):1–12. doi:10.1186/s12866-015-0400-1.
- Coates MD, Johnson AC, Greenwood‐van Meerveld B, Mawe GM. Effects of serotonin transporter inhibition on gastrointestinal motility and colonic sensitivity in the mouse. Neurogastroent Motil. 2006;18(6):464–471. doi:10.1111/j.1365-2982.2006.00792.x.
- Miquel S, Martín R, Lashermes A, Gillet M, Meleine M, Gelot A, Eschalier A, Ardid D, Bermúdez-Humarán LG, Sokol H, et al. Anti-nociceptive effect of Faecalibacterium prausnitzii in non-inflammatory IBS-like models. Sci Rep. 2016;6(1):1–8. doi:10.1038/srep19399.
- Canani RB, Di Costanzo M, Leone L, Pedata M, Meli R, Calignano A. Potential beneficial effects of butyrate in intestinal and extraintestinal diseases. World J Gastroenterol: WJG. 2011;17(12):1519. doi:10.3748/wjg.v17.i12.1519.
- Banasiewicz T, Krokowicz Ł, Stojcev Z, Kaczmarek B, Kaczmarek E, Maik J, Marciniak R, Krokowicz P, Walkowiak J, Drews M, et al. Microencapsulated sodium butyrate reduces the frequency of abdominal pain in patients with irritable bowel syndrome. Colorectal Dis. 2013;15(2):204–209. doi:10.1111/j.1463-1318.2012.03152.x.
- Sonnenburg ED, Sonnenburg JL. Starving our microbial self: the deleterious consequences of a diet deficient in microbiota-accessible carbohydrates. Cell Metab. 2014;20(5):779–786. doi:10.1016/j.cmet.2014.07.003.
- Armstrong HK, Bording-Jorgensen M, Santer DM, Zhang Z, Valcheva R, Rieger AM, Sung-Ho Kim J, Dijk SI, Mahmood R, Ogungbola O, et al. Unfermented β-fructan fibers fuel inflammation in select inflammatory bowel disease patients. Gastroenterology. 2023;164(2):228–240. doi:10.1053/j.gastro.2022.09.034.
- Zhang Y, Yu X, Yu E, Wang N, Cai Q, Shuai Q, Yan F, Jiang L, Wang H, Liu J, et al. Changes in gut microbiota and plasma inflammatory factors across the stages of colorectal tumorigenesis: a case-control study. BMC Microbiol. 2018;18(1):1–10. doi:10.1186/s12866-018-1232-6.
- Zhang J, He Y, Xia L, Yi J, Wang Z, Zhao Y, Song X, Li J, Liu H, Liang X, et al. Expansion of colorectal cancer biomarkers based on gut bacteria and viruses. Cancers. 2022;14(19):4662. doi:10.3390/cancers14194662.
- Mayneris-Perxachs J, Castells-Nobau A, Arnoriaga-Rodríguez M, Martin M, de la Vega-Correa L, Zapata C, Burokas A, Blasco G, Coll C, Escrichs A, et al. Microbiota alterations in proline metabolism impact depression. Cell Metab. 2022;34(5):681–701. e10. doi:10.1016/j.cmet.2022.04.001.
- Noble EE, Olson CA, Davis E, Tsan L, Chen Y-W, Schade R, Liu C, Suarez A, Jones RB, de La Serre C, et al. Gut microbial taxa elevated by dietary sugar disrupt memory function. Transl Psychiatry. 2021;11(1):1–16. doi:10.1038/s41398-021-01309-7.
- Berry SE, Valdes AM, Drew DA, Asnicar F, Mazidi M, Wolf J, Capdevila J, Hadjigeorgiou G, Davies R, Al Khatib H, et al. Human postprandial responses to food and potential for precision nutrition. Nat Med. 2020;26(6):964–973. doi:10.1038/s41591-020-0934-0.
- Ford AC, Bercik P, Morgan DG, Bolino C, Pintos–Sanchez MI, Moayyedi P. Validation of the Rome III criteria for the diagnosis of irritable bowel syndrome in secondary care. Gastroenterology. 2013;145(6):1262–70. e1. doi:10.1053/j.gastro.2013.08.048.
- Asnicar F, Berry SE, Valdes AM, Nguyen LH, Piccinno G, Drew DA, Leeming E, Gibson R, Le Roy C, Khatib HA, et al. Microbiome connections with host metabolism and habitual diet from 1,098 deeply phenotyped individuals. Nat Med. 2021;27(2):321–332. doi:10.1038/s41591-020-01183-8.
- Quince C, Walker AW, Simpson JT, Loman NJ, Segata N. Shotgun metagenomics, from sampling to analysis. Nat Biotechnol. 2017;35(9):833–844. doi:10.1038/nbt.3935.
- Truong DT, Franzosa EA, Tickle TL, Scholz M, Weingart G, Pasolli E, Tett A, Huttenhower C, Segata N. MetaPhlAn2 for enhanced metagenomic taxonomic profiling. Nat Methods. 2015;12(10):902–903. doi:10.1038/nmeth.3589.
- Franzosa EA, McIver LJ, Rahnavard G, Thompson LR, Schirmer M, Weingart G, Lipson KS, Knight R, Caporaso JG, Segata N, et al. Species-level functional profiling of metagenomes and metatranscriptomes. Nat Methods. 2018;15(11):962–968. doi:10.1038/s41592-018-0176-y.
- Bingham SA, Welch AA, McTaggart A, Mulligan AA, Runswick SA, Luben R, Oakes S, Khaw KT, Wareham N, Day NE, et al. Nutritional methods in the European prospective investigation of cancer in Norfolk. Public Health Nutr. 2001;4(3):847–858. doi:10.1079/PHN2000102.
- Mulligan AA, Luben RN, Bhaniani A, Parry-Smith DJ, O’Connor L, Khawaja AP, Forouhi NG, Khaw K-T. A new tool for converting food frequency questionnaire data into nutrient and food group values: FETA research methods and availability. BMJ Open. 2014;4(3):e004503. doi:10.1136/bmjopen-2013-004503.
- Frankenfield DC, Muth ER, Rowe WA. The Harris-Benedict studies of human basal metabolism: history and limitations. J Am Diet Assoc. 1998;98(4):439–445. doi:10.1016/S0002-8223(98)00100-X.
- Oksanen J, Kindt R, Legendre P, O’Hara B, Stevens M, Oksanen M, Suggests MA. The vegan package: community ecology package. R Package Version, 2007;1:15–1.
- Mallick H, Rahnavard A, McIver LJ, Ma S, Zhang Y, Nguyen LH, Tickle TL, Weingart G, Ren B, Schwager EH, et al. Multivariable association discovery in population-scale meta-omics studies. PLoS Comput Biol. 2021;17(11):e1009442. doi:10.1371/journal.pcbi.1009442.
- Ghazi AR, Sucipto K, Rahnavard G, Franzosa EA, McIver LJ, Lloyd-Price J, Schwager E, Weingart G, Moon YS, Morgan XC, et al. High-sensitivity pattern discovery in large, paired multi-omic datasets. bioRxiv. 2021;38(Supplement_1):i378–85.
- Pedregosa F, Varoquaux G, Gramfort A, Michel V, Thirion B, Grisel O, Blondel M, Prettenhofer P, Weiss R, Dubourg V, et al. Scikit-learn: machine learning in Python. J Mach Learn Res. 2011;12:2825–2830.