
ABSTRACT
Polyunsaturated fatty acids (PUFAs) have been shown to exacerbate Crohn’s disease (CD) by promoting lipid peroxidation (LPO) of intestinal epithelial cells (IECs). Dysbiosis of the gut microbiota may play a crucial role in this process. CD patients often exhibit an increased abundance of Escherichia coli (E. coli) in the gut, and the colonization of adherent-invasive E. coli (AIEC) is implicated in the initiation of intestinal inflammation in CD. However, the impact of AIEC on LPO remains unclear. In this study, we observed that AIEC colonization in the terminal ileum of CD patients was associated with decreased levels of glutathione peroxidase 4 (GPX4) and ferritin heavy chain (FTH) in the intestinal epithelium, along with elevated levels of 4-Hydroxynonenal (4-HNE). In vitro experiments demonstrated that AIEC infection reduced the levels of GPX4 and FTH, increased LPO, and induced ferroptosis in IECs. Furthermore, arachidonic acid (AA) and docosahexaenoic acid (DHA) supplementation in AIEC-infected IECs significantly aggravated LPO and ferroptosis. However, overexpression of GPX4 rescued AIEC-induced LPO and ferroptosis in IECs. Our results further confirmed that AIEC with AA supplementation, associated with excessive LPO and cell death in IECs, worsened colitis in the DSS mouse model and induced enteritis in the antibiotic cocktail pre-treatment mouse model in vivo. Moreover, treatment with ferrostatin-1, a ferroptosis inhibitor, alleviated AIEC with AA supplementation-induced enteritis in mice, accompanied by reduced LPO and cell death in IECs. Our findings suggest that AIEC, in combination with PUFA supplementation, can induce and exacerbate intestinal inflammation, primarily through increased LPO and ferroptosis in IECs.
Introduction
Crohn’s disease (CD) is a chronic remittent inflammatory disease characterized by segmental and transmural gastrointestinal lesions, predominantly affecting the terminal ileumCitation1. The pathogenesis of CD is believed to involve genetic susceptibility, alterations in intestinal microbiota, and environmental factorsCitation2. Studies have suggested a link between a higher intake of ω-6 polyunsaturated fatty acids (PUFAs) and an increased risk of CDCitation3,Citation4. While ω-3 PUFAs are thought to possess anti-inflammatory properties and be beneficial for CDCitation5,Citation6, clinical studies have failed to confirm that ω-3 PUFA supplementation can induce or maintain remissionCitation7,Citation8 and may even worsen symptoms in some CD patientsCitation7. The impact of PUFAs on CD and the underlying mechanisms remain largely unclear.
PUFAs are crucial components of cell membranes, and their abundance depends on dietary intake. Due to the presence of two or more polyunsaturated double bonds, PUFAs are susceptible to lipid peroxidation (LPO) under the influence of Fenton chemistry and reactive oxygen species (ROS)Citation9. When LPO occurs in cell membrane PUFAs, it compromises the integrity of the cell membrane structure, leading to ferroptosis, an iron-dependent cell death pathway characterized by LPOCitation10. Glutathione peroxidase 4 (GPX4) plays a critical role in maintaining cellular lipid redox homeostasis and serves as a vital indicator and negative regulatory factor in LPO and ferroptosisCitation11. In the context of reduced GPX4 expression, PUFA intake could promote LPOCitation12 in the intestinal epithelium and aggravate intestinal inflammationCitation13,Citation14. CD patients often exhibit changes in key contributors to LPO, such as decreased GPX4 proteinCitation13,Citation14 and elevated ROS levelsCitation15,Citation16. Significant LPO in the intestinal epithelium of CD patients has been reportedCitation17,Citation18, suggesting that LPO and ferroptosis in the intestinal epithelium are critical pathological changes in CD. However, the specific regulatory mechanisms are still unclear. Previous studies have demonstrated that infection by specific bacteria can decrease GPX4 protein levels and induce ferroptosisCitation19,Citation20. Recent research suggests that gut microbiota dysbiosis may increase cells’ susceptibility to ferroptosis,including colonic epithelial cellsCitation21,Citation22. Moreover, the clearance of intestinal bacteria can alleviate PUFA-induced enteritis by reducing LPOCitation14. Therefore, gut microbes may play a crucial role in regulating LPO and ferroptosis.
In CD, gut microbiota dysbiosis is characterized by reduced microbial diversity and an increased abundance of specific mucosa-associated bacteria, particularly Escherichia coli (E. coli)Citation23. Mucosa-associated E. coli, particularly adherent invasive E. coli (AIEC), has received significant attentionCitation24. AIEC is a distinct type of E. coli that lacks pathogen-specific virulence genes but exhibits strong adhesive and invasive capabilities toward intestinal epithelial cells. It can survive and replicate within macrophagesCitation25. The prevalence of AIEC colonization is higher in CD patients than in healthy individualsCitation26,Citation27. Furthermore, in post-ileocecal resection patients with CD, AIEC colonization promotes endoscopic recurrence after surgery and contributes to the initiation of intestinal inflammationCitation28. Existing studies have shown that AIEC induces an elevation of ROS in intestinal epithelial cellsCitation29 and exhibits intracellular ROS resistance. Even nonpathogenic E. coli infection of intestinal epithelial cells can lead to significant ROS generation, promoting dextran sodium sulfate (DSS)-induced colitis, potentially associated with E. coli-induced LPOCitation29,Citation30. However, whether AIEC can induce intestinal epithelial LPO and ferroptosis remains unclear.
Here, we hypothesize that AIEC infection induces LPO and ferroptosis in intestinal epithelial cells. PUFA intake in the presence of AIEC infection would exacerbate LPO and ferroptosis in IECs and contribute to intestinal inflammation.
Results
1. AIEC colonization is associated with enhanced LPO in IECs of CD patients
The terminal ileum is the most commonly involved and frequently colonized site of AIEC in CDCitation25,Citation27. To investigate the association between AIEC colonization and LPO, we collected and assessed specimens of the terminal ileum from CD patients undergoing ileocolic resection (). The prevalence of AIEC in the cohort was 40% (8/20) (Table S1). Patients were divided into two groups based on AIEC colonization, and their clinical characteristics are summarized in Table S2.
Figure 1. AIEC colonization is associated with increased lipid peroxidation in the intestinal epithelia of CD patients. (A) schematic representation of terminal ileum specimen collection and analysis in CD patients’ surgery. (B) Western blot of GPX4 and FTH proteins in the terminal ileal mucosa of CD patients with AIEC-positive (AIEC (+), n = 8) or AIEC-negative colonization (AIEC (-), n = 12). (C) relative protein expression of GPX4. (D) relative protein expression of FTH. (E) immunohistochemical staining of GPX4, 4-HNE, and TUNEL in intestinal epithelial cells (IECs) from AIEC (+) and AIEC (-) patients. (F) immunohistochemical scoring of 4-HNE. (G) percentage of TUNEL-positive IECs. Scale bar, 25 μm. Bars represent medians. Data are expressed as mean ± SEM, **p <.001, ***p <.0001.
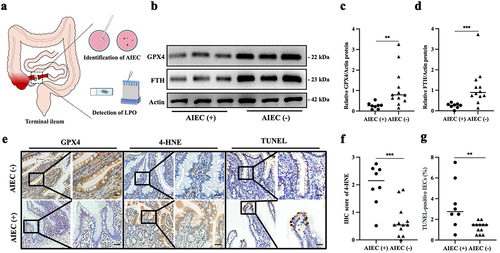
The mucosa of AIEC-positive patients showed significantly increased LPO, as indicated by 4-hydroxynonenal (4-HNE), accompanied by markedly decreased expression of GPX4 (). FTH, the primary form of intracellular iron storage, serves as an indicator of ferroptosis. We observed a decrease in intestinal mucosal FTH levels in CD patients colonized by AIEC (). Moreover, the differential expression of 4-HNE and GPX4 was mainly localized in IECs (). Additionally, AIEC-positive patients exhibited a significantly higher percentage of TUNEL-positive staining in intestinal epithelial cells compared to AIEC-negative CD patients (). These findings indicate that AIEC colonization is associated with enhanced LPO and ferroptosis in IECs in CD.
2. PUFAs aggravate AIEC-induced LPO in IECs
To investigate whether AIEC can induce LPO in IECs and understand the impact of PUFA (i.e., AA and DHA) on AIEC-induced LPO in IECs, we established an AIEC-infected Caco-2 model and treated it simultaneously with PUFA (). We used palmitoleate (POA), a monounsaturated fatty acid (MUFA), as a control. We observed a significant increase in PTGS-2 expression in IECs following AIEC infection (Figure S1a). Under the context of AIEC infection, we administered different concentrations of AA (0 μM, 10 μM, 20 μM, 40 μM, 80 μM and 100 μM). We found a concentration-dependent increase in PTGS-2 expression in the range of 0 μM to 40 μM of AA, with no further noticeable increase observed in the range of 80 to 100 μM (Figure S1a, b). Therefore, we selected a concentration of 20 μM of AA for subsequent experiments as the appropriate concentration. The western blot and ELISA results demonstrated a significant increase in 4-HNE levels in IECs infected with AIEC compared to the K12 (a nonpathogenic E. coli strain) and blank control. Moreover, under AIEC infection conditions, AA and DHA increased the expression of 4-HNE, while POA did not ().
Figure 2. PUFAs aggravate AIEC-induced LPO in IEC cells. (A) illustration of the in vitro AIEC infection model in IECs (Caco-2 cells). (B) Western blot analysis of 4-HNE levels in AIEC/K12-infected IECs treated with AA, DHA, POA, and DMSO. (C) quantification of 4-HNE from AIEC/K12-infected IECs stimulated with AA, DHA, POA, and DMSO for 18 h using ELISA. (D) LPO quantification by flow cytometry in BODIPY581/591 C11-labeled IECs infected with AIEC/K12 and stimulated with AA, DHA, POA, and DMSO. (E) percentage of BODIPY581/591 C11-positive IECs. (F) confocal imaging of BODIPY-C11 (510 nm, oxidized, green; 590 nm, reduced, red) in AIEC/K12-infected IECs treated with AA, DHA, POA, and DMSO. Scale bar: 20 μm. IECs, intestinal epithelial cells. Con: blank control; “-”: no treatment. *p <.05, **p <.01. Data are represented as mean ± SEM. All experiments were repeated at least three times.
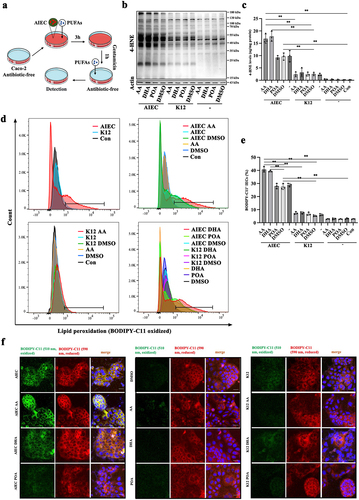
Next, we assessed LPO in IECs using BODIPY-C11 as a fluorescence probe. Infection with AIEC significantly induced LPO in IECs compared to the K12 and negative control (). Within IECs, both AA and DHA markedly increased the levels of AIEC-induced LPO, while cells treated with K12 showed no significant changes. Furthermore, under conditions without AIEC infection, neither AA nor DHA induced LPO. To exclude the interference from intracellular viable AIEC, we attempted to label independently cultured AIEC using BODIPY-C11 and found that AIEC could not be labeled by BODIPY-C11 (Figure S1c). To rule out the potential influence of AA on AIEC growth, we depicted the growth curve of AIEC in the presence and absence of AA. The results revealed that AA had no impact on the growth of AIEC (Figure S1d). These findings suggest that AIEC infection induces LPO in IECs, and PUFA can aggravate AIEC-induced LPO.
3. PUFAs enhance AIEC-induced ferroptosis in IECs
Ferroptosis occurs when PUFA-induced LPO is out of control. Thus, we investigated whether AIEC induces ferroptosis in IECs and further elucidated whether PUFA exacerbates AIEC-induced ferroptosis in IECs. Through microscopic observation and propidium iodide (PI) staining, we observed increased cell death in AIEC-infected IECs, while no significant cell death was observed in K12-treated IECs. Furthermore, both AA and DHA exacerbated AIEC-induced cell death. To determine the type of cell death, we found that the apoptosis inhibitor Z-VAD-FMK and the necroptosis inhibitor necrostatin-1 failed to reverse the death of AIEC-infected IECs. However, the ferroptosis inhibitor Ferrostatin-1 rescued cell death induced by AIEC and reduced cell death in IECs treated with AIEC plus AA or DHA ().
Figure 3. PUFAs enhance AIEC-induced ferroptosis. (A) Brightfield images showing specific cell death in AIEC/K12-infected IECs treated with AA, DHA, POA, DMSO, Z-VAD-FMK, necrostatin-1 (NEC-1), and ferrostatin-1 (ferr-1). Con: no bacteria. “-”: no treatment. Scale bar: 20 μm. (B) propidium iodide (PI) staining in AIEC/K12-infected IECs treated with AA, DHA, POA, DMSO, Z-VAD-FMK, NEC-1, and ferr-1. Con: no bacteria. “-”: no treatment. The PI stain appears red. Nuclei were stained with Hoechst 33,342 in blue. Scale bar: 20 μm. (C) percentage of cell death in AIEC/K12-infected IECs assessed by propidium iodide (PI) staining after treatment with AA, DHA, POA, DMSO, Z-VAD-FMK, NEC-1, and ferr-1. (D) cell viability of AIEC-infected Caco-2 cells treated with DMSO, AA, DHA, or POA during the 24 hours after infection was determined by the CCK8 assay. (E) the cell viability of AIEC- or K12-infected Caco-2 cells treated with DMSO, AA, DHA, or POA during the 24 hours after infection was determined by the CCK8 assay. (F) Transmission electron micrographs of IECs treated with DMSO, AIEC, or AIEC + AA. Black arrows indicate shrunken mitochondria and a reduction in mitochondrial cristae. Blue arrows indicate AIEC. Scale bar: 1 μm. (G) confocal imaging of FerroOrange showing intracellular Fe2+ levels in AIEC/K12-infected IECs treated with AA, DHA, POA, or DMSO. Con: no bacteria. “-”: no treatment. Scale bar: 20 μm. (H) relative fluorescence intensity of FerroOrange in AIEC- or K12-infected Caco-2 cells treated with AA, DHA, POA, or DMSO. (I) Western blot analysis of GPX4, FTH, and PTGS-2 protein levels in AIEC/K12-infected IECs treated with AA, DHA, POA, or DMSO. “-”: no treatment. (J) relative expression of TNF-α in AIEC/K12-infected IECs treated with AA, DHA, POA, or DMSO. Con: no treatment. “-”: no bacteria. (K) relative mRNA expression of CXCL1 in AIEC/K12-infected IECs treated with AA, DHA, POA, or DMSO. ns, not significant. *p <.05, **p <.01. Data are represented as the mean ± SEM. All experiments were repeated at least three times.
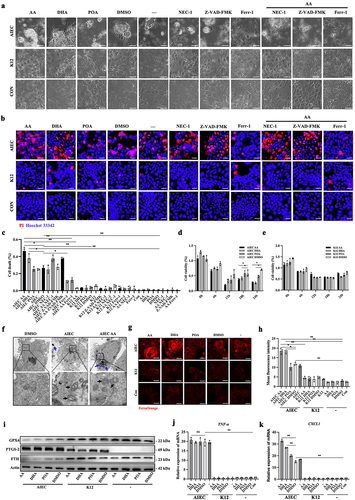
Additional assessment of cell viability revealed that AIEC decreased the cell viability of IECs. Moreover, AA and DHA further compromised the cell viability induced by AIEC (). Transmission electron microscopy was used to observe the structure of the cells, confirming that AIEC-infected IECs with or without AA exhibited shrunken mitochondria with increased membrane density and a reduction in mitochondrial cristae, which are typical manifestations of ferroptosis (). Since ferroptosis is characterized by iron-dependent accumulation, we used an Fe2+ probe known as FerroOrange to detect intracellular Fe2+ levels in IECs. AIEC infection resulted in an increased concentration of intracellular Fe2+, and the presence of AA and DHA further augmented the elevation of intracellular Fe2+ induced by AIEC in IECs ().
Western blot analysis was used to assess the expression of ferroptosis-associated protein markers, including PTGS-2, FTH, and GPX4. Consistent with the above results, AIEC infection decreased FTH and GPX4 levels and increased PTGS-2 in IECs. Furthermore, under AIEC-infected conditions, AA and DHA further reduced the levels of FTH and GPX4 (). The western blot results demonstrated that DMSO did not impact the levels of ferroptosis-related proteins in AIEC-infected IECs (Figure S1e). In addition, AIEC infection significantly increased the expression of pro-inflammatory genes TNF-α and CXCL1. Notably, AA, DHA, and POA did not further increase TNF-α expression, while AA and DHA enhanced the expression of the CXCL1 gene in AIEC-infected IECs (). These results indicate that AIEC induces ferroptosis in IECs, and PUFA exacerbates AIEC-induced ferroptosis.
4. Overexpression of GPX4 reduces AIEC-induced ferroptosis in IECs
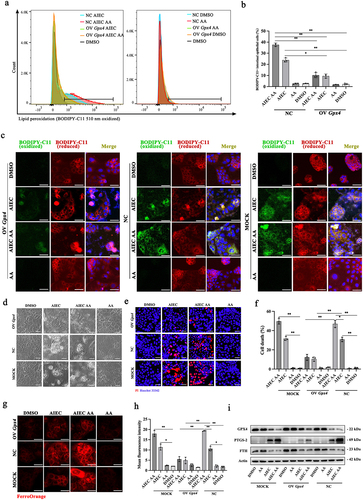
GPX4 is considered the cornerstone of the anti-peroxidant defense. Insufficient GPX4 can lead to ferroptosis caused by LPO. In this study, we found that GPX4 levels were reduced in AIEC-infected IECs. To investigate the role of GPX4 in AIEC-induced LPO and ferroptosis, we overexpressed GPX4 in Caco-2 cells through plasmid transfection. The overexpression of GPX4 in IECs significantly reduced AIEC-induced LPO and attenuated the exacerbated LPO caused by AA supplementation (). Furthermore, brightfield microscopy and PI staining showed that the overexpression of GPX4 attenuated AIEC-induced cell death and mitigated the deleterious effects caused by AA supplementation (). Additionally, the overexpression of GPX4 decreased the intracellular Fe2+ concentration caused by AIEC and AA (). Western blot and ELISA analysis demonstrated that the overexpression of GPX4 partially reversed the changes in ferroptosis-associated biomarkers induced by AIEC, with or without AA supplementation (, Figure S2a). These findings suggest that overexpression of GPX4 in IECs alleviates AIEC-induced LPO and ferroptosis and mitigates the effects of AA supplementation on AIEC-induced LPO and ferroptosis.
Figure 4. Overexpression of GPX4 rescues AIEC with AA-induced LPO and ferroptosis in IECs. (A) LPO quantification by flow cytometry in BODIPY581/591 C11-labeled IECs infected with AIEC and stimulated with AA. (B) LPO quantification by flow cytometry in BODIPY581/591 C11-labeled IECs infected with AIEC and stimulated with AA. (C) confocal imaging of BODIPY-C11 (510 nm, oxidized, green; 590 nm, reduced, red) in AIEC-infected IECs treated with AA. Scale bar: 20 μm. (D) Brightfield images showing specific cell death in AIEC-infected IECs treated with AA. Scale bar: 20 μm. (E) propidium iodide (PI) staining in AIEC-infected IECs treated with AA. The PI stain appears red. Nuclei were stained with Hoechst 33,342 in blue. Scale bar: 20 μm. (F) percentage of cell death in AIEC-infected IECs treated with AA. (G) confocal imaging of FerroOrange showing intracellular Fe2+ levels in AIEC-infected IECs treated with AA for 24 hours. FerroOrange positive appears red. Scale bar: 20 μm. (H) relative fluorescence intensity of FerroOrange. (I) Western blot analysis of GPX4, FTH, and PTGS-2 protein levels. OV Gpx4: overexpression of GPX4. NC: negative control transfected with plasmid vector. MOCK: control using lipofectamine 3000 transfection reagent. *p <.05, **p <.01. Data are represented as mean ± SEM. All experiments were repeated at least three times.
5. AIEC with AA supplementation exacerbates enteritis in DSS mice
To investigate the impact of AIEC with AA supplementation on intestinal inflammation in vivo, we used DSS mice, a well-established mouse model for studying colitis resembling Crohn’s disease. The mice were challenged with AA, AIEC, or AIEC+AA (). The presence of AIEC in the mucosa was confirmed, indicating successful colonization of the ilea and colons by AIEC (). Mice treated with AIEC+AA exhibited the most severe illness, as evidenced by significant weight loss and higher disease activity index (DAI) scores compared to the other groups (). Specifically, DSS mice challenged with AIEC+AA displayed the most severe colitis, characterized by bloody stool, shortened colon length, and pronounced pathological changes (). Interestingly, the ilea of mice exposed to AIEC+AA also showed more prominent inflammation, as indicated by increased inflammatory cell infiltration ().
Figure 5. AIEC with AA supplementation exacerbates enteritis in DSS mice. (A) illustration depicting AIEC infection in the DSS-induced model. (B) bacterial loads of AIEC detected in the cecum, ileum, and colon. (C) percentage of daily weight change in mice. (D) DAI scores of mice from Day 1 to Day 7. DAI, disease activity index (E) images showing blood accumulation in the ceca of AIEC- and AIEC+AA-treated mice. (F) colon lengths. (G) comparison of colon length among different groups. (H) hematoxylin and eosin (H&E) staining of the colon. Scale bar: 100 μm. (I) histological scores of the colon. (J) H&E staining of the small intestine in different groups of mice. Confocal microscopy analysis of AIEC localization: EpCAM (green), AIEC (GipA, red), and DAPI (blue). Scale bar: 25 μm. (K) histological scores of the small intestine. The black arrows indicate inflammatory cell infiltration, while the yellow arrows indicate AIEC. WT: wild-type mice. *p <.05, **p <.01. n = 5. Data are represented as the mean ± SEM.
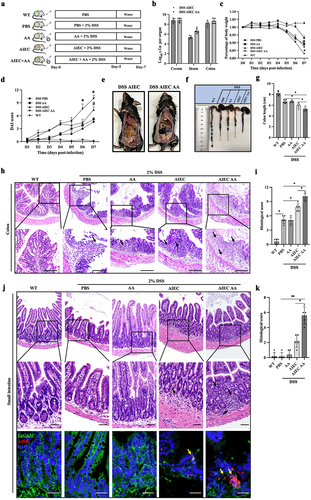
To demonstrate the association between ileal inflammation and the presence of AIEC with AA, fluorescence in situ hybridization (FISH) was performed to label AIEC. The results revealed the translocation of AIEC into the mucosal layer of the ileum, particularly in the AIEC+AA group ().
These findings suggest that the combination of AIEC and AA exacerbates colitis and may induce inflammation in the small intestine of DSS mice.
6. AIEC with AA supplementation induces enteritis in AVNM and WT mice
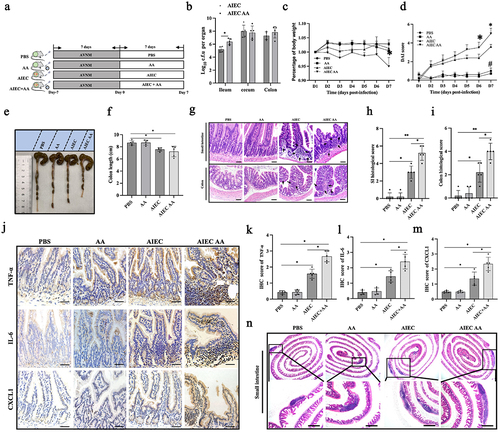
To investigate the direct impact of gut bacteria with PUFA supplementation on inflammation of the small intestine, AVNM mice were used. AVNM mice lack the chemical interference present in the DSS colitis model, allowing for a focus on the combined effects of AIEC and PUFA on intestinal inflammation. The mice were treated with PBS, AA, AIEC, or AIEC+AA (). Detection of AIEC in the mucosa showed that AA did not affect the colonization levels of AIEC in the cecum and colon, but it appeared to increase colonization levels in the small intestine (). Changes in body weight were similar among the groups except for mice exposed to AIEC+AA, which exhibited more pronounced weight loss. The AIEC and AIEC+AA groups showed higher disease activity index (DAI) scores and shorter colon length than the AA-treated and PBS control groups (). Hematoxylin and eosin (H&E) staining of the small intestine and colon revealed significant pathological changes in the AIEC+AA group, mild changes in the AIEC group, and no apparent changes in the AA and PBS groups (). The small intestines of AIEC+AA mice exhibited unusually high numbers of protruding follicular structures and increased inflammatory cell infiltration (). Immunofluorescence results confirmed more significant infiltration of neutrophils and macrophages in the small intestines of AIEC+AA mice (Figure S3a). Additionally, significant increases in pro-inflammatory cytokines such as IL-6, TNF-α, and CXCL1 were observed in the small intestines of AIEC+AA mice. AIEC alone had mild effects, while AA had no impact on the infiltration of neutrophils and macrophages or the expression of pro-inflammatory cytokines in the small intestines of AVNM mice (, Figure S3a). Enlarged Peyer’s patches (PPs) were also observed in the small intestines of both AIEC and AIEC+AA mice (). Furthermore, WT mice were challenged with AIEC+AA to determine if it could induce enteritis. The mice were orally challenged with or without AIEC every 3 days and fed with or without AA for 28 days. The results showed that only AIEC+AA was able to induce enteritis, characterized by weight loss and mild intestinal pathological changes in mice (Figure S4a-g). These results indicate that combining AIEC and AA supplementation can induce intestinal inflammation in AVNM and WT mice.
Figure 6. AIEC with AA supplementation induces enteritis in AVNM mice. (A) illustration depicting AIEC infection in AVNM mice. (B) bacterial loads of AIEC in the ileum, cecum, and colon. (C) weight loss in different groups. (D) DAI scores measured from Day 1 to Day 7. (E) colon lengths in different groups. (F) comparison of colon length among different groups. (G) H&E staining of small intestinal and colon sections. The black arrows indicate inflammatory cell infiltration. Scale bar: 50 μm. (H) histologic scores of the small intestine. (I) histologic scores of the colon. (J) Detection of pro-inflammatory factors (TNF-α, IL-6, and CXCL-1) by immunohistochemistry (IHC) in intestinal sections. Scale bar: 50 μm. (K) IHC score of TNF-α. (l) IHC score of IL-6. (M) IHC score of CXCL-1. (N) H&E staining of small intestine Peyer’s patches. Scale bar: 500 μm. n = 5. *p <.05. **p <.01. Data are represented as the mean ± SEM.
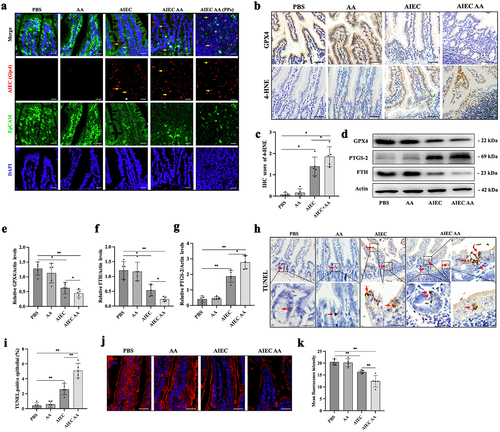
Next, the effects of AIEC and AA supplementation on intestinal epithelial ferroptosis were investigated. The colonization of AIEC in the small intestine was confirmed using an oligonucleotide probe specific to E. coli (LF82, gipA)Citation31,Citation32. In AIEC+AA mice, more E. coli adhered to the epithelium and translocated into Peyer’s patches (). Compared to the PBS group, the AIEC+AA group exhibited reduced levels of GPX4 and FTH while showing increased levels of 4-HNE and PTGS-2 (). TUNEL staining, which detects DNA double-strand breaksCitation33,Citation34, showed a significant increase in TUNEL-positive cells in the intestinal epithelium of AIEC+AA mice (). Transmission electron microscopy revealed signs of intestinal epithelial cell death, characterized by increased mitochondrial electron density, in AIEC+AA mice (Figure S3b). The expression of zonula occludens-1 (ZO-1), a tight junction protein essential for epithelial barrier integrity, was decreased in the AIEC+AA group (). These results suggest that AIEC with AA supplementation can induce enteritis with increased lipid peroxidation, cell death in intestinal epithelial cells, and disruption of epithelial barrier integrity.
Figure 7. AIEC with AA supplementation-induced enteritis is associated with LPO and cell death. (A) confocal microscopy analysis of AIEC localization: EpCAM (green), AIEC (GipA, red), and DAPI (blue). Yellow arrows indicate AIEC. Scale bar: 25 μm. (B) levels of GPX4 and 4-HNE detected by immunohistochemistry in IECs of different groups. Scale bar: 50 μm. (C) IHC score of 4-HNE. (D) levels of GPX4, PTGS2, and FTH measured by western blotting in the intestine of AVNM mice in different groups. (E) the relative level of GPX4. (F) the relative level of FTH. (G) the relative level of PTGS-2. (H) TUNEL staining in IECs of mice. The red arrows indicate TUNEL-positive cells. IECs: intestinal epithelial cells. Scale bar: 25 μm. (I) TUNEL-positive percentage of IECs. (J) immunofluorescence staining of zonula occludens-1 (ZO-1). Scale bar: 25 μm. (K) mean fluorescence intensity of ZO-1. n = 5. *p <.05, **p <.01. Data are represented as the mean ± SEM.
7. Ferrostatin-1 alleviates enteritis induced by AIEC with AA supplementation
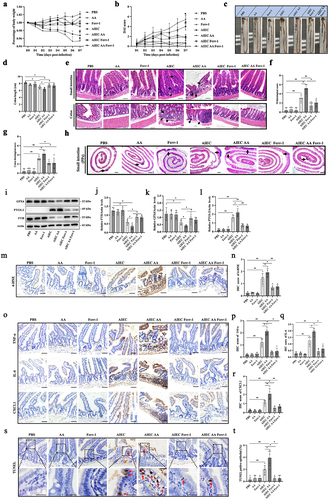
To investigate the role of ferroptosis in enteritis induced by AIEC with AA supplementation, the ferroptosis inhibitor Ferrostatin-1 was administered to the AVNM mouse model of AIEC-associated enteritis. The results showed that Ferrostatin-1 improved body weight changes, DAI scores, colon length, and histopathological scores of the intestine in the AVNM mouse model of AIEC-associated enteritis (). Furthermore, Ferrostatin-1 mitigated the enlargement of Peyer’s patches (PPs) in the small intestine induced by AIEC infection (). The impact of Ferrostatin-1 on enterocyte markers of ferroptosis induced by the presence of both AIEC and AA was examined. The results indicated that Ferrostatin-1 restored the dysregulated expression of ferroptosis-associated proteins. It increased GPX4 and FTH levels while decreasing PTGS-2 levels in AIEC-associated enteritis in AVNM mice (). Additionally, Ferrostatin-1 reduced the levels of 4-HNE, a marker of lipid peroxidation (). Significant decreases in pro-inflammatory cytokines such as IL-6, TNF-α, and CXCL1 were observed in the small intestines of AIEC+AA+Ferrostatin-1 mice (). Furthermore, the effect of Ferrostatin-1 on cell death in the intestinal epithelium was confirmed. Ferrostatin-1 decreased the percentage of TUNEL-positive cells in the presence of both AIEC and AA, indicating a reduction in cell death (). These results suggest that enteritis induced by AIEC with AA supplementation is at least partially due to ferroptosis of intestinal epithelial cells.
Figure 8. Ferrostatin-1 alleviates enteritis induced by AIEC with AA supplementation. (A) weight loss in different groups. #, p < .05.*, p < .05. (B) DAI scores measured from Day 1 to Day 7. #, p < .05.*, p < .05. (C) presentation of small intestine and colon. (D) comparison of colon length among different groups. (E) H&E staining of small intestinal and colon sections. The black arrows indicate inflammatory cell infiltration. Scale bar: 50 μm. (F) histologic scores of the small intestine. (G) histologic scores of the colon. (H) H&E staining of small intestine Peyer’s patches (PPs). The black arrows indicate PPs. Scale bar: 500 μm. (I) GPX4, PTGS-2, and FTH levels measured by western blotting in different groups. (J) relative level of GPX4. (K) relative level of FTH. (L) relative level of PTGS-2. (M) Detection of 4-HNE by immunohistochemistry. (N) IHC score of 4-HNE. (O) Detection of pro-inflammatory factors (TNF-α, IL-6, and CXCL-1) by immunohistochemistry (IHC) in intestinal sections. Scale bar: 50 μm. (P) IHC score of TNF-α. (Q) IHC score of IL-6. (R) IHC score of CXCL-1. (S) TUNEL staining of IECs from mice. The red arrows indicate TUNEL-stained positive cells. Scale bar: 25 μm. (T) TUNEL-positive percentage of IECs. IHC: immunohistochemistry. IECs: intestinal epithelial cells. Ferr-1: ferrostatin-1. n = 5. *p <.05, **p <.01. Data are represented as the mean ± SEM.
Discussion
Mounting evidence suggests that the clinical efficacy of PUFAs in CD remains uncertain and may potentially worsen LPOCitation13,Citation14. CD patients often exhibit gut microbiota dysbiosis, mainly increased E. coliCitation23. However, the impact of gut microbiota on the metabolic effects of PUFAs remains unclear. This study aimed to investigate the synergistic effects and potential mechanisms of PUFA and AIEC on intestinal inflammation. In this study, we observed significant LPO in the IECs of CD patients with AIEC infection. This was characterized by decreased levels of GPX4, accumulation of the LPO metabolite 4-HNE, and reduced expression of the iron-storing protein FTH. These findings suggest that AIEC colonization may exacerbate LPO and ferroptosis in the IECs of CD patients. Furthermore, our in vitro experiments demonstrated that AIEC infection induced LPO and ferroptosis. The AA and DHA supplementation further aggravated LPO and ferroptosis in IECs. We also found that overexpression of GPX4 partially rescued AIEC-induced LPO and attenuated the detrimental effects of AA supplementation during AIEC infection. Moreover, our in vivo experiments revealed that AIEC combined with AA supplementation induced and exacerbated intestinal inflammation, accompanied by elevated LPO in the intestinal epithelium. Finally, we demonstrated that the inhibition of ferroptosis alleviated intestinal inflammation induced by AIEC with AA supplementation. This was achieved by reducing intestinal LPO and cell death in IECs.
The role and specific mechanism of PUFAs in CD remain unclear, which hinders their application in CD treatment. The ω-3 PUFAs have been shown to possess anti-inflammatory effects, and ω-3 PUFA supplementation is recommended for various diseasesCitation35–38. However, while the protective role of ω-3 PUFAs against intestinal inflammation has been demonstrated in various mouse models, its efficacy in CD patients has not been substantiated. Previous studies have reported the presence of aberrant LPO in CDCitation14,Citation39,Citation40, but the factors regulating LPO in IECs remain poorly understood. Recent research has suggested that PUFAs induce LPO, contributing to the development of CDCitation13,Citation14. Furthermore, studies have shown that dysbiosis of the gut microbiota increases the susceptibility of IECs to ferroptosis in miceCitation21. Antibiotic therapy has also been found to improve PUFA-induced enteritis by reducing the LPO of PUFAsCitation14. In this study, we observed more severe LPO in the IECs of CD patients with AIEC colonization. This finding suggests that AIEC may play a role in regulating the LPO of IECs.
Historically, strong evidence has been reported regarding the association between AIEC and CDCitation41–44. A recent study using a postoperative recurrence model suggested the involvement of AIEC in the early stages of ileal CDCitation28. However, the underlying mechanism remains largely unclear. Previous studies have demonstrated that commensal E. coli and AIEC can induce the generation of reactive oxygen species (ROS) in intestinal epithelial cells (IECs)Citation29,Citation30. Recent bioinformatics studies have also reported abnormal expression of genes associated with ferroptosis in CD patients, indicating the potential involvement of ferroptosis in CD pathology. However, the precise role and regulatory mechanisms of ferroptosis in CD remain elusiveCitation45,Citation46. To date, no study has investigated the influence of AIEC on the LPO of PUFAs in CD. In our study, we demonstrated AIEC-induced LPO and ferroptosis in IECs. Furthermore, in AIEC infection, supplementation with AA or DHA exacerbated LPO and ferroptosis in vitro. These findings suggest that when homeostasis is dysregulated due to AIEC infection, intake of PUFAs, whether ω-6 or ω-3, can promote intestinal epithelial LPO and ferroptosis, thereby exacerbating intestinal inflammation.
Moreover, we confirmed this hypothesis in several mouse models of enteritis. In AVNM mice, the small intestines and colon of AIEC+AA mice exhibited features of intestinal inflammation similar to CD. Even in WT mice, AIEC with AA supplementation induced mild intestinal inflammation. These results indicate that only CD patients without specific pathogen infection may benefit from ω-3 PUFA supplementation.
The regulation of GPX4, which plays a crucial role in LPO regulation, remains unclear. GPX4 is responsible for scavenging lipid hydroperoxides, thereby reducing LPO and inhibiting ferroptosisCitation11. Certain bacteria have been shown to decrease GPX4 protein levels, leading to elevated LPO levelsCitation19,Citation20,Citation47. In line with these findings, our data demonstrated that AIEC-infected IECs exhibited higher LPO levels and a decrease in GPX4 compared to K12-infected IECs. Furthermore, we found that overexpression of GPX4 could mitigate the adverse effects of PUFAs in the context of AIEC infection. These observations suggest that AIEC may induce LPO and ferroptosis by inhibiting GPX4.
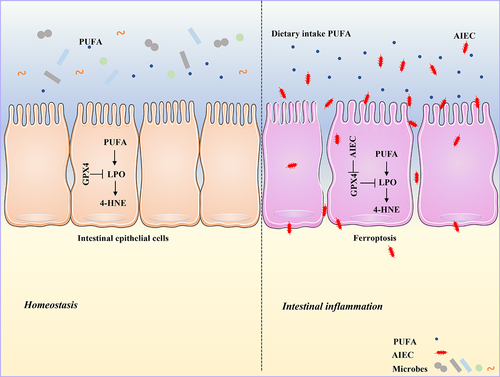
In summary, our study highlights that AIEC can induce LPO and subsequent ferroptosis in IECs, potentially through the reduction of GPX4. PUFA supplementation in the presence of AIEC infection further exacerbates LPO and ferroptosis, ultimately leading to the induction of intestinal inflammation (). These findings provide new insights into the interaction between bacteria and PUFAs and their impact on intestinal inflammation in CD.
Figure 9. Graphical abstract. AIEC induces LPO by inhibiting GPX4. AIEC infection inhibits GPX4, whereas PUFA supplementation enhances LPO and ferroptosis.
Materials and methods
Patients
This study received approval from the Ethics Committee of Jinling Hospital. We included CD patients who underwent their first ileocolectomy at Jinling Hospital between March 2021 and August 2022. The diagnosis of CD was based on endoscopic, histopathological, clinical, laboratory, and radiological findings. Patients who received antibiotics within 2 months of surgery were excluded from the study. We obtained written informed consent from each patient. Sterilized forceps were used to sample the mucosa of the resected terminal ileum. The collected ileal mucosa samples were placed in formalin for subsequent histological studies. Bacterial isolation was performed using MEM (Cytiva HyClone, China) supplemented with 15% glycerol. Additionally, samples were immediately frozen in liquid nitrogen and stored at −80°C in dry tubes for further analysis.
AIEC isolation
Each specimen was washed with phosphate-buffered saline (PBS). Intracellular bacteria were isolated from ileal mucosa samples by a gentamicin protection assay. The intestinal tissues were suspended in MEM supplemented with 100 μg/ml gentamicin (Sigma, USA) for one hour, washed three times, homogenized by a grinder, and then lysed in 1% Triton X-100 in PBS for 15 minutes. Then, 10-fold dilutions of the lysate were plated on MacConkey agar (Solarbio, China) plates, which were incubated at 37°C for 18 hours. Lactose-fermenting colonies were enumerated and grown in Luria Bertani (LB) broth at 37°C for 3 hours under aerobic conditions. For further identification, individual clones were stored in 25% glycerol at −80°C.
Cell lines and cell culture
The cell lines used in this study were Caco-2 and RAW 264.7 cells. The Caco-2 cell line was derived from a human colonic adenocarcinoma and exhibited structural and functional characteristics like mature small intestinal enterocytesCitation48–50. Caco-2 cells were cultured in MEM (Cytiva HyClone, China) supplemented with 20% fetal bovine serum (FBS, PAN-Seratech, Germany), 1% sodium pyruvate, 1% nonessential amino acids (NEAA, Sigma, USA), 1% L-glutamine, and 100 U/ml penicillin-streptomycin mixture (Gibco). The cells were maintained at 37°C in a 5% CO2 atmosphere. RAW 264.7 cells, murine macrophages, were cultured in DMEM supplemented with 10% FBS (PAN-Seratech, Germany) and 100 U/ml penicillin-streptomycin mixture (Gibco).
Phenotypical assays to identify AIEC bacteria
All E. coli strains were cultured in LB broth without shaking or on MacConkey agar plates overnight at 37°C. Bacterial behavioral characteristics were evaluated following previously described methods. Caco-2 epithelial cells were infected with bacteria at a multiplicity of infection (MOI = 10) and incubated at 37°C for 3 hours. The infected monolayers were washed thrice with PBS, lysed with 1% Triton X-100, and inoculated onto MacConkey agar plates. The plates were incubated overnight at 37°C, and the resulting colonies were counted. The infected cells were added to gentamicin (100 mg/ml, Sigma) to eliminate extracellular bacteria. After one hour of incubation, the cells were processed as described above.
Similarly, Caco-2 epithelial cells were infected with bacteria (MOI = 10), incubated at 37°C for 3 hours, treated with gentamicin for one hour, washed three times with PBS, lysed with Triton X-100, and plated on MacConkey agar plates. The plates were incubated overnight at 37°C, and the colonies were counted. For RAW 264.7 macrophages, the cells were infected with bacteria for 3 hours, followed by one hour of gentamicin treatment (100 mg/mL, Sigma). The cells were then incubated at 37°C for 24 hours, washed three times with PBS, lysed with Triton X-100, and inoculated onto MacConkey agar plates. After overnight incubation at 37°C, the colonies were counted. In all phenotypic assays, K-12 (a non-AIEC E. coli strain) was used as the negative control and LF82 as the positive control.
Bacterial strains and culture
The reference strain of AIEC, LF82, and the nonpathogenic strain E. coli K-12 were cultured overnight in LB broth without shaking. The bacterial cultures in the exponential growth phase were washed twice with PBS, resuspended in fresh PBS, and quantified by measuring their optical density values (1.0 OD600 = 10^9 CFU/ml).
Cell infection studies
LF82 or K12 E. coli strains were cultured in LB broth at 37°C without shaking for 15 hours before infecting the cells. The intestinal epithelial cells (IECs) were challenged with LF82 or K12 bacteria at a multiplicity of infection (MOI = 50) of bacteria per IEC without the presence of antibiotics. The infection was carried out at 37°C in a 5% CO2 environment for 3 hours. For experiments involving PUFAs or drugs, the respective substances were added to the infected IECs without antibiotics and incubated at 37°C in a 5% CO2 environment for 3 hours. The concentrations used for PUFAs, or drugs were as follows: AA (20 μM, MCE), DHA (20 μM, MCE), POA (20 μM, MCE), Z-VAD-FMK (10 μg/ml, MCE), necrostatin-1 (10 μg/ml, MCE), and Ferrostatin-1 (1 μM, MCE). Following incubation, the bacteria were removed, and the IECs were washed twice with PBS. Gentamicin (100 μg/mL, Sigma) was added to the infected IECs to eliminate extracellular bacteria, and the cells were further incubated for an additional hour.
Mouse infection procedure
The Institutional Ethics Committee of Jinling Hospital approved the animal protocols conducted in this study. Female C57BL/6J WT mice were obtained from Gempharmatech at six weeks and housed in a specific pathogen-free barrier unit.
DSS mice: To induce DSS colitis, WT mice were provided with drinking water containing 2% (wt/vol) DSS (MW = 36,000–50,000, MP Bio-medicals) ad libitum for 5 days, followed by regular drinking water for the next 2 days. During this period, the mice received oral gavage of AIEC (2 × 10Citation9 CFU), AA (10 mg, MCE), or both. The disease activity index (DAI) was calculated based on body weight change, stool consistency, and gut bleedingCitation51.
AVNM mice: The AVNM mice were treated daily with an antibiotic cocktail solution consisting of ampicillin (A; 5 mg per mouse, Psaitong, China), vancomycin (V; 5 mg per mouse, Psaitong, China), neomycin (N; 5 mg per mouse, Psaitong, China), and metronidazole (M; 4 mg per mouse, Psaitong, China) via oral gavage for 7 daysCitation52,Citation53. Subsequently, the AVNM mice were challenged with AIEC (2 × 10Citation9 CFU) suspended in 100 μL of PBS every 3 days via oral gavage for 7 days, with or without supplementation of arachidonic acid (AA; 10 mg, Psaitong, China).
Ferrostatin-1 treatment: In mice treated with ferrostatin-1, a 2.5 µmol/kg body weight dose was injected intraperitoneally for 7 daysCitation54. The AVNM mice were sacrificed on Day 7 after infection for tissue collection.
WT mice: WT mice were gavaged with AIEC (2 × 10Citation9 CFU) suspended in 100 μL of PBS every 3 days and fed with or without arachidonic acid (AA; 10 mg, MCE). These mice were sacrificed 28 days after infection for subsequent analysis.
Mouse mucosal and fecal AIEC quantification
Fresh fecal pellets weighing 100 to 200 mg or mucosal tissues collected during mouse sacrifice were obtained from each mouse and suspended in sterile PBS at one, two, and three days after bacterial infection. Serial dilutions of the samples were then prepared, and enumeration of bacteria was performed by plating the PBS-resuspended feces on MacConkey agar plates supplemented with ampicillin (50 μg/mL, Sigma). This antibiotic was used because the AIEC strain LF82 is known to be resistant to it, and no resistant bacteria were detected in noninfected mice. The MacConkey agar plates were incubated at 37°C overnight, and the colony-forming units (CFUs) were calculated to measure bacterial count.
Growth curve analyses
E. coli strains LF82 and K12 were cultured in Luria-Bertani (LB) medium at 37°C and 200 rpm until reaching an optical density at 600 nm (OD600) of 1. The cultures were then harvested by centrifugation, and the cell pellets were resuspended in MEM (Cytiva HyClone, China). The bacterial cultures were further diluted 1:100 in fresh MEM supplemented with AA (20 μM, MCE).
To assess the growth of the bacteria, the diluted cultures were distributed into a 96-well plate in triplicate, with 100 μl of the culture added to each well. The plate was then incubated at 37°C, and the OD600 was measured at intervals of 0.5 hours using a Biotek instrument.
Transmission electron microscopy
Confluent Caco-2 cells were left uninfected or infected with AIEC containing AA (20 µM, MCE) and incubated at 37°C in a 5% CO2 atmosphere for 3 hours. The extracellular bacteria were carefully removed after the incubation period, and the cells were further incubated for an additional 18 hours.
To prepare the samples for examination, the cells were first fixed in glutaraldehyde (4%) and then postfixed in osmium tetroxide (1%). Subsequently, the samples were dehydrated using a graded series of acetone solutions. The dehydrated samples were then infiltrated and embedded in Epon-Araldite epoxy resin.
Ultrathin sections were obtained from the resin blocks and treated with contrasting agents, including uranyl acetate and lead citrate. These contrasted sections were subsequently subjected to examination using a transmission electron microscope.
mRNA assessment by real-time quantitative PCR
Total RNA was isolated from cells using TRIzol (Invitrogen) following the manufacturer’s instructions. Subsequently, cDNA was synthesized using the qScript cDNA Supermix.
For gene expression analysis, quantitative polymerase chain reaction (qPCR) was conducted on a Light Cycler 96 Real-Time PCR Detection System (Roche, Berlin, Germany). SYBR mix was used along with specific oligonucleotides, and each sample was run in triplicate. The fold changes in gene expression were normalized by the equation 2−ΔΔCt using the housekeeping gene β-actin. The following primers were used: for forward primer TNF-α, TNF-α-F 5’-GAGGCCAAGCCCTGGTATG’ and reverse primer TNF-α-R 5’-CGGGCCGATTGATCTCAGC −3’; for CXCL1, forward primer CXCL1-F 5’-CCAGTGCTTGCAGACCCT −3’ and reverse primer CXCL1-R 5’-TTCCGCCCATTCTTGAGT −3’; and for actin, forward primer actin-F 5’-CTACCTCATGAAGATCCTCACCGA −3’ and reverse primer actin-R 5’-TTCTCCTTAATGTCACGCACGATT −3’.
Western blot
Tissues and cells were lysed using RIPA buffer (50 mM Tris-HCl, pH 8, 2 mM EDTA, 300 mM NaCl, 2% NP-40, 1% sodium deoxycholate) supplemented with a protease and phosphatase inhibitor cocktail (Sigma). The lysates were then subjected to 12% SDS-polyacrylamide gel electrophoresis (SDS-PAGE) at 80 V for 0.5 hours, followed by 120 V for another 1.5 hours. The separated proteins were transferred onto a PVDF membrane (Bio-Rad).
The membranes were incubated with nonfat milk in Tris-buffered saline containing 0.1% Tween-20 (TBST) to block nonspecific binding for one hour. The membranes were then incubated overnight at 4°C with primary antibodies against the following proteins: GPX4 (Proteintech 67,763–1-Ig), FTH (Santa Cruz Biotechnology, sc -376,594), 4-HNE (Bioss, bs-6313 R), and PTGS-2 (Abclonal, A1253).
Following primary antibody incubation, the membranes were washed and incubated with the appropriate HRP-conjugated secondary antibodies at room temperature. The target protein bands were visualized using ECL Western Blotting Reagents (Thermo Fisher Scientific) and quantified using ImageJ software.
H&E staining
Samples were fixed in 4% paraformaldehyde, embedded in paraffin, and then cut into 5-μm thick slices. The tissue sections were stained with hematoxylin and eosin using the standard protocol. Subsequently, the histological sections were examined under a light microscope. The grading of the sections was performed in a double-blind manner, following the previously described methodCitation51.
Immunohistological staining and localization of bacteria by FISH
For immunohistochemical staining, the tissue sections were first dewaxed and dehydrated. Antigen retrieval was performed by incubating the sections. Next, the slides were washed three times with PBS and blocked for one hour at room temperature using a PBS solution containing 5% BSA. The tissue sections were then incubated with specific primary antibodies, including anti-4-HNE (Bioss, bs-6313 R), anti-F4/80 (Proteintech, Cat. No. 28463–1-AP), anti-GPX4 (Proteintech, Cat. No. 67763–1-Ig), anti-TNF-α (Proteintech, Cat. No. 17590–1-AP), anti-IL-6 (Elabscience, Cat. No. E-AB-40021), anti-CXCL1 (Proteintech, Cat. No. 12335–1-AP), anti-Gr-1 (Proteintech, Cat. No. 65140–1-Ig), ZO-1 (Proteintech), and anti-EPCAM (Proteintech, Cat. No. 21050–1-AP). The sections were incubated in a dilution buffer containing appropriate secondary antibodies. For immunohistochemical staining, hematoxylin and diaminobenzidine chromogenic solution were added for 10 minutes. As previously describedCitation55, fluorescent in situ hybridization (FISH) was performed on the intestinal mucosa to evaluate bacterial localization at the mucosal surface. The LF82 gipA probe (5’- GTAGACGAAGCACACAGC-3’)Citation31 was diluted to 10 μg/mL in hybridization buffer (20 mM Tris – HCl, pH 7.4, 0.9 M NaCl, 0.1% SDS, 20% formamide) and incubated overnight at 50°C. Finally, all tissue sections were viewed under a fluorescence (Olympus) or confocal (Zeiss LSM 880) microscope.
TUNEL staining
The paraffin-embedded intestinal tissue was sectioned into slices with a thickness of 5 μm. Subsequently, the dewaxed paraffin sections were performed and washed with distilled water. TUNEL staining (Beyotime, China) followed the manufacturer’s instructions. The sections were observed under a microscope (Olympus).
Elisa
According to the manufacturer’s protocol, 4-HNE were determined using a human ELISA kit (ELK Biotechnology, China).
GPX4 overexpression
The GPX4 gene-expressing vector was obtained from GenePharma Co., Ltd. Caco-2 cells were transiently transfected with the GPX4-expressing vector and negative control plasmids (pEX-1) using Lipofectamine 3000 (Invitrogen 11,668,030). The overexpression of GPX4 was confirmed by western blotting.
Cell viability assay
Cell viability was assessed with the Cell Counting Kit-8 (CCK8; Beyotime, China) assay according to the manufacturer’s instructions. Briefly, cells were seeded in 96-well plates (1 × 10Citation4 cells/well). After treatment, CCK8 solution (10 μl) was added to each well and incubated for 2 h at 37°C. The absorbance at 450 nm was measured using a microplate photometer (Biotek).
Lipid peroxidation
To assess LPO, as previously describedCitation56, IECs were incubated with BODIPY 581/591-C11 (2 μM, D3861, Invitrogen™) for 30 min at 37°C and 5% CO2, following the manufacturer’s instructions. The fluorescence signals of reduced and oxidized C11 were measured using confocal microscopy (Zeiss LSM 880) and analyzed at excitation/emission wavelengths of 581/591 nm (BODIPY-C11, reduced) and 488/510 nm (BODIPY-C11, oxidized), respectively. Flow cytometry analysis was also performed using a BD LSRFortessa instrument.
PI staining
IECs were seeded and infected in 6-well plates (5 × 10Citation5 cells/well) to monitor cell death. As previously mentioned, the cells were supplemented with PI (5 μg/ml, Beyotime, China) for 1 h after treatment. Cell death was assessed by observing PI staining using confocal microscopy (Zeiss LSM 880).
Detection of cellular Fe2+ ions
FerroOrange (Dojindo, Japan) was used to assess intracellular Fe2+ ion levels. The cells were seeded in 96-well plates and treated as indicated. After treatment, cells were incubated with FerroOrange solution (1 μM) dispersed in serum-free MEM (Cytiva HyClone, China) at 37°C for 30 minutes. The fluorescence was then detected using a confocal microscope (Zeiss LSM 880).
Statistical analysis
Statistical analysis was performed using GraphPad Prism 9.0 software (GraphPad Software, USA). Quantitative variables were presented as mean ± SEM, while qualitative variables were expressed as percentages. Between-group comparisons were analyzed using the non-parametric t-test, and one or two-way ANOVA tests were used based on the experimental design. A significance level of P < 0.05 was considered statistically significant.
Author contributions
Weiming Zhu, Zhen Guo, and Weiwei Wen conceived and designed the study. Weiwei Wen, Yihan Xu, Wenwei Qian, and Liangyu Huang performed the experiments, analyzed the data, and contributed to the manuscript writing. Zhen Guo, Yi Li, and Jianfeng Gong provided a critical review and editing of the manuscript. Yihan Xu, Wenwei Qian, and Liangyu Huang collected the specimens. All authors have reviewed and approved the final version of the manuscript.
Supplemental Material
Download Zip (71.2 MB)Acknowledgments
We thank Prof. Wu Kaichun from the Air Force Medical University in Xi’an, China, for providing the E. coli LF82 strain. We also acknowledge the University of Auvergne in Clermont-Ferrand, France, for granting us permission to use the E. coli LF82 strain. Special thanks go to Prof. Gao Xiang’s and Lin Zhaoyu’s laboratory members at the Model Animal Research Center, Nanjing University, for their valuable technical assistance. The graphical elements in the figures were derived from Servier Medical Art (http://smart.servier.com/), licensed under a Creative Commons Attribution 3.0 Generic License (https://creativecommons.org/licenses/by/3.0/). We acknowledge CureEdit for providing English language editing services.
Disclosure statement
No potential conflict of interest was reported by the author(s).
Data availability statement
All the data required to evaluate the conclusions presented in this paper are included within the paper and supplementary material. For further inquiries, please contact the corresponding author.
Supplementary material
Supplemental data for this article can be accessed online at https://doi.org/10.1080/19490976.2023.2265578
Additional information
Funding
References
- Torres J, Mehandru S, Colombel JF, Peyrin-Biroulet L. Crohn’s disease. Lancet. 2017;389:1741–22. doi:10.1016/s0140-6736(16)31711-1.
- Adolph TE, Meyer M, Schwärzler J, Mayr L, Grabherr F, Tilg H. The metabolic nature of inflammatory bowel diseases. Nat Rev Gastroenterol Hepatol. 2022;19(12):753–767. doi:10.1038/s41575-022-00658-y.
- Shoda R, Matsueda K, Yamato S, Umeda N. Epidemiologic analysis of Crohn disease in japan: increased dietary intake of n-6 polyunsaturated fatty acids and animal protein relates to the increased incidence of Crohn disease in japan. Am J Clin Nutr. 1996;63(5):741–745. doi:10.1093/ajcn/63.5.741.
- Hou JK, Abraham B, El-Serag H. Dietary intake and risk of developing inflammatory bowel disease: a systematic review of the literature. Am J Gastroenterol. 2011;106:563–573. doi:10.1038/ajg.2011.44.
- Chan SS, Luben R, Olsen A, Tjonneland A, Kaaks R, Lindgren S, Grip O, Bergmann MM, Boeing H, Hallmans G, et al. Association between high dietary intake of the n −3 polyunsaturated fatty acid docosahexaenoic acid and reduced risk of crohn’s disease. Aliment Pharmacol Ther. 2014;39(8):834–842. doi:10.1111/apt.12670.
- Mozaffari H, Daneshzad E, Larijani B, Bellissimo N, Azadbakht L. Dietary intake of fish, n-3 polyunsaturated fatty acids, and risk of inflammatory bowel disease: a systematic review and meta-analysis of observational studies. Eur J Nutr. 2020;59(1):1–17. doi:10.1007/s00394-019-01901-0.
- Lev-Tzion R, Griffiths AM, Leder O, Turner D. Omega 3 fatty acids (fish oil) for maintenance of remission in crohn’s disease. Cochrane Database Syst Rev. 2014;2014(6):Cd006320. doi:10.1002/14651858.CD006320.pub4.
- Ajabnoor SM, Thorpe G, Abdelhamid A, Hooper L. Long-term effects of increasing omega-3, omega-6 and total polyunsaturated fats on inflammatory bowel disease and markers of inflammation: a systematic review and meta-analysis of randomized controlled trials. Eur J Nutr. 2021;60(5):2293–2316. doi:10.1007/s00394-020-02413-y.
- Conrad M, Pratt DA. The chemical basis of ferroptosis. Nat Chem Biol. 2019;15(12):1137–1147. doi:10.1038/s41589-019-0408-1.
- Dixon SJ, Lemberg KM, Lamprecht MR, Skouta R, Zaitsev EM, Gleason CE, Patel DN, Bauer AJ, Cantley AM, Yang WS, et al. Ferroptosis: an iron-dependent form of nonapoptotic cell death. Cell. 2012;149(5):1060–1072. doi:10.1016/j.cell.2012.03.042.
- Tang D, Chen X, Kang R, Kroemer G. Ferroptosis: molecular mechanisms and health implications. Cell Res. 2021;31(2):107–125. doi:10.1038/s41422-020-00441-1.
- Yang WS, Kim KJ, Gaschler MM, Patel M, Shchepinov MS, Stockwell BR. Peroxidation of polyunsaturated fatty acids by lipoxygenases drives ferroptosis. Proc Natl Acad Sci U S A. 2016;113:E4966–75. doi:10.1073/pnas.1603244113.
- Mayr L, Grabherr F, Schwarzler J, Reitmeier I, Sommer F, Gehmacher T, Niederreiter L, He GW, Ruder B, Kunz KTR, et al. Dietary lipids fuel gpx4-restricted enteritis resembling crohn’s disease. Nat Commun. 2020;11:1775. doi:10.1038/s41467-020-15646-6.
- Schwärzler J, Mayr L, Vich Vila A, Grabherr F, Niederreiter L, Philipp M, Grander C, Meyer M, Jukic A, Tröger S, et al. PUFA-induced metabolic enteritis as a fuel for crohn’s disease. Gastroenterology. 2022;162(6):1690–1704. doi:10.1053/j.gastro.2022.01.004.
- Aghdassi E, Wendland BE, Steinhart AH, Wolman SL, Jeejeebhoy K, Allard JP. Antioxidant vitamin supplementation in crohn’s disease decreases oxidative stress. A randomized controlled trial. Am J Gastroenterol. 2003;98(2):348–353. doi:10.1111/j.1572-0241.2003.07226.x.
- Kruidenier L, Kuiper I, Lamers CB, Verspaget HW. Intestinal oxidative damage in inflammatory bowel disease: semi-quantification, localization, and association with mucosal antioxidants. J Pathol. 2003;201:28–36. doi:10.1002/path.1409.
- Wendland BE, Aghdassi E, Tam C, Carrrier J, Steinhart AH, Wolman SL, Baron D, Allard JP. Lipid peroxidation and plasma antioxidant micronutrients in Crohn disease. Am J Clin Nutr. 2001;74:259–264. doi:10.1093/ajcn/74.2.259.
- Boehm D, Krzystek-Korpacka M, Neubauer K, Matusiewicz M, Paradowski L, Gamian A. Lipid peroxidation markers in crohn’s disease: the associations and diagnostic value. Clin Chem Lab Med. 2012;50:1359–1366. doi:10.1515/cclm-2011-0817.
- Dar HH, Anthonymuthu TS, Ponomareva LA, Souryavong AB, Shurin GV, Kapralov AO, Tyurin VA, Lee JS, Mallampalli RK, Wenzel SE, et al. A new thiol-independent mechanism of epithelial host defense against pseudomonas aeruginosa: Inos/no(•) sabotage of theft-ferroptosis. Redox Biol. 2021;45:102045. doi:10.1016/j.redox.2021.102045.
- Amaral EP, Foreman TW, Namasivayam S, Hilligan KL, Kauffman KD, Barbosa Bomfim CC, Costa DL, Barreto-Duarte B, Gurgel-Rocha C, Santana MF, et al. Gpx4 regulates cellular necrosis and host resistance in mycobacterium tuberculosis infection. J Exp Med. 2022;219. doi:10.1084/jem.20220504.
- Liu Y, Jiao C, Zhang T, Li X, Li P, Lu M, Ye Z, Du Y, Du R, Zhang W, et al. Early-life gut microbiota governs susceptibility to colitis via microbial-derived ether lipids. Research (Washington DC). 2023;6:0037. doi:10.34133/research.0037.
- Yang M, Lu Z, Li F, Shi F, Zhan F, Zhao L, Li Y, Li J, Lin L, Qin Z. Escherichia coli induced ferroptosis in red blood cells of grass carp (Ctenopharyngodon idella). Fish Shellfish Immunol. 2021;112:159–167. doi:10.1016/j.fsi.2020.09.036.
- Willing B, Halfvarson J, Dicksved J, Rosenquist M, Järnerot G, Engstrand L, Tysk C, Jansson JK. Twin studies reveal specific imbalances in the mucosa-associated microbiota of patients with ileal crohnʼs disease. Inflamm Bowel Dis. 2009;15(5):653–660. doi:10.1002/ibd.20783.
- de Souza HL, de Carvalho VR, Romeiro FG, Sassaki LY, Keller R, Rodrigues J. Mucosa-associated but not luminal Escherichia coli is augmented in crohn’s disease and ulcerative colitis. Gut Pathog. 2012;4(1):21. doi:10.1186/1757-4749-4-21.
- Darfeuille-Michaud A, Boudeau J, Bulois P, Neut C, Glasser AL, Barnich N, Bringer MA, Swidsinski A, Beaugerie L, Colombel JF. High prevalence of adherent-invasive Escherichia coli associated with ileal mucosa in crohn’s disease. Gastroenterology. 2004;127(2):412–421. doi:10.1053/j.gastro.2004.04.061.
- Zhilu X, Xiangqian D, Keli Y, Caroline C, Jingwan Z, Yu L, Tao Z, Cheung CL, Yang S, Fengrui Z, et al. Association of adherent-invasive Escherichia coli with severe gut mucosal dysbiosis in hong kong Chinese population with crohn’s disease. Gut Microbes. 2021;13(1):1994833. doi:10.1080/19490976.2021.1994833.
- Nadalian B, Yadegar A, Houri H, Olfatifar M, Shahrokh S, Asadzadeh Aghdaei H, Suzuki H, Zali MR. Prevalence of the pathobiont adherent-invasive Escherichia coli and inflammatory bowel disease: a systematic review and meta-analysis. J of Gastro and Hepatol. 2021;36(4):852–863. doi:10.1111/jgh.15260.
- Buisson A, Sokol H, Hammoudi N, Nancey S, Treton X, Nachury M, Fumery M, Hébuterne X, Rodrigues M, Hugot JP, et al. Role of adherent and invasive Escherichia coli in crohn’s disease: lessons from the postoperative recurrence model. Gut. 2022;72(1):39–48. doi:10.1136/gutjnl-2021-325971.
- Elatrech I, Marzaioli V, Boukemara H, Bournier O, Neut C, Darfeuille-Michaud A, Luis J, Dubuquoy L, El-Benna J, My-Chan Dang P, et al. Escherichia coli lf82 differentially regulates ros production and mucin expression in intestinal epithelial t84 cells: implication of nox1. Inflamm Bowel Dis. 2015;21(5):1018–1026. doi:10.1097/mib.0000000000000365.
- Wang A, Keita ÅV, Phan V, McKay CM, Schoultz I, Lee J, Murphy MP, Fernando M, Ronaghan N, Balce D, et al. Targeting mitochondria-derived reactive oxygen species to reduce epithelial barrier dysfunction and colitis. The Amer J Pathol. 2014;184(9):2516–2527. doi:10.1016/j.ajpath.2014.05.019.
- Vazeille E, Chassaing B, Buisson A, Dubois A, de Vallée A, Billard E, Neut C, Bommelaer G, Colombel JF, Barnich N, et al. GipA factor supports colonization of Peyerʼs patches by crohnʼs disease-associated Escherichia coli. Inflamm Bowel Dis. 2016;22(1):68–81. doi:10.1097/mib.0000000000000609.
- Sharp RC, Naser ES, Alcedo KP, Qasem A, Abdelli LS, Naser SA. Development of multiplex pcr and multi-color fluorescent in situ hybridization (m-fish) coupled protocol for detection and imaging of multi-pathogens involved in inflammatory bowel disease. Gut Pathog. 2018;10(1):51. doi:10.1186/s13099-018-0278-1.
- Wang J, Wang Y, Liu Y, Cai X, Huang X, Fu W, Wang L, Qiu L, Li J, Sun L. Ferroptosis, a new target for treatment of renal injury and fibrosis in a 5/6 nephrectomy-induced ckd rat model. Cell Death Discov. 2022;8(1):127. doi:10.1038/s41420-022-00931-8.
- Linkermann A, Chen G, Dong G, Kunzendorf U, Krautwald S, Dong Z. Regulated cell death in aki. J Am Soc Nephrol. 2014;25:2689–2701. doi:10.1681/asn.2014030262.
- Guu TW, Mischoulon D, Sarris J, Hibbeln J, McNamara RK, Hamazaki K, Freeman MP, Maes M, Matsuoka YJ, Belmaker RH, et al. International society for nutritional psychiatry research practice guidelines for omega-3 fatty acids in the treatment of major depressive disorder. Psychother Psychosom. 2019;88(5):263–273. doi:10.1159/000502652.
- Freeman AM, Morris PB, Aspry K, Gordon NF, Barnard ND, Esselstyn CB, Ros E, Devries S, O’Keefe J, Miller M, et al. A clinician’s guide for trending cardiovascular nutrition controversies: part ii. J Am Coll Cardiol. 2018;72:553–568. doi:10.1016/j.jacc.2018.05.030.
- Nguyen Y, Salliot C, Mariette X, Boutron-Ruault MC, Seror R. Fish consumption and risk of rheumatoid arthritis: findings from the e3n cohort study. Nutrients. 2022;14(4):861. doi:10.3390/nu14040861.
- Yum HW, Na HK, Surh YJ. Anti-inflammatory effects of docosahexaenoic acid: implications for its cancer chemopreventive potential. Semin Cancer Biol. 2016;40-41:141–159. doi:10.1016/j.semcancer.2016.08.004.
- Szczeklik K, Krzyściak W, Cibor D, Domagała-Rodacka R, Pytko-Polończyk J, Mach T, Owczarek D. Markers of lipid peroxidation and antioxidant status in the serum and saliva of patients with active Crohn disease. Pol Arch Intern Med. 2018;128:362–370. doi:10.20452/pamw.4273.
- Dudzińska E, Gryzinska M, Ognik K, Gil-Kulik P, Kocki J. Oxidative stress and effect of treatment on the oxidation product decomposition processes in ibd. Oxid Med Cell Longev. 2018;2018:1–7. doi:10.1155/2018/7918261.
- Darfeuille-Michaud A, Neut C, Barnich N, Lederman E, Di Martino P, Desreumaux P, Gambiez L, Joly B, Cortot A, Colombel JF. Presence of adherent Escherichia coli strains in ileal mucosa of patients with crohn’s disease. Gastroenterol. 1998;115:1405–1413. doi:10.1016/s0016-5085(98)70019-8.
- Chassaing B, Rolhion N, de Vallée A, Salim SY, Prorok-Hamon M, Neut C, Campbell BJ, Söderholm JD, Hugot JP, Colombel JF, et al. Crohn disease–associated adherent-invasive e. Coli bacteria target mouse and human peyer’s patches via long polar fimbriae. J Clin Invest. 2011;121:966–975. doi:10.1172/jci44632.
- Martinez-Medina M, Denizot J, Dreux N, Robin F, Billard E, Bonnet R, Darfeuille-Michaud A, Barnich N. Western diet induces dysbiosis with increased e coli in ceabac10 mice, alters host barrier function favouring aiec colonisation. Gut. 2014;63(1):116–124. doi:10.1136/gutjnl-2012-304119.
- Small CL, Reid-Yu SA, McPhee JB, Coombes BK. Persistent infection with crohn’s disease-associated adherent-invasive Escherichia coli leads to chronic inflammation and intestinal fibrosis. Nat Commun. 2013;4:1957. doi:10.1038/ncomms2957.
- Zhang D, Li Y, Du C, Sang L, Liu L, Li Y, Wang F, Fan W, Tang P, Zhang S, et al. Evidence of pyroptosis and ferroptosis extensively involved in autoimmune diseases at the single-cell transcriptome level. J Transl Med. 2022;20(1):363. doi:10.1186/s12967-022-03566-6.
- Ji X, Ma S, Sun X, Yu D, Song Y, Li R. Analysis of ferroptosis-associated genes in crohn’s disease based on bioinformatics. Front Med. 2022;9:1058076. doi:10.3389/fmed.2022.1058076.
- Amaral EP, Costa DL, Namasivayam S, Riteau N, Kamenyeva O, Mittereder L, Mayer-Barber KD, Andrade BB, Sher A. A major role for ferroptosis in mycobacterium tuberculosis –induced cell death and tissue necrosis. J Exp Med. 2019;216(3):556–570. doi:10.1084/jem.20181776.
- Ha Y, Wang X, Liljestrand HM, Maynard JA, Katz LE. Bioavailability of fullerene under environmentally relevant conditions: effects of humic acid and fetal bovine serum on accumulation in lipid bilayers and cellular uptake. Environ Sci Technol. 2016;50:6717–6727. doi:10.1021/acs.est.5b04964.
- Kitayama Y, Fukui H, Hara K, Eda H, Kodani M, Yang M, Sun C, Yamagishi H, Tomita T, Oshima T, et al. Role of regenerating gene i in claudin expression and barrier function in the small intestine. Transl Res. 2016;173:92–100. doi:10.1016/j.trsl.2016.03.007.
- Buzza MS, Netzel-Arnett S, Shea-Donohue T, Zhao A, Lin CY, List K, Szabo R, Fasano A, Bugge TH, Antalis TM. Membrane-anchored serine protease matriptase regulates epithelial barrier formation and permeability in the intestine. Proc Natl Acad Sci U S A. 2010;107:4200–4205. doi:10.1073/pnas.0903923107.
- Carvalho FA, Barnich N, Sivignon A, Darcha C, Chan CH, Stanners CP, Darfeuille-Michaud A. Crohn’s disease adherent-invasive Escherichia coli colonize and induce strong gut inflammation in transgenic mice expressing human CEACAM. J Experiment Med. 2009;206(10):2179–2189. doi:10.1084/jem.20090741.
- Ayres JS, Trinidad NJ, Vance RE. Lethal inflammasome activation by a multidrug-resistant pathobiont upon antibiotic disruption of the microbiota. Nat Med. 2012;18(5):799–806. doi:10.1038/nm.2729.
- Chen L, Ishigami T, Nakashima-Sasaki R, Kino T, Doi H, Minegishi S, Umemura S. Commensal microbe-specific activation of B2 cell subsets contributes to atherosclerosis development independently of lipid metabolism. EBioMedicine. 2016;13:237–247. doi:10.1016/j.ebiom.2016.10.030.
- Wang H, An P, Xie E, Wu Q, Fang X, Gao H, Zhang Z, Li Y, Wang X, Zhang J, et al. Characterization of ferroptosis in murine models of hemochromatosis. Hepatol. 2017;66(2):449–465. doi:10.1002/hep.29117.
- Johansson ME, Hansson GC. Preservation of mucus in histological sections, immunostaining of mucins in fixed tissue, and localization of bacteria with fish. Methods Mol Biol. 2012;842:229–235. doi:10.1007/978-1-61779-513-8_13.
- Drummen GP, van Liebergen LC, Op Oden Kamp JA, Post JA. C11-bodipy(581/591), an oxidation-sensitive fluorescent lipid peroxidation probe: (micro)spectroscopic characterization and validation of methodology. Free Radic Biol Med. 2002;33(4):473–490. doi:10.1016/s0891-5849(02)00848-1.