
ABSTRACT
Our previous work revealed that unbalanced dietary intake was an important independent factor associated with constipation and gastrointestinal (GI) symptoms in children with autism spectrum disorder (ASD). Growing evidence has shown the alterations in the gut microbiota and gut microbiota-derived metabolites in ASD. However, how the altered microbiota might affect the associations between unbalanced diets and GI symptoms in ASD remains unknown. We analyzed microbiome and metabolomics data in 90 ASD and 90 typically developing (TD) children based on 16S rRNA and untargeted metabolomics, together with dietary intake and GI symptoms assessment. We found that there existed 11 altered gut microbiota (FDR-corrected P-value <0.05) and 397 altered metabolites (P-value <0.05) in children with ASD compared with TD children. Among the 11 altered microbiota, the Turicibacter, Coprococcus 1, and Lachnospiraceae FCS020 group were positively correlated with constipation (FDR-corrected P-value <0.25). The Eggerthellaceae was positively correlated with total GI symptoms (FDR-corrected P-value <0.25). More importantly, three increased microbiota including Turicibacter, Coprococcus 1, and Eggerthellaceae positively modulated the associations of unbalanced dietary intake with constipation and total GI symptoms, and the decreased Clostridium sp. BR31 negatively modulated their associations in ASD children (P-value <0.05). Together, the altered microbiota strengthens the relationship between unbalanced dietary intake and GI symptoms. Among the altered metabolites, ten metabolites derived from microbiota (Turicibacter, Coprococcus 1, Eggerthellaceae, and Clostridium sp. BR31) were screened out, enriched in eight metabolic pathways, and were identified to correlate with constipation and total GI symptoms in ASD children (FDR-corrected P-value <0.25). These metabolomics findings further support the modulating role of gut microbiota on the associations of unbalanced dietary intake with GI symptoms. Collectively, our research provides insights into the relationship between diet, the gut microbiota, and GI symptoms in children with ASD.
Introduction
Gastrointestinal (GI) symptoms, one of the prevalent co-occurring conditions in autism spectrum disorder (ASD),Citation1 including constipation, diarrhea, flatulence, and abdominal pain, may contribute to the pathogenesis or greater ASD symptom severityCitation2 and correlate with the various aberrant behaviors (stereotypy, social withdrawal, irritability, self-injury, and hyperactivity),Citation3 immune dysregulation, and metabolic dysfunction.Citation4 However, the link between autism and GI symptoms is unclear and unconvincing, as not all autistic children have GI complications.Citation5 GI symptoms were first associated with ASD through the presentation of feeding problems in affected children.Citation6 Children with ASD are up to five times more likely than typically developing (TD) children to have feeding problems.Citation7 Although a study has raised that dietary intake was not associated with GI symptoms in children with ASD.Citation8 Our latest findings indicated that unbalanced dietary intake was an important independent factor associated with GI symptoms in children with ASD. It has been reviewed that diet plays a role in the development of many human GI diseases,Citation9 which is consistent with our findings, supporting an association of an unbalanced diet with GI symptoms.
The microbiome-gut-brain axis has been implicated as a potential way to affect the symptoms and behaviors of ASD.Citation10 These prompted researchers to examine the gut microbial composition of ASD children. Lines of studies have demonstrated that autistic children exhibited dysbiosis or altered microbial abundance.Citation11–13 However, the type of altered gut microbiota and metabolites found in different studies varies widely.Citation14,Citation15 The causes of this variability between studies include, but are not limited to the substantial variability in baseline microbiome compositions across individuals, geographical regions,Citation16 complexity and heterogeneity of ASD,Citation17 differences in sample sizes, methodology, and covariates controlled.Citation18,Citation19 These variations contribute to the controversial conclusions regarding the association between the microbiome-gut-brain axis and ASD symptoms and behaviors. Consequently, further research with larger sample sizes, carefully controlling for covariates is required to thoroughly elucidate the gut microbiome and metabolomics features in ASD.
Diet can rapidly and reproducibly change the composition and homeostasis of microbiota.Citation9,Citation20 Berding et al. documented that an eating pattern characterized by a higher intake of healthy foods such as fruit, vegetables, legumes, nuts, and seeds was associated with a bacterial profile that could potentially be linked to some aspects of GI health.Citation21 Children with ASD are mostly picky eaters and consume less healthy diets,Citation22 often lacking in certain key nutrients,Citation8 which unavoidably influences the composition and/or richness of the gut microbiota, leading to dysbiosis. A large autism stool metagenomics study concluded that a less-diverse diet that relates to autism diagnostic features reduced microbial taxonomic diversity and looser stool consistency.Citation23 Valenzuela et al. reported that an unbalanced diet (low numbers of fruits and vegetables or foods rich in fiber) seems to have an essential role in the appearance of GI symptoms for ASD,Citation24 paving the way for the proposed link between ASD-related diet, microbiome profile, and GI problems. It has been suggested that the diet-induced host phenotypes are mediated by changes in gut microbiota.Citation25 Koeth et al. noted that intestinal microbiota potentially modulates the link between high levels of red meat consumption and increased atherosclerosis risk.Citation26 This leads to the hypothesis that altered gut microbiota can modulate the relationship between ASD-associated unbalanced diet and GI symptoms.
Gut microbiota dysbiosis can promote GI problems through multiple mechanisms.Citation27,Citation28 Gut microbiota can produce a variety of metabolites, such as bile acids, short-chain fatty acids (SCFAs), tryptophan metabolites, and methane, which have essential effects on intestinal motility and secretion.Citation29 Thus, we speculated that the altered metabolites produced by the altered microbiota might be the critical drivers of GI symptoms for children with ASD. As Snelson and his colleague noticed, the intestinal microbiota ferments indigestible carbohydrates in the diet to produce SCFAs,Citation30 which regulate immune function, colonic homeostasis, and health.Citation31 Similar phenomena have been observed that the intestinal microbiota may promote the development of atherosclerosis [a chronic inflammatory disorder of the large and medium-sized arterial wall and is a major underlying cause of cardiovascular disease (CVD)]Citation32, through the generation of pro-atherosclerotic metabolites.Citation33
Therefore, there are two main aims of this study. Firstly, we compared the microbiome and metabolomics data between the children with ASD and TD children. Secondly, we explored whether the altered gut microbiota modulates the associations of unbalanced dietary intake with GI symptoms in children with ASD via the multi-omics data analyses.
Result
Demographic characteristics
A total of 90 children with ASD [median age 6.1 years, interquartile range (IQR) 4.7–7.0; sex, male: female 74:16] and 90 TD children (median age 6.4 years, IQR 3.1–7.4; sex, male: female 73:17) were enrolled into this study. There were statistically significant differences between children with ASD and TD children in the demographic characteristics, including intellectual functioning, birth mode, average daily sleep duration, maternal educational attainment, and monthly per-capita income (P-value <0.05, effect size > 0.1), see .
Table 1. Demographic characteristics of the children with ASD and age-matched TD children.
Altered gut microbiota in children with ASD based on the 16S ribosomal RNA (16S rRNA) data
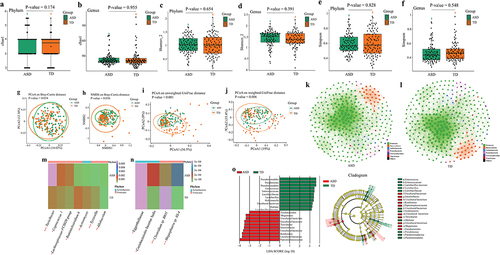
For the rarefaction curve of the microbial richness, the X axis illustrates the Rarefaction Percentage (%), and the Y axis demonstrates the number of sequences per sample (Supplementary Figure S1). When the curves approached saturation, a reasonable sequencing depth was acquired for the investigation of the stool microbiota. For alpha diversity, there were no significant differences in Chao1, Shannon, and Simpson indexes at phylum (Wilcoxon rank-sum test, FDR corrected P-value = 0.174, FDR corrected P-value = 0.654, FDR corrected P-value = 0.828) and genus (Wilcoxon rank-sum test, FDR corrected P-value = 0.955, FDR corrected P-value = 0.391, FDR corrected P-value = 0.548) levels between children with ASD and TD children (). For microbiota beta diversity, there existed significant differences in the principal coordinates analysis (PCoA) [permutation multivariate analysis of variance (PERMANOVA) tests, P-value = 0.034] and non-metric multidimensional scaling (NMDS) (PERMANOVA tests, P-value = 0.036) based on Bray-Curtis distance (). Also, there existed significant differences in the PCoA analysis based on the unweighted Unifrac distance (PERMANOVA tests, P-value <0.001) and weighted Unifrac distance (PERMANOVA tests, P-value = 0.006) (). To document co-occurrence and interaction patterns in microbial communities, the constructed network analysis exhibited that the number of significantly (−0.4 > r > 0.4, FDR corrected P-value <0.001) correlated gut microbiota was strikingly higher in the TD group than that in the ASD group (). Next, the relative abundance of gut microbiota at family, genus, and species levels was compared between children with ASD and TD children. The results using both Wilcoxon rank-sum and Analysis of Compositions of Microbiomes with Bias Correction (ANCOM-BC) tests showed that the significantly increased taxa were the Turicibacter, Coprococcus 1, Lachnospiraceae FCS020 group, Allobaculum, Eggerthellaceae, Coriobacteriales Incertae Sedis, and Megasphaera sp. BS-4 (FDR corrected P-value <0.05 and 0.25, respectively) ( Supplementary Table S2). The significantly decreased taxa were the Ruminiclostridium 6, Actinomycetales, Tyzzerella, and Clostridium sp. BR31 (FDR corrected P-value <0.05 and 0.25, respectively) ( Supplementary Table S2). The increased or decreased taxa aforesaid belong to the Firmicutes and Actinobacteria. Moreover, the linear discriminant analysis (LDA) effect size (LEfSe) displayed that the ASD children were characterized by higher levels of Firmicutes and Fusobacteria and the TD children were characterized by higher levels of Actinobacteria and Proteobacteria (). The random forest analysis also identified that the Firmicutes and Actinobacteria were the main differentially abundant taxa between children with ASD and TD children (Supplementary Figure S2).
Figure 1. Experimental strategy for the study.
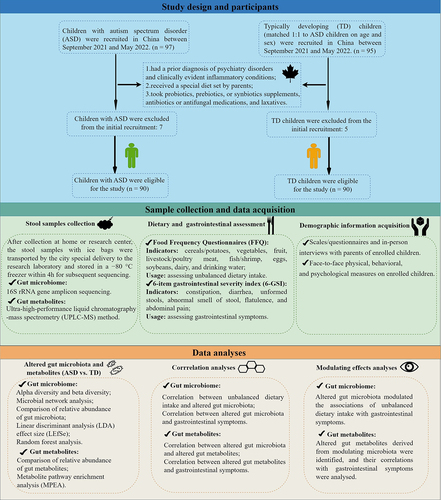
Figure 2. Altered gut microbiota in children with ASD based on the 16S rRNA data (n = 180). (a, b) The Chao1 index between children with ASD and TD children at phylum (a) and genus (b) levels. (c, d) The Shannon index between children with ASD and TD children at phylum (c) and genus (d) levels. (e, f) The Simpson index between children with ASD and TD children at phylum (e) and genus (f) levels. Statistically significant FDR correction P-value <0.05. (g, h) Principal coordinates analysis (PCoA) (g) and non-metric multidimensional scaling (NMDS) (h) of the microbiota based on Bray-Curtis distance. (i, j) PCoA analysis based on the unweighted Unifrac distance (i) and weighted Unifrac distance (j). Statistically significant P-value <0.05. (k, l) Correlation network analysis of gut microbiota in children with ASD (k) and TD children (l). The network analysis was conducted based on the Spearman correlation algorithms. Each node presents one operational taxonomic unit (OTU), and the node size indicates the relative abundance of each OTU. The straight line represents a significant correlation (−0.4 > r > 0.4, FDR-corrected P-value <0.001) between two nodes. (m, n) The significantly differential relative abundance of microbiota between children with ASD and TD children were tested using a Wilcoxon rank-sum test at genus level (m), at family and species levels (n). * FDR-corrected P-value <0.05, ** FDR-corrected P-value <0.01, *** FDR-corrected P-value <0.001. (o) Linear discriminant analysis (LDA) effect size (LEfSe) analysis between children with ASD and TD children. LDA scores showed differentially abundant bacterial taxa between children with ASD and TD children (LDA >3.0). Cladograms generated by LEfSe indicated differences in the bacterial taxa between children with ASD and TD children. Red bras represent taxa enrichment in ASD, and green bars indicate taxa enrichment in TD, P-value <0.05. ASD, autism spectrum disorder; TD, typically developing; 16S ribosomal RNA, 16S rRNA.
Altered gut metabolites in children with ASD based on the ultra-high-performance liquid chromatography-mass spectrometry (UPLC-MS) method
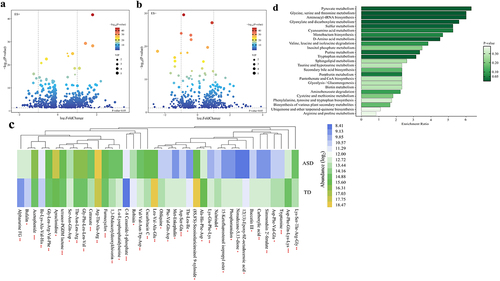
Volcano plots summarized the results of significantly differential metabolites [variable importance in projection (VIP) ≥ 1 and P-value <0.05] (). Besides, the relative abundance of the top 40 significantly altered gut metabolites (fold change ≤ 0.5 or ≥ 2, VIP ≥ 1, and P-value <0.05) were displayed by the heatmap (). To identify important KEGG pathways with significantly altered metabolites, metabolite pathway enrichment analysis (MPEA) was carried out based on the 397 metabolites (fold change ≥ 1.1 or ≤ 0.9, VIP ≥ 1.25, and P-value <0.05) (Supplementary Table S9), finding out the 25 key metabolic pathways, further suggesting a different metabolic state ().
Figure 3. Altered gut metabolites in children with ASD based on the UPLC-MS method (n = 180). (a, b) Volcano plot of the significantly differential gut metabolites in the positive (a) and negative (b) ion modes. The differential metabolites were screened out according to the variable importance in projection (VIP) ≥ 1 and P-value <0.05. Two vertical lines indicate metabolites log2foldchange −1 and 1, respectively, and the horizontal line indicates the P-value of 0.05. The color of the dot represents the P-value levels. (c) Heatmap of the log2-transformed relative abundance of the top 40 significantly differential gut metabolites (fold change ≤ 0.5 or ≥ 2, VIP ≥ 1, and P-value <0.05). * P-value <0.05, ** P-value <0.01, *** P-value <0.001. (d) Horizontal bar charts of KEGG pathways enrichment analyses. The pathways were screened according to the significantly differential metabolites (fold change ≥1.1 or ≤0.9, VIP ≥ 1.25, and P-value <0.05). The bar lengths indicate the enrichment ratio levels of the pathways. The color of the bar represents the P-value levels. ASD, autism spectrum disorder; UPLC-MS, ultra-high-performance liquid chromatography-mass spectrometry.
The correlation between unbalanced dietary intake and altered gut microbiota in children with ASD
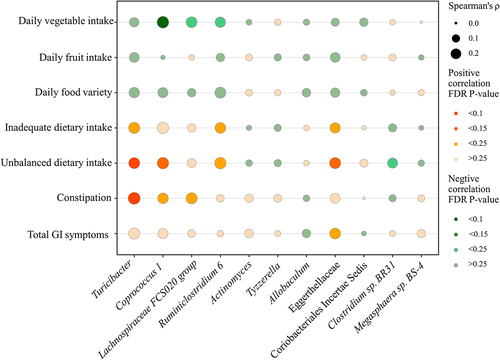
In this study, the dietary intake (food groups intakes, food variety, and diet quality) were compared between children with ASD and TD children. The results were consistent with or without adjustment of the covariates that children with ASD consumed fewer vegetables/fruits, less variety of food, and a higher degree of inadequate/unbalanced dietary intake than TD children (Supplementary Tables S3, 4). Among the 11 altered microbiota, the daily vegetable intake was negatively associated with Coprococcus 1 and Lachnospiraceae FCS020 group (r = −0.297, FDR corrected P-value = 0.088; r = −0.238, FDR corrected P-value = 0.198) (, Supplementary Table S7). Inadequate dietary intake was positively correlated with the Turicibacter and Eggerthellaceae (r = 0.241, FDR corrected P-value = 0.187; r = 0.197, FDR corrected P-value = 0.234). Unbalanced dietary intake was positively correlated with the Turicibacter, Coprococcus 1, and Eggerthellaceae (r = 0.234, FDR corrected P-value = 0.099; r = 0.257, FDR corrected P-value = 0.121; r = 0.240, FDR corrected P-value = 0.125) (, Supplementary Table S7); Unbalanced dietary intake was negatively correlated with Clostridium sp. BR31 (r = −0.195; FDR corrected P-value = 0.200) (, Supplementary Table S7).
Figure 4. The correlation between unbalanced dietary intake and altered gut microbiota and GI symptoms in children with ASD (n = 90). GI symptoms include constipation and total GI symptoms. The size of the bubble represents the correlation levels. The color of the bubble represents the FDR-corrected P-value levels. Orange: a positive correlation. Green: a negative correlation. Adjusted for child’s age, sex, BMI, ASD symptom severity, intellectual functioning, birth mode, feeding patterns before 2 years of age, antibiotic exposure before the age of 5, daily sleep duration, daily MVPA duration, maternal obesity, and GI symptoms during pregnancy. GI, gastrointestinal; ASD, autism spectrum disorder; BMI, body mass index; MVPA, moderate-to-vigorous physical activity.
The correlation between altered gut microbiota and GI symptoms in children with ASD
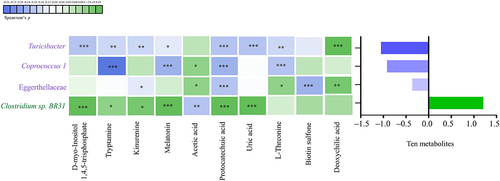
In this study, the GI symptoms (constipation and total GI symptoms scores) were also compared between children with ASD and TD children. The results were consistent with or without adjustment of the covariates that children with ASD had more severe constipation and total GI symptoms than TD children (Supplementary Tables S5, 6). Among the 11 altered microbiota, the Turicibacter, Coprococcus 1, and Lachnospiraceae FCS020 group were positively correlated with constipation (r = 0.291, FDR corrected P-value = 0.099; r = 0.213, FDR corrected P-value = 0.242; r = 0.241, FDR corrected P-value = 0.165) (, Supplementary Table S7). The Eggerthellaceae was positively correlated with total GI symptoms (r = 0.228, FDR corrected P-value = 0.242) (, Supplementary Table S7).
The altered gut microbiota modulated the associations of unbalanced dietary intake with GI symptoms in children with ASD
Among the altered gut microbiota, the modulating effect models adjusting for the covariates revealed that the increased Turicibacter (β = 0.327, P-value = 0.022; β = 0.593, P-value = 0.014), Coprococcus 1 (β = 1.061, P-value = 0.029; β = 1.995, P-value = 0.036) and Eggerthellaceae (β = 6.732, P-value = 0.010; β = 14.452, P-value = 0.003) positively modulated the associations of unbalanced dietary intake with constipation and total GI symptoms (, ), and the decreased Clostridium sp. BR31 (β = −6.045, P-value = 0.041; β = −12.609, P-value = 0.033) negatively modulated their associations in children with ASD (, ). Hence, the increased microbiota Turicibacter, Coprococcus 1, Eggerthellaceae, and the decreased Clostridium sp. BR31 was focused on in the later analyses.
Figure 5. The altered gut microbiota modulated the associations of unbalanced dietary intake with GI symptoms in children with ASD (n = 90). GI symptoms include constipation and total GI symptoms. Adjusted for child’s age, sex, BMI, ASD symptom severity, intellectual functioning, birth mode, feeding patterns before 2 years of age, antibiotic exposure before the age of 5, daily sleep duration, daily MVPA duration, maternal obesity, and GI symptoms during pregnancy. GI, gastrointestinal; ASD, autism spectrum disorder; BMI, body mass index; MVPA, moderate-to-vigorous physical activity. A statistically significant modulation (P-value <0.05).
Table 2. The altered gut microbiota modulated the associations of unbalanced dietary intake with GI symptoms in children with ASD (n = 90).
The correlation between altered gut microbiota and altered gut metabolites in children with ASD
As for the correlations between altered gut microbiota and metabolites, we found that the increased Turicibacter, Coprococcus 1, and Eggerthellaceae showed an overall negative correlation with the ten altered metabolites (FDR corrected P-value <0.25). In contrast, the decreased Clostridium sp. BR31 showed an overall positive correlation with the ten altered metabolites (FDR corrected P-value <0.25). See and Supplementary S8 for the specific correlations of each altered microbiota and metabolite.
Figure 6. The correlation between altered gut microbiota and altered gut metabolites in children with ASD (n = 90). The graph on the right shows the total partial Spearman coefficients between gut microbiota and ten altered metabolites. The altered gut microbiota were the bacterial taxa modulating the associations of unbalanced dietary intake with GI symptoms. Adjusted for child’s age, sex, BMI, intellectual functioning, birth mode, feeding patterns before 2 years of age, antibiotic exposure before the age of 5, daily sleep duration, daily MVPA duration, maternal obesity, and GI symptoms during pregnancy. ASD, autism spectrum disorder; GI, gastrointestinal; BMI, body mass index; MVPA, moderate-to-vigorous physical activity. * FDR corrected P-value <0.25, ** FDR corrected P-value <0.1, *** FDR corrected P-value <0.05.
The correlation between altered gut metabolites and GI symptoms in children with ASD
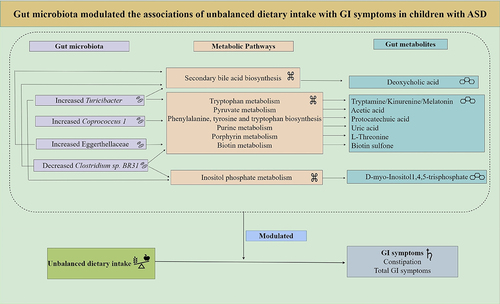
Among the altered metabolites, ten metabolites derived from microbiota (Turicibacter, Coprococcus 1, Eggerthellaceae, and Clostridium sp. BR31) were screened out, enriched in eight metabolic pathways, and were identified to correlate with constipation and total GI symptoms in ASD. The ten altered gut metabolites included eight decreased and two increased metabolites (Supplementary Figure S3, Supplementary Table S9). Notably, the eight decreased metabolites, namely d-myo-Inositol 1,4,5-trisphosphate, tryptamine, kynurenine, melatonin, protocatechuic acid, uric acid, L-Threonine, and biotin sulfone, showed significantly negative correlations with constipation and total GI symptoms (FDR corrected P-value <0.25) (, Supplementary Table S10). The two increased metabolites, including acetic acid and deoxycholic acid, showed significantly positive correlations with constipation and total GI symptoms (FDR corrected P-value <0.1) (, Supplementary Table S10). In summary, these ten altered metabolites exhibited an overall negative correlation with GI symptoms in children with ASD (). Besides, the eight metabolic pathways including Inositol phosphate metabolism, Tryptophan metabolism, Pyruvate metabolism, Phenylalanine, tyrosine and tryptophan biosynthesis, Purine metabolism, Porphyrin metabolism, Biotin metabolism, and Secondary bile acid biosynthesis were exhibited (). Therefore, combined microbiome and metabolome analyses revealed a modulating role of gut microbiota on the associations of unbalanced dietary intake with GI symptoms in ASD ().
Figure 7. The correlation between altered gut metabolites and GI symptoms in children with ASD (n = 90). GI symptoms include constipation and total GI symptoms. The graph on the right shows the total partial Spearman coefficients between the ten altered metabolites and GI symptoms. Adjusted for child’s age, sex, BMI, intellectual functioning, birth mode, feeding patterns before 2 years of age, antibiotic exposure before the age of 5, daily sleep duration, daily MVPA duration, maternal obesity, and GI symptoms during pregnancy. GI, gastrointestinal; ASD, autism spectrum disorder; BMI, body mass index; MVPA, moderate-to-vigorous physical activity. * FDR corrected P-value <0.25, ** FDR corrected P-value <0.1, *** FDR corrected P-value <0.05.
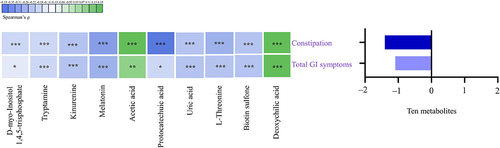
Figure 8. Ten altered gut metabolites correlated with GI symptoms in the eight KEGG pathways. GI symptoms include constipation and total GI symptoms. ![]()
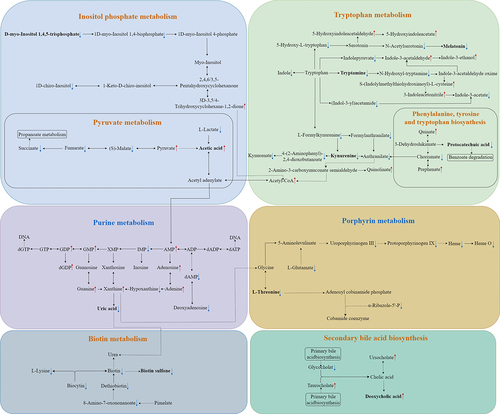
Figure 9. The summary of the modulating role of gut microbiota on the associations of unbalanced dietary intake with GI symptoms in children with ASD.
Discussion
Our study observed that there existed 11 significantly altered gut microbiota (FDR corrected P-value <0.05) and 397 altered metabolites (P-value <0.05) in children with ASD compared with TD children. Among 11 altered gut microbiota, the increased Turicibacter, Coprococcus 1, and Eggerthellaceae positively modulated the associations of unbalanced dietary intake with constipation and total GI symptoms and the decreased Clostridium sp. BR31 negatively modulated their associations in children with ASD (P-value <0.05). Among the altered metabolites, ten metabolites derived from microbiota (Turicibacter, Coprococcus 1, Eggerthellaceae, and Clostridium sp. BR31) correlated with constipation and total GI symptoms in ASD (FDR corrected P-value <0.25). Together, the altered microbiota strengthens the relationship between unbalanced dietary intake and GI symptoms in ASD. Further, the metabolomics findings support the modulating roles of gut microbiota on the associations of unbalanced dietary intake with GI symptoms in children with ASD.
Herein, we noticed 11 altered gut microbiota, including the increased abundance of Turicibacter, Coprococcus 1, Lachnospiraceae FCS020 group, Allobaculum, Eggerthellaceae, Coriobacteriales Incertae Sedis, and Megasphaera sp. BS-4, and the decreased abundance of Ruminiclostridium 6, Actinomycetales, Tyzzerella, and Clostridium sp. BR31 in children with ASD relative to TD children (FDR corrected P-value <0.05). Turicibacter displayed the highest increase in abundance between children with ASD and TD children in the current study (FDR corrected P-value <0.001). Similarly, it has been reported that Turicibacter was associated with other neurological disorders, such as Parkinson’s disease and depression (P-value <0.05).Citation34,Citation35 Turicibacter as a potential pathobiont and its interaction with the host are poorly understood, and thus its basic pathogenic mechanisms need to be further investigated. Coprococcus 1 belongs to the Lachnospiraceae family and can produce SCFAsCitation36. SCFAs are the fundamental gut microbial byproducts that are related to microbiome-gut-brain axis function. SCFAs mainly include acetic acid (AA), propionic acid (PPA), butyrate (BTA), and valeric acid (VA)Citation37. Growing evidence also shows that higher concentrations of SCFAs may be plausible environmental agents that are related to altered GI function and overall health status in children with ASD.Citation38 Interestingly, the Lachnospiraceae FCS020 group, as a member of the Lachnospiraceae family, can also increase the production of SCFAs.Citation39 Allobaculum isolates from ulcerative colitis patients exacerbate colitis in mice, implying that Allobaculum species may play causal roles in disease in a subset of Inflammatory Bowel Disease (IBD) patients.Citation40 Sadik et al. found evidence of a potential causal link between parental, particularly maternal, IBD and autism.Citation41 Therefore, the relationship between Allobaculum and autism deserves extensive exploration. It has been recognized that the abundance of Eggerthellaceae affected lipid metabolism in patients with radiation enteritis.Citation42 The lipid metabolism status and its end-products can impact the host’s systemic inflammation.Citation43 Ruminiclostridium 6, displaying lower abundance in the ASD group of this study (FDR corrected P-value = 0.034), was negatively correlated with the inflammation-related miR-155-5p in the proximal colon and midbrain tissues (P-value <0.05),Citation44 and strong inflammation states are associated with ASD.Citation45 Our analysis illustrated a significantly lower relative abundance of Actinomyces in ASD (FDR corrected P-value = 0.002). Nevertheless, Actinomyces showed discrepancies at a statistically significant level regarding its abundance in children with ASD and GI symptoms compared to their control groups.Citation46 Our study also manifested a significantly lower abundance of Tyzzerella in ASD children (FDR corrected P-value <0.001). Similar results were reported in 2019 by our colleagues (FDR corrected P-value = 0.002).Citation47 Accordingly, another study suggested that Tyzzerella was negatively associated with chronic intestinal inflammation in part of the intestine, showing this microbiota might play as probiotics in irritable bowel syndrome (IBS) patients. (P-value <0.05).Citation48 Finegold et al. recorded nine Clostridium species in the stool of autistic children that were not found in fecal samples from healthy subjects.Citation49 In contrast, we noted a significantly decreased Clostridium sp. BR31 in the ASD group (FDR corrected P-value <0.001). The reason for these disparities needs to be further explored.
As for the comparisons of diets between children with ASD and TD children, our findings are in agreement with some prior works that autistic children consumed fewer vegetables/fruits than did TD children.Citation50–52 In addition to lower vegetables/fruit consumption, a less variety of food and inadequate/unbalanced dietary intake were observed among ASD children in the present study (P-value <0.05). A studyCitation53 from Hong Kong confirmed our findings that there was less variety of food (P-value = 0.005) and poorer overall diet quality (P-value = 0.001) in children with ASD than in TD children. Sharp et al. documented that 78.5% of children with ASD consumed a diet at risk for five or more inadequacies.Citation52 Dietary problems in children with ASD are of particular concern because they might cause or aggravate inadequate nutrient intakes.
Children with ASD tend to eat an unbalanced dietary intake, which can have a fundamental effect on the gut microbiota and its metabolites. In our study, the daily vegetable intake was negatively associated with Coprococcus 1 (FDR corrected P-value = 0.088). The researchers have pointed out that vegetable intake was positively associated with the relative abundance of the Lachnospira genus (FDR corrected P-value = 0.032).Citation54 Collectively, these studies highlight the important role of vegetable intake in the abundance of specific microbiota. Besides, we identified that unbalanced dietary intake was positively correlated with the Turicibacter, Coprococcus 1, and Eggerthellaceae, as well as negatively correlated with the Clostridium sp. BR31 (FDR corrected P-value <0.25). Indeed, it has been documented that diet is one of the most influential environmental factors in determining the composition of the gut microbiota.Citation21 In light of the extant literature and the findings of the current study, it appears to be more convincing to confirm the associations of dietary intake with the gut microbial signature. Moreover, unhealthy eating patterns-induced changes in gut microbiota composition can lead to an increased risk of developing certain diseases (e.g., IBD and CVD).Citation55 Coincidentally, the present study observed that the children with ASD exhibited more severe constipation and total GI symptoms than TD children (P-value <0.05).
It is worth noting that the altered microbiota, mainly including Turicibacter, Coprococcus 1, and Eggerthellaceae, positively modulated the associations of unbalanced dietary intake and constipation and total GI symptoms in children with ASD (P-value <0.05). Lynch et al. indicated that Turicibacter could lead to changes in host bile acid profiles.Citation56 Impaired bile acids homeostasis can affect the intestine, contributing to the pathogenesis of GI diseases.Citation57 Accordingly, deoxycholic acid derived from Turicibacter, as a bile acid, presented a higher abundance in ASD in the current study, indicating the possible abnormal status of the related second bile acid biosynthesis pathway. Coprococcus 1 could produce SCFAs that are potentially toxic to the mitochondria, which is known to cause GI dysfunction.Citation27 Interestingly, acetic acid, the most abundant SCFAs in the human colon, has been observed to be higher in ASD in our study, which might be a possible mechanism of GI problems in ASD. As mentioned earlier, the Eggerthellaceae could affect lipid metabolism,Citation42 thereby affecting the integrity of the intestinal barrier,Citation42 supporting an association of Eggerthellaceae with GI symptoms. The abundance of Clostridium was positively correlated with the content of 5-Hydroxytryptamine (serotonin) in the colon.Citation58 Serotonin, an important product of tryptophan metabolism, is involved in regulating GI motility and promoting intestinal peristalsis by binding to serotonin receptors expressed in the colon epithelial cells.Citation58 Interestingly, we observed a lower abundance of Clostridium sp. BR31 in ASD children (FDR corrected P-value <0.001). And we noticed a lower abundance of vital metabolites in the tryptophan metabolic pathway, including tryptamine, kynurenine, and indole, although no decreases in tryptophan and serotonin were directly observed. These findings may mechanistically explain, in part, the negative modulation of decreased Clostridium sp. BR31 on the associations of unbalanced dietary intake with GI symptoms in ASD.
The gut microbiota may influence various processes of GI pathophysiology in ASD via the key metabolic molecules.Citation9,Citation20,Citation29 We identified ten altered metabolites (including d-myo-Inositol 1,4,5-trisphosphate, tryptamine, kinurenine, melatonin, protocatechuic acid, uric acid, L-Threonine, biotin sulfone, acetic acid, and deoxycholic acid) derived from Turicibacter, Coprococcus 1, Eggerthellaceae, and Clostridium sp. BR31 correlating with GI symptoms (FDR corrected P-value <0.25). D-myo-Inositol 1,4,5-trisphosphate, as a second messenger, can bind to its own intracellular receptor causing the release of Ca2+,Citation59 which can contribute to the pathogenesis of various diseases.Citation60 On this basis, we infer that constipation in ASD may be a result of aberrant gut motility caused by decreased D-myo-Inositol 1,4,5-trisphosphate-mediated calcium imbalance. Tryptophan can be metabolized into tryptamine, kynurenine, and indole, thereby modulating neuroendocrine and intestinal immune responses.Citation61 A previous study implicated that patients with ASD exhibited reduced levels of tryptophan in the plasma.Citation62 One study validated that tryptamine can increase the fluid secretions in colonoids from germ-free and humanized mice, as well as improve gut motility in germ-free mice.Citation63 Kynurenate may have anti-inflammatory properties in the GI tractCitation64 and can inhibit the proliferation of colon cancer cells in vitro.Citation65 Indoles can contribute to maintaining the intestinal biological barrier, affecting the immune system’s function, and markedly improving intestinal health.Citation66 Melatonin is another decreased metabolite present in the tryptophan metabolism for ASD children, achieving antioxidant and anti-inflammatory functions locally and regulating gut motility, and therefore the reduction of melatonin may be one of the vital drivers for GI problems in ASD.Citation67 Thus, the metabolites including tryptamine, kynurenine, and melatonin exhibited negative correlations with GI symptoms in this study (FDR corrected P-value <0.1). Protocatechuic acid had a protective effect on oxidative stress, inflammation, and intestinal barrier function by modulating intestinal flora.Citation68 Uric acid, as a powerful antioxidant, plays a defensive role in intestinal injury via oxidative stress elimination and microbiota composition modulation, preferably in gut immunity.Citation69 L-Threonine and attapulgite can maintain gut health by increasing the levels of intestinal barrier protein expression and regulating the balance of gut microbiota.Citation70 Biotin plays an extremely important role in maintaining intestinal homeostasis and microbial composition balance.Citation71 Therefore, lack of protection caused by the reduction of beneficial metabolites like protocatechuic acid, uric acid, L-Threonine, and biotin may be one of the underlying causes of GI issues for ASD children. Additionally, we noticed increased acetic acid and deoxycholic acid positively correlating with GI symptoms (FDR corrected P-value <0.1). It was speculated that the increased intestinal permeability presented in ASD could be related to changes in the fecal production of acetic acid.Citation38 It was described that deoxycholic acid can induce apoptosis of gastric epithelial cell line GES-1Citation72 and can potentiate the mechanosensitivity of high threshold spinal afferents leading to visceral hypersensitivity.Citation73
The present study was integrated into a comprehensive assessment project, which may reduce parents’ recruitment bias because of their interest in their child’s dietary and GI conditions. All subjects in this study were recruited based on research projects, not outpatients or inpatients, which may minimize the admission rate bias. To diminish the investigation bias, all investigators were trained strictly, and the questionnaires filled out by parents were checked and reviewed by the trained investigators. There are also some limitations of our study. First, the ASD children who had neuropsychiatric disorders or received special diets set by parents were excluded from this study, and future studies will capture the ASD children with co-occurring neuropsychiatric conditions and/or receiving dietary interventions for intense investigation. Second, we are limited by taxonomic classification based on 16S rRNA profiling rather than shotgun metagenomic sequencing, as 16S rRNA gene sequencing only captured a portion of the gut microbiota community identified by shotgun sequencing.Citation74 Third, relying on parents’ reports on FFQ can be subject to social desirability bias and recall bias,Citation75 and future studies are encouraged to apply reproducible metabolomics biomarkers as surrogates to validate parent-reported diet measures.Citation76 Fourth, we just performed the correlation analyses to study the metabolites correlating with GI symptoms, and future studies will more deeply explore the mechanisms of gut metabolites along the metabolism pathway on GI symptoms in ASD through molecular biology and animal experiments.
In conclusion, results from the present study demonstrated that the altered microbiota strengthens the relationship between unbalanced dietary intake and GI symptoms in ASD. Furthermore, the metabolomics findings support the modulating role of gut microbiota on the associations of unbalanced dietary intake with GI symptoms in children with ASD. The present findings suggest that not only the dietary intervention but also the gut microbiota- and metabolites-targeted interventions should be designed to alleviate GI symptoms in children with ASD. Nevertheless, more research is warranted to replicate our findings and to further investigate the modulating role of gut microbiota on the associations of diet with GI symptoms in ASD.
Materials and methods
Study design and participants
An age- and sex-matched (1:1) case-control study was carried out in China between September 2021 and May 2022. The children with ASD and TD children from 2 to 10 years were recruited based on the strict eligibility and exclusion criteria from Guangzhou and Foshan City, Guangdong Province, China (). The diagnosis of ASD was confirmed with the Autism Diagnosis Observation Schedule-2 (ADOS-2)Citation77 according to the Diagnostic and Statistical Manual of Mental Disorders, 5th Edition (DSM-5)Citation78 criteria by two experienced developmental and behavioral pediatricians. The Social Communication Questionnaire (SCQ)Citation79 was used to screen for a potential diagnosis of ASD for TD children, and the scores were within the typical range (Supplementary Table S11). Also, none of the TD children has a sibling with a confirmed diagnosis of ASD. Besides, the exclusion criteria for ASD and TD children were: had a prior diagnosis of neuropsychiatric disorders [e.g., seizures, anxiety disorder, depressive disorder, attention deficit hyperactivity disorder (ADHD), schizophrenia, or bipolar disorder] and clinically evident inflammatory conditions (e.g., Crohn’s disease and ulcerative colitis); received a special diet (including the gluten-free/casein-free diet and the ketogenic diet) set by parents, took probiotics, prebiotics, or synbiotics supplements, antibiotics or antifungal medications, and laxatives within three months prior to stool sample collection.
Sample size
A matched case-control design was adopted in this study. The case group was ASD children and the control group was TD children. The matching principle was that the age difference between the case and control was less than 1.5 years. It was reported that GI symptoms have been found to occur in 10% of TD children.Citation80 Children with ASD are 2.5 times more likely to suffer from GI symptoms than TD children.Citation80 The correlation coefficient between cases and their matched controls (phi) was 0.2.Citation81 At least 76 ASD cases and 76 controls were calculated by sample size calculation software to provide 90% statistical power (1-β) and a 2-tailed 5% α level. After considering the 85% qualified rate of questionnaire filling, this study finally enrolled 90 ASD cases and 90 TD controls with matched age and sex.
Dietary and GI assessment
Dietary data were obtained from parents of children by using a validated 7-day food frequency questionnaire (FFQ).Citation82 The FFQ consisted of food lists [cereals/potatoes, vegetables, fruit, livestock/poultry meat, fish/shrimp, eggs, soybeans, dairy, and drinking water]. The FFQ with the number of times during the past seven days for each food and the average quantity of food consumed each time based on a specified standardized portion size (a serving = 50 grams) was used to calculate the average daily food intake (g/ml per day). The diet quality was assessed using the Dietary Balance Index (DBI) established based on the recommended daily food intake from the Dietary Guidelines for Chinese Residents (2022) and Chinese Food Pagoda. The specific methods for diet quality assessment via DBI had been described in the previously published study.Citation83 The DBI consists of three main evaluation indexes, namely high bound score (HBS), low bound score (LBS), and diet quality distance (DQD). HBS is the sum of all positive values, with higher scores reflecting the degree of excessive dietary intake. LBS is the sum of absolute values of negative scores, with higher scores indicating the degree of insufficient dietary intake. DQD is the sum of HBS and LBS, with higher scores representing the degree of unbalanced dietary intake. The severity of GI symptoms was assessed using a shortened version of the 6-item Gastrointestinal Severity Index (6-GSI) questionnaire,Citation84 composed of six symptoms, including constipation, diarrhea, stool consistency, stool smell, flatulence, and abdominal pain. Each symptom is rated on a three-point Likert-type scale ranging from 0 to 2, with a higher score signifying more severe GI symptoms.Citation85 The intraclass correlation coefficient (ICC) for evaluating interrater reliability of the GI total scores was found to be high at 0.95 [95% confidence interval(CI): 0.87–0.98].Citation85
Procedures
The demographic data were collected via validated scales/questionnaires and in-person interviews with parents of children enrolled in this study. Furthermore, face-to-face physical, behavioral, and psychological measures were carried out on the enrolled children. Informed consent was obtained for participation, and the study was conducted in accordance with the principles of the Declaration of Helsinki and the Ethical Committee of the School of Public Health, Sun Yat-Sen University (No. 067 [2022]).
Stool sample collection
The parents were given a stool sample collection kit and provided detailed instructions for stool sample collection. After collection at home or the research center, the stool samples with ice bags were transported by The City Delivery to the research laboratory and stored in a − 80°C freezer within 4 h for subsequent 16S rRNA gene amplicon sequencing and UPLC-MS.
16S rRNA gene amplicon sequencing
Genomic DNA was extracted from the stool samples using the QIAamp DNA Stool Mini Kit (QIAGEN, Germany). The concentration and purity of DNA were detected by a Nanodrop spectrophotometer (Nanodrop Technologies Inc., Wilmington, DE, USA). The V3-V4 regions of the bacterial 16S rRNA gene was amplified with primers (338F: 5′-ACTCCTACGGGAGGCAGCA-3′; 806 R: 5′-GGACTACHVGGGTWTCTAAT-3′). The sequencing library was generated using the NEBNext® Ultra™ DNA Library Prep Kit for Illumina (New England Biolabs, Ipswich, MA, USA) following the manufacturer’s protocols. The sequencing steps were conducted on the Illumina HiSeq 2500 platform (MAGIGENE Co., Ltd., Guangzhou, Guangdong Province, China). The generated paired-end reads were merged using USEARCH (version 10.0.240)Citation86 and quality-filtered by fastp (version 0.14.1).Citation87 Sequences were clustered at a 97% similarity identity level by UPARSE (V11)Citation88 to generate operational taxonomic units (OTUs) and were subjected to singletons removal and rarefaction before subsequent analysis. Finally, a representative sequence for each OTU was selected and assigned using the RDP Bayes-ClassifierCitation89 with a confidence cutoff of 80%.
The sequencing depths were examined by plotting the rarefaction curve of richness using Usearch-alpha_div_rare (V10, http://www.drive5.com/usearch/). For alpha diversity, the microbial richness and diversity were evaluated by the Chao1, Shannon_2, and Simpson indexes at phylum and genus levels with the Wilcoxon rank-sum tests. The Chao1, Shannon_2, and Simpson indexes were calculated using Usearch-alpha_div (V10, http://www.drive5.com/usearch/). For microbiota beta diversity, PCoA and NMDS based on Bray-Curtis distance, PCoA based on unweighted Unifrac and weighted Unifrac distances with PERMANOVA tests were used to evaluate the spatiotemporal variations in species composition by using the vegan package (https://www.researchgate.net/publication/258996451) in R software.Citation90 The top 375 microbial OTUs were selected for microbial network analysis based on the Spearman correlation algorithms to explore co-occurrence and interaction patterns in microbial communities. Each node presents one OTU, and the node size indicates the relative abundance of each OTU. The straight line represents a significant correlation (−0.4 > r > 0.4) between two nodes, and the network visualization was conducted by the “Gephi” interactive platform.Citation91 Next, the significantly differential relative abundance of microbiota at family, genus, and species levels between children with ASD and TD children was tested by Wilcoxon rank-sum and ANCOM-BC testsCitation92. The P-values were adjusted by Benjamini – Hochberg (BH) correction. Finally, the LEfSe and random forest model analyses were used for statistical analysis to identify the bacterial taxa differentially represented between children with ASD and TD children, and the LEfSe and random forest analyses were performed using the LEfSe software with LDA > 3.0Citation93 and randomForest package in R software (version 3.6.1), respectively.
Untargeted metabolomic analysis using UPLC-MS
The stool samples were detected via UPLC-MS (Agilent Technologies, Santa Clara, CA, USA) using a Waters Acquity UPLC HSS T3 C18 column (2.1 mm × 100 mm, 1.8 μm) at a flow rate of 0.4 mL/min and a column temperature of 40°C. The mobile phase A was H2O containing 0.1% formic acid and mobile phase B was acetonitrile containing 0.1% formic acid. Samples were analyzed in both positive and negative modes in an automatic pattern. The scanning range of the time-of-flight mass spectrometry (TOF MS) was 100–1,500 m/z. The Electrospray ionization (ESI) source conditions were set as follows: Ion Source Gas1 (Gas1) as 50, Ion Source Gas2 (Gas2) as 60, curtain gas (CUR) as 35, source temperature: 550°C, IonSpray Voltage Floating (ISVF) +5500/−4500 V. The original data acquired by LC-MS was converted into mzML format by ProteoWizard software. Peak extraction, peak alignment, and retention time correction were respectively performed by the XCMS program. The “SVR” method was used to correct the peak area. The peaks with a detection rate lower than 50% in each group of samples were discarded. After that, metabolic identification information was obtained by searching the laboratory’s self-built database, integrated public database, artificial intelligence database, and MetDNA.
Volcano plots were used to summarize the results of significantly differential metabolites with VIP ≥ 1 and P-value <0.05. Two vertical lines of the volcano plots indicate metabolites log2foldchange −1 and 1, respectively, and the horizontal line indicates the P-value of 0.05. The color of the dot represents the P-value levels and the volcano plots were depicted with ggplot2 in R software (version 4.1.0). The log2-transformed relative abundance of the top 40 significantly altered gut metabolites with fold change ≤ 0.5 or ≥ 2, VIP ≥ 1, and P-value <0.05 between children with ASD and TD children were presented by the heatmap. The MPEA was carried out to find the key KEGG pathways with the significantly altered metabolites (fold change ≥ 1.1 or ≤ 0.9, VIP ≥ 1.25, and P-value <0.05) through R package clusterProfiler (version 3.8.1). Notably, the metabolites derived from microbiota were annotated using the KEGG Compound database and mapped to the KEGG Pathway database (http://www.kegg.jp/kegg).
Statistical analyses
The normality of data was evaluated with the Kolmogorov-Smirnov test. Continuous variables were expressed as median (IQR) and analyzed by the Mann-Whitney U test. Categorical variables were expressed as percentages and analyzed by the chi-squared test. Variables in dietary intake and GI symptoms were compared between children with ASD and TD children by applying the linear regression models adjusting for the covariates (see Supplementary Table S1 for details of the covariates). The Spearman partial correlation coefficients with the Spearman’s P-value and BH correction were used to gain insight into the correlation between unbalanced dietary intake and altered gut microbiota and GI symptoms, as well as the correlation between altered gut microbiota and altered gut metabolites and GI symptoms in ASD. Following, we performed the modulating effects analyses to evaluate whether altered gut microbiota could modulate the associations of unbalanced dietary intake with GI symptoms in children with ASD. Notably, collinearity diagnosis was conducted to test the potential multicollinearity among the covariates included in the models (including linear regression, Spearman partial correlation, and modulating effect models). To estimate effect sizes, the formula r=Z/√(N) was used for Mann – Whitney U-tests, effect size φ for 2 × 2 tables, and Cramer-V for tables larger than 2 × 2, with threshold values of 0.1, 0.3, and 0.5 used to categorize effects as small, medium, and large, respectively.Citation94 Cohen’s f2 was calculated for linear regression and modulating effect models, and f2 ≥0.02, f2 ≥0.15, and f2 ≥0.35 were interpreted as small, medium, and large effect sizes, respectively.Citation95 All data were analyzed using SPSS 26.0 (IBM Corp. Released 2019. IBM SPSS Statistics for Windows, Version 26.0. Armonk, NY, USA: IBM Corp) and R software (version 4.1.0, The R Foundation) with 2-tailed tests and P-value <0.05 was considered significant.
Author contributions
Jin Jing: Conceptualization, Supervision, Funding acquisition, Project administration, Writing – Review & Editing. Yanna Zhu: Conceptualization, Writing – Review & Editing. Hailin Li: Investigation, Data curation, Formal analysis, Writing – original draft. Churui Liu: Software, Validation, Writing – Review & Editing. Saijun Huang, Muqing Cao, Xin Wang, Tingfeng Gu, Xiaoxuan Ou, Shuolin Pan, Zongyu Lin, and Xiaotong Wang: Data collection, Writing – Review & Editing. All authors listed have made a substantial, direct, and intellectual contribution to the work, and approved it for publication.
Supplemental Material
Download Zip (14.4 MB)Acknowledgments
We gratefully acknowledge the participants and their parents for their continuous and enthusiastic participation in the investigation.
Disclosure statement
No potential conflict of interest was reported by the author(s).
Data availability statement
The datasets analyzed during the current study are available from the corresponding author upon reasonable request.
Supplementary material
Supplemental data for this article can be accessed online at https://doi.org/10.1080/19490976.2023.2281350
Additional information
Funding
References
- Wang JY, Ma B, Wang JJ, Zhang ZY, Chen O. Global prevalence of autism spectrum disorder and its gastrointestinal symptoms: a systematic review and meta-analysis. Front Psychiatry. 2022;13:963102. doi:10.3389/fpsyt.2022.963102.
- Mannion A, Leader G. Gastrointestinal symptoms in autism spectrum disorder: a literature review. Rev J Autism Dev Disord. 2014;1(1):11–21. doi:10.1007/s40489-013-0007-0.
- Lefter R, Ciobica A, Timofte D, Stanciu C, Trifan A. A descriptive review on the prevalence of gastrointestinal disturbances and their multiple associations in autism spectrum disorder. Med (Kaunas). 2019;56(1):11. doi:10.3390/medicina56010011.
- Hsiao EY. Gastrointestinal issues in autism spectrum disorder. Harv Rev Psychiatry. 2014;22(2):104–111. doi:10.1097/HRP.0000000000000029.
- Leader G, Abberton C, Cunningham S, Gilmartin K, Grudzien M, Higgins E, Joshi L, Whelan S, Mannion A. Gastrointestinal symptoms in autism spectrum disorder: a systematic review. Nutrients. 2022;14(7):1471. doi:10.3390/nu14071471.
- Madra M, Ringel R, Margolis KG. Gastrointestinal issues and autism spectrum disorder. Psychiatr Clin North Am. 2021;44(1):69–81. doi:10.1016/j.psc.2020.11.006.
- Sharp WG, Berry RC, McCracken C, Nuhu NN, Marvel E, Saulnier CA, Klin A, Jones W, Jaquess DL. Feeding problems and nutrient intake in children with autism spectrum disorders: a meta-analysis and comprehensive review of the literature. J Autism Dev Disord. 2013;43(9):2159–2173. doi:10.1007/s10803-013-1771-5.
- Ferguson BJ, Dovgan K, Severns D, Martin S, Marler S, Gross Margolis K, Bauman ML, Veenstra-VanderWeele J, Sohl K, Beversdorf DQ. Lack of associations between dietary intake and gastrointestinal symptoms in autism spectrum disorder. Front Psychiatry. 2019;10:528. doi:10.3389/fpsyt.2019.00528.
- David LA, Maurice CF, Carmody RN, Gootenberg DB, Button JE, Wolfe BE, Ling AV, Devlin AS, Varma Y, Fischbach MA, et al. Diet rapidly and reproducibly alters the human gut microbiome. Nature. 2014;505(7484):559–563. doi:10.1038/nature12820.
- Andreo-Martínez P, Rubio-Aparicio M, Sánchez-Meca J, Veas A, Martínez-González AE. A meta-analysis of gut microbiota in children with autism. J Autism Dev Disord. 2022;52(3):1374–1387. doi:10.1007/s10803-021-05002-y.
- Dan Z, Mao XH, Liu QS, Guo MC, Zhuang YY, Liu Z, Chen K, Chen JY, Xu R, Tang JM, et al. Altered gut microbial profile is associated with abnormal metabolism activity of autism spectrum disorder. Gut Microbes. 2020;11(5):1246–1267. doi:10.1080/19490976.2020.1747329.
- Wan YT, Zuo T, Xu ZL, Zhang F, Zhan H, Chan D, Leung TF, Yeoh YK, Chan FKL, Chan R, et al. Underdevelopment of the gut microbiota and bacteria species as non-invasive markers of prediction in children with autism spectrum disorder. Gut. 2022;71(5):910–918. doi:10.1136/gutjnl-2020-324015.
- Sharon G, Cruz NJ, Kang DW, Gandal MJ, Wang B, Kim YM, Zink EM, Casey CP, Taylor BC, Lane CJ, et al. Human gut microbiota from autism spectrum disorder promote behavioral symptoms in mice. Cell. 2019;177(6):1600–1618.e17. doi:10.1016/j.cell.2019.05.004.
- Liu FT, Li J, Wu F, Zheng HM, Peng QL, Zhou HW. Altered composition and function of intestinal microbiota in autism spectrum disorders: a systematic review. Transl Psychiatry. 2019;9(1):43. doi:10.1038/s41398-019-0389-6.
- Mohamadkhani A. Gut microbiota and fecal metabolome perturbation in children with autism spectrum disorder. Middle East J Dig Dis. 2018;10(4):205–212. doi:10.15171/mejdd.2018.112.
- Fouquier J, Moreno Huizar N, Donnelly J, Glickman C, Kang DW, Maldonado J, Jones RA, Johnson K, Adams JB, Krajmalnik-Brown R, et al. The gut microbiome in autism: study-site effects and longitudinal analysis of behavior change. mSystems. 2021;6(2):e00848–20. doi:10.1128/mSystems.00848-20.
- Ch’ng C, Kwok W, Rogic S, Pavlidis P. Meta-analysis of gene expression in autism spectrum disorder. Autism Res. 2015;8(5):593–608. doi:10.1002/aur.1475.
- Bundgaard-Nielsen C, Knudsen J, Leutscher PDC, Lauritsen MB, Nyegaard M, Hagstrøm S, Sørensen S. Gut microbiota profiles of autism spectrum disorder and attention deficit/hyperactivity disorder: a systematic literature review. Gut Microbes. 2020;11(5):1172–1187. doi:10.1080/19490976.2020.1748258.
- Alharthi A, Alhazmi S, Alburae N, Bahieldin A. The human gut microbiome as a potential factor in autism spectrum disorder. Int J Mol Sci. 2022;23(3):1363. doi:10.3390/ijms23031363.
- Wu GD, Chen J, Hoffmann C, Bittinger K, Chen YY, Keilbaugh SA, Bewtra M, Knights D, Walters WA, Knight R, et al. Linking long-term dietary patterns with gut microbial enterotypes. Sci. 2011;334(6052):105–108. doi:10.1126/science.1208344.
- Berding K, Donovan SM. Diet can impact microbiota composition in children with autism spectrum disorder. Front Neurosci. 2018;12:515. doi:10.3389/fnins.2018.00515.
- Mathew NE, Mallitt KA, Masi A, Katz T, Walker AK, Morris MJ, Ooi CY. Dietary intake in children on the autism spectrum is altered and linked to differences in autistic traits and sensory processing styles. Autism Res. 2022;15(10):1824–1839. doi:10.1002/aur.2798.
- Yap CX, Henders AK, Alvares GA, Wood DLA, Krause L, Tyson GW, Restuadi R, Wallace L, McLaren T, Hansel NK, et al. Autism-related dietary preferences mediate autism-gut microbiome associations. Cell. 2021;184(24):5916–5931. doi:10.1016/j.cell.2021.10.015.
- Valenzuela-Zamora AF, Ramírez-Valenzuela DG, Ramos-Jiménez A. Food selectivity and its implications associated with gastrointestinal disorders in children with autism spectrum disorders. Nutrients. 2022;14(13):2660. doi:10.3390/nu14132660.
- Vuong HE, Hsiao EY. Emerging roles for the gut microbiome in autism spectrum disorder. Biol Psychiatry. 2017;81(5):411–423. doi:10.1016/j.biopsych.2016.08.024.
- Koeth RA, Wang ZN, Levison BS, Buffa JA, Org E, Sheehy BT, Britt EB, Fu XM, Wu YP, Li L, et al. Intestinal microbiota metabolism of L-carnitine, a nutrient in red meat, promotes atherosclerosis. Nat Med. 2013;19(5):576–585. doi:10.1038/nm.3145.
- Frye RE, Rose S, Slattery J, MacFabe DF. Gastrointestinal dysfunction in autism spectrum disorder: the role of the mitochondria and the enteric microbiome. Microb Ecol Health Dis. 2015;26:27458. doi:10.3402/mehd.v26.27458.
- Williams BL, Hornig M, Buie T, Bauman ML, Chao Paik M, Wick I, Bennett A, Jabado O, Hirschberg DL, Lipkin WI, et al. Impaired carbohydrate digestion and transport and mucosal dysbiosis in the intestines of children with autism and gastrointestinal disturbances. PloS One. 2011;6(9):e24585. doi:10.1371/journal.pone.0024585.
- Yang L, Wang Y, Zhang Y, Li WW, Jiang S, Qian DW, Duan JN. Gut microbiota: a new avenue to reveal pathological mechanisms of constipation. Appl Microbiol Biotechnol. 2022;106(21):6899–6913. doi:10.1007/s00253-022-12197-2.
- Snelson M, de Pasquale C, Ekinci EI, Coughlan MT. Gut microbiome, prebiotics, intestinal permeability and diabetes complications. Best Pract Res Clin Endocrinol Metab. 2021;35(3):101507. doi:10.1016/j.beem.2021.101507.
- Liu XF, Shao JH, Liao YT, Wang LN, Jia Y, Dong PJ, Liu ZZ, He DD, Li C, Zhang X. Regulation of short-chain fatty acids in the immune system. Front Immunol. 2023;14:1186892. doi:10.3389/fimmu.2023.1186892.
- Fan JL, Watanabe T. Atherosclerosis: known and unknown. Pathol Int. 2022;72(3):151–160. doi:10.1111/pin.13202.
- Wang Z, Klipfell E, Bennett BJ, Koeth R, Levison BS, Dugar B, Feldstein AE, Britt EB, Fu XM, Chung YM, et al. Gut flora metabolism of phosphatidylcholine promotes cardiovascular disease. Nature. 2011;472(7341):57–63. doi:10.1038/nature09922.
- Jin M, Li J, Liu F, Lyu N, Wang K, Wang L, Liang SH, Tao H, Zhu BL, Alkasir R. Analysis of the gut microflora in patients with Parkinson’s disease. Front Neurosci. 2019;13:1184. doi:10.3389/fnins.2019.01184.
- Barandouzi ZA, Starkweather AR, Henderson WA, Gyamfi A, Cong XS. Altered composition of gut microbiota in depression: a systematic review. Front Psychiatry. 2020;11:541. doi:10.3389/fpsyt.2020.00541.
- Sun CN, Chen L, Yang H, Sun HJ, Xie Z, Zhao B, Jiang XM, Qin B, Shen Z. Involvement of gut microbiota in the development of psoriasis vulgaris. Front Nutr. 2021;8:761978. doi:10.3389/fnut.2021.761978.
- Yadav S, Dwivedi A, Tripathi A, Tripathi AK. Therapeutic potential of short-chain fatty acid production by gut microbiota in neurodegenerative disorders. Nutr Res. 2022;106:72–84. doi:10.1016/j.nutres.2022.07.007.
- Wang L, Christophersen CT, Sorich MJ, Gerber JP, Angley MT, Conlon MA. Elevated fecal short chain fatty acid and ammonia concentrations in children with autism spectrum disorder. Dig Dis Sci. 2012;57(8):2096–2102. doi:10.1007/s10620-012-2167-7.
- Huang SM, Wu ZH, Li TT, Liu C, Han DD, Tao SY, Pi Y, Li N, Wang JJ. Perturbation of the lipid metabolism and intestinal inflammation in growing pigs with low birth weight is associated with the alterations of gut microbiota. Sci Total Environ. 2020;719:137382. doi:10.1016/j.scitotenv.2020.137382.
- Rice TA, Bielecka AA, Nguyen MT, Rosen CE, Song D, Sonnert ND, Yang Y, Cao YY, Khetrapal V, Catanzaro JR, et al. Interspecies commensal interactions have nonlinear impacts on host immunity. Cell Host & Microbe. 2022;30(7):988–1002.e6. doi:10.1016/j.chom.2022.05.004.
- Sadik A, Dardani C, Pagoni P, Havdahl A, Stergiakouli E, iPSYCH Autism Spectrum Disorder Working Group, Khandake GM, Sullivan SA, Zammit S, Jones HJ, et al. Parental inflammatory bowel disease and autism in children. Nat Med. 2022;28(7):1406–1411. doi:10.1038/s41591-022-01845-9.
- Dong ZQ, Shen XL, Hao YN, Li J, Xu HZ, Yin L, Kuang WH. Gut microbiome: a potential indicator for predicting treatment outcomes in major depressive disorder. Front Neurosci. 2022;16:813075. doi:10.3389/fnins.2022.813075.
- Andersen CJ. Lipid metabolism in inflammation and immune function. Nutrients. 2022;14(7):1414. doi:10.3390/nu14071414.
- Lee YZ, Cheng SH, Chang MY, Lin YF, Wu CC, Tsai YC. Neuroprotective effects of lactobacillus plantarum PS128 in a mouse model of Parkinson’s disease: the role of gut microbiota and microRnas. Int J Mol Sci. 2023;24(7):6794. doi:10.3390/ijms24076794.
- Siniscalco D, Schultz S, Brigida AL, Antonucci N. Inflammation and neuro-immune dysregulations in autism spectrum disorders. Pharmaceuticals (Basel). 2018;11(2):56. doi:10.3390/ph11020056.
- Martínez-González AE, Andreo-Martínez P. The role of gut microbiota in gastrointestinal symptoms of children with ASD. Med (Kaunas). 2019;55(8):408. doi:10.3390/medicina55080408.
- Ma BJ, Liang JJ, Dai MX, Wang J, Luo JY, Zhang ZQ, Jing J. Altered gut microbiota in Chinese children with autism spectrum disorders. Front Cell Infect Microbiol. 2019;9:40. doi:10.3389/fcimb.2019.00040.
- Chen YJ, Wu H, Wu SD, Lu N, Wang YT, Liu HN, Dong L, Liu TT, Shen XZ. Parasutterella, in association with irritable bowel syndrome and intestinal chronic inflammation. J Gastroenterol Hepatol. 2018;33(11):1844–1852. doi:10.1111/jgh.14281.
- Finegold SM, Molitoris D, Song Y, Liu C, Vaisanen ML, Bolte E, McTeague M, Sandler R, Wexler H, Marlowe EM, et al. Gastrointestinal microflora studies in late-onset autism. Clin Infect Dis. 2002;35(Suppl 1):S6–S16. doi:10.1086/341914.
- Malhi P, Venkatesh L, Bharti B, Singhi P. Feeding problems and nutrient intake in children with and without autism: a comparative study. Indian J Pediatr. 2017;84(4):283–288. doi:10.1007/s12098-016-2285-x.
- Buro AW, Gray HL, Kirby RS, Berkman K, Agazzi H, Shaffer-Hudkins E. Diet quality in an ethnically diverse sample of children and adolescents with autism spectrum disorder compared with nationally representative data. Disabil Health J. 2021;14(1):100981. doi:10.1016/j.dhjo.2020.100981.
- Sharp WG, Postorino V, McCracken CE, Berry RC, Criado KK, Burrell TL, Scahill L. Dietary intake, nutrient status, and growth parameters in children with autism spectrum disorder and severe food selectivity: an electronic medical record review. J Acad Nutr Diet. 2018;118(10):1943–1950. doi:10.1016/j.jand.2018.05.005.
- Yeung SSY, Chan R, Li L, Chan D, Leung J, Leung T-F. Eating behaviors and diet quality in Chinese preschoolers with and without autism spectrum disorder: a case-control study. J Pediatr. 2021;237:258–266.e5. doi:10.1016/j.jpeds.2021.06.017.
- Smith-Brown P, Morrison M, Krause L, Davies PSW. Dairy and plant based food intakes are associated with altered faecal microbiota in 2 to 3 year old Australian children. Sci Rep. 2016;6(1):32385. doi:10.1038/srep32385.
- Albenberg LG, Wu GD. Diet and the intestinal microbiome: associations, functions, and implications for health and disease. Gastroenterology. 2014;146(6):1564–1572. doi:10.1053/j.gastro.2014.01.058.
- Lynch JB, Gonzalez EL, Choy K, Faull KF, Jewell T, Arellano A, Liang J, Yu KB, Paramo J, Hsiao EY Turicibacter modifies host bile acids and lipids in a strain-specific manner. doi: 10.1101/2022.06.27.497673.
- Fuchs CD, Trauner M. Role of bile acids and their receptors in gastrointestinal and hepatic pathophysiology. Nat Rev Gastroenterol Hepatol. 2022;19(7):432–450. doi:10.1038/s41575-021-00566-7.
- Jia ZZ. Study on the function of Clostridium in improving functional constipation by exercise. Shanxi Medi Unive. 2019;1–32.
- Gambardella J, Lombardi A, Morelli MB, Ferrara J, Santulli G. Inositol 1,4,5-trisphosphate receptors in human disease: a comprehensive update. J Clin Med. 2020;9(4):1096. doi:10.3390/jcm9041096.
- Mozolewski P, Jeziorek M, Schuster CM, Bading H, Frost B, Dobrowolski R. The role of nuclear Ca2+ in maintaining neuronal homeostasis and brain health. J Cell Sci. 2021;134(8):jcs254904. doi:10.1242/jcs.254904.
- Gao K, Mu CL, Farzi A, Zhu WY. Tryptophan metabolism: a link between the gut microbiota and brain. Adv Nutr. 2020;11(3):709–723. doi:10.1093/advances/nmz127.
- Kałużna-Czaplińska J, Gątarek P, Chirumbolo S, Chartrand MS, Bjørklund G. How important is tryptophan in human health? Crit Rev Food Sci Nutr. 2019;59(1):72–88. doi:10.1080/10408398.2017.1357534.
- Bhattarai Y, Williams BB, Battaglioli EJ, Whitaker WR, Till L, Grover M, Linden DR, Akiba Y, Kandimalla KK, Zachos NC, et al. Gut microbiota-produced tryptamine activates an epithelial G-protein-coupled receptor to increase colonic secretion. Cell Host & Microbe. 2018;23(6):775–785.e5. doi:10.1016/j.chom.2018.05.004.
- Kaszaki J, Erces D, Varga G, Szabó A, Vécsei L, Boros M. Kinurenines and intestinal neurotransmission: the role of N-methyl-D-aspartate receptors. J Neural Transm (Vienna). 2012;119(2):211–223. doi:10.1007/s00702-011-0658-x.
- Walczak K, Turski WA, Rajtar G. Kynurenic acid inhibits colon cancer proliferation in vitro: effects on signaling pathways. Amino Acids. 2014;46(10):2393–2401. doi:10.1007/s00726-014-1790-3.
- Ye XW, Li HY, Anjum K, Zhong XY, Miao SP, Zheng GW, Liu W, Li LJ. Dual role of indoles derived from intestinal microbiota on human health. Front Immunol. 2022;13:903526. doi:10.3389/fimmu.2022.903526.
- Song LJ, He MB, Sun QH, Wang YJ, Zhang JD, Fang Y, Liu SJ, Duan LP. Roseburia hominis increases intestinal melatonin level by activating p-CREB-AANAT pathway. Nutrients. 2021;14(1):117. doi:10.3390/nu14010117.
- Hu RZ, He ZY, Liu M, Tan JJ, Zhand HF, Hou DX, He JH, Wu SS. Dietary protocatechuic acid ameliorates inflammation and up-regulates intestinal tight junction proteins by modulating gut microbiota in LPS-challenged piglets. J Anim Sci Biotechnol. 2020;11:92. doi:10.1186/s40104-020-00492-9.
- Wada A, Higashiyama M, Kurihara C, Ito S, Tanemoto R, Mizoguchi A, Nishii S, Inaba K, Sugihara N, Hanawa Y, et al. Protective effect of luminal uric acid against indomethacin-induced enteropathy: role of antioxidant effect and gut microbiota. Dig Dis Sci. 2022;67(1):121–133. doi:10.1007/s10620-021-06848-z.
- Chen YP. Study on the protective effects of palygorskite and L-threonine on the intestinal of broilers. Nanjing Agri Univ. 2017;1–153.
- Neophytou C, Pitsouli C. Biotin controls intestinal stem cell mitosis and host-microbiome interactions. Cell Rep. 2022;38(10):110505. doi:10.1016/j.celrep.2022.110505.
- Shi YY, Wei Y, Zhang T, Zhang J, Wang Y, Ding SG. Deoxycholic acid could induce apoptosis and trigger gastric carcinogenesis on gastric epithelial cells by quantitative proteomic analysis. Gastroenterol Res Pract. 2016;2016:9638963. doi:10.1155/2016/9638963.
- Yu Y, Villalobos-Hernandez EC, Pradhananga S, Baker CC, Keating C, Grundy D, Lomax AE, Reed DE. Deoxycholic acid activates colonic afferent nerves via 5-HT3 receptor-dependent and -independent mechanisms. Am J Physiol Gastrointest Liver Physiol. 2019;317(3):G275–G284. doi:10.1152/ajpgi.00016.2019.
- Durazzi F, Sala C, Castellani G, Manfreda G, Remondini D, De Cesare A. Comparison between 16S rRNA and shotgun sequencing data for the taxonomic characterization of the gut microbiota. Sci Rep. 2021;11(1):3030. doi:10.1038/s41598-021-82726-y.
- Kipnis V, Midthune D, Freedman L, Bingham S, Day NE, Riboli E, Ferrari P, Carroll RJ. Bias in dietary-report instruments and its implications for nutritional epidemiology. Public Health Nutr. 2002;5(6A):915–923. doi:10.1079/PHN2002383.
- Guasch-Ferré M, Bhupathiraju SN, Hu FB. Use of metabolomics in improving assessment of dietary intake. Clin Chem. 2018;64(1):82–98. doi:10.1373/clinchem.2017.272344.
- Lebersfeld JB, Swanson M, Clesi CD, O’Kelley SE. Systematic review and meta-analysis of the clinical utility of the ADOS-2 and the ADI-R in diagnosing autism spectrum disorders in children. J Autism Dev Disord. 2021;51(11):4101–4114. doi:10.1007/s10803-020-04839-z.
- McGuire A. Diagnosing the diagnostic and statistical manual of mental disorders. Disabil Soc. 2015;30(10):1582–1585. doi:10.1080/09687599.2015.1062233.
- Liu J, Xu X. The application of social communication questionnaire in primary screening for children with autism spectrum disorders. Scientia Sinica Vitae. 2015;45(8):739–747. doi:10.1360/052012-99.
- Lai KYC, Leung PWL, Hung SF, Shea CKS, Mo F, Che KKI, Tse CY, Lau FLF, Ma SL, JCY W, et al. Gastrointestinal problems in Chinese children with autism spectrum disorder. Neuropsychiatr Dis Treat. 2020;16:1807–1815. doi:10.2147/NDT.S260654.
- Dupont WD. Power calculations for matched case-control studies. Biometrics. 1988;44(4):1157–1168. doi:10.2307/2531743.
- Huang LL, Luo XM, Tan Y, Su XY. Study on reproducibility and validity of food frequency questionnaire in Guangzhou. Chin J Dise Control. 2013;17:711–714.
- Gao XL, Tian ZZ, Zhao D, Li KY, Zhao YM, Xu L, Wang X, Fan D, Ma XL, Ling WH, et al. Associations between adherence to four a priori dietary indexes and cardiometabolic risk factors among hyperlipidemic patients. Nutrients. 2021;13(7):2179. doi:10.3390/nu13072179.
- Adams JB, Johansen LJ, Powell LD, Quig D, Rubin RA. Gastrointestinal flora and gastrointestinal status in children with autism–comparisons to typical children and correlation with autism severity. BMC Gastroenterol. 2011;11(1):22. doi:10.1186/1471-230X-11-22.
- Thulasi V, Steer RA, Monteiro IM, Ming X. Overall severities of gastrointestinal symptoms in pediatric outpatients with and without autism spectrum disorder. Autism. 2019;23(2):524–530. doi:10.1177/1362361318757564.
- Edgar RC. Search and clustering orders of magnitude faster than BLAST. Bioinformatics. 2010;26(19):2460–2461. doi:10.1093/bioinformatics/btq461.
- Chen SF, Zhou YQ, Zhou YR, Gu J. Fastp: an ultra-fast all-in-one FASTQ preprocessor. Bioinformatics. 2018;34(17):i884–i890. doi:10.1093/bioinformatics/bty560.
- Edgar RC. UPARSE: highly accurate OTU sequences from microbial amplicon reads. Nat Methods. 2013;10(10):996–998. doi:10.1038/nmeth.2604.
- Wang Q, Garrity GM, Tiedje JM, Cole JR. Naive Bayesian classifier for rapid assignment of rRNA sequences into the new bacterial taxonomy. Appl Environ Microbiol. 2007;73(16):5261–5267. doi:10.1128/AEM.00062-07.
- Oksanen J, Blanchet FG, Kindt R, Legendre P, Minchin PR, O’Hara RB, Simpson GL, Solymos P, Stevens H, Wagner HH Vegan: community ecology package. R package version 2.0-2.
- Bastian M, Heymann S, Jacomy M. Gephi: an open source software for exploring and manipulating networks. Procee Int AAAI Conf Web And Soci Media. 2009;3(1):361–362. doi:10.1609/icwsm.v3i1.13937.
- Lin H, Peddada SD. Analysis of compositions of microbiomes with bias correction. Nat Commun. 2020;11(1):3514. doi:10.1038/s41467-020-17041-7.
- Segata N, Izard J, Waldron L, Gevers D, Miropolsky L, Garrett WS, Huttenhower C. Metagenomic biomarker discovery and explanation. Genome Biol. 2011;12(6):R60. doi:10.1186/gb-2011-12-6-r60.
- Cohen J. A power primer. Psychol Bull. 1992;112(1):155–159. doi:10.1037/0033-2909.112.1.155.
- Selya AS, Rose JS, Dierker LC, Hedeker D, Mermelstein RJ. A practical guide to calculating Cohen’s f2, a measure of local effect size, from PROC MIXED. Front Psychol. 2012;3:111. doi:10.3389/fpsyg.2012.00111.