
Abstract
The purpose of this study is to show the impact of the R&D and marketing integration on new product development (NPD) success without any parametric assumptions on model specification. In the high-tech innovation management context, it has generally been accepted that tight integration between R&D and marketing successfully influences the development of an innovative product by stimulating a mutual understanding between people from different departments. However, a few researchers also pointed out that a too close relationship between R&D personnel and marketing personnel can cause important information to be overlooked, thus reducing NPD success. Our research results, which are based on empirical data and the application of the nonparametric regression method Multivariate Adaptive Regression Splines, show an even more diverse effect of integrating R&D and marketing if different performance criteria are considered. Results demonstrate that the effect of integration between R&D and marketing is nonconstant and nonlinear, a finding that could not be captured with parametric assumptions. Therefore, our research provides an explanation for the opposing observations reported in earlier work.
1. Introduction
New product development (NPD) teams often require not only tangible or physical resources but also cooperation between different departments within the same organisation. To facilitate coordination between different functional teams, many project leaders create a cross-functional NPD team to stimulate integration and cooperation. Not only practitioners but also scholars began to become aware of the importance of R&D and marketing integration, largely because it represented a critical antecedent of NPD performance. However, despite the great amount of research in this area, findings vary considerably regarding how such an integration influences NPD performance. In the NPD research area, although a lot of studies have been conducted in an effort to understand the impact of integrating R&D and marketing on NPD success, mixed results were found regarding the impact of R&D and marketing integration. This means the topic has not been fully explored yet and still has limitations as follows.
First, prior works investigate the relationship between integrating R&D and marketing and NPD outcomes by typically assuming a parametric linear model in their empirical analyses. In other words, most empirical studies have posited parametric linear models to describe the relationship between R&D and marketing integration and NPD performance (Calantone and di Benedetto Citation1988; Calantone, Schmidt, and Benedetto Citation1997; Verona Citation1999; Harmancioglu, Droge, and Calantone Citation2009). These parametric assumptions were motivated largely by methodological convenience in terms of the model structure and estimation process (Ernst Citation2002). However, this parametric model is inherently linked to a model misspecification problem, possibly leading to biased or mixed results under the situation where there is no strong theoretical evidence that support linear relationship. Due to this reason, some studies argued that close R&D and marketing integration positively influences the success of new products by stimulating a mutual understanding between people from different departments (Moenaert and Souder Citation1990; Moenaert, Souder, De Meyer, and Deschoolmeester Citation1994; Song and Parry Citation1997; Lu and Yang Citation2004; Song and Noh Citation2006). Others, however, have found that a too close relationship between R&D personnel and marketing personnel can cause important information to be overlooked, resulting in a reduced possibility of NPD success (Souder Citation1980; Kahn and Mentzer Citation1998; Troy, Hirunyawipada, and Paswan Citation2008).
Second, despite empirical evidence showing that there is considerable variation in the impact of R&D and marketing integration depending on quality or quantity of other NPD resources (Leenders and Wierenga Citation2008), few studies have tried to investigate the joint effects of R&D and marketing integration and other NPD resources (e.g. marketing and R&D competency). The importance of examining joint effects is obvious, as any integration effort needs to be supported by additional R&D and marketing resources in reality.
Lastly, most prior research has ignored the trade-off relationship between NPD performance criteria. Bayus (Citation1997) emphasises that trade-off relationship exists between time to market and product novelty as expressed in a NPD outcome. For instance, there is the possibility that enhanced R&D and marketing integration may stimulate technological completeness of a new product while it may delay development period. Although there have been numerous studies which have defined new product success in multiple dimensions especially since the work of Cooper and Kleinschmidt (Citation1994) was published, few efforts have been made to capture trade-off impact of R&D and marketing integration in multiple performance dimensions.
Consequently, we can state that the traditional parametric approaches are limited when attempting to show change of impact of R&D and marketing integration and are not suitable of analysing the joint effect between integrating R&D and marketing and other NPD resources. Thus, parametric approach of explaining the relationship between R&D and marketing integration and performance is unable to comprehensively describe the relationship found in the real world. Accordingly, the main objective of this study is to address these shortcomings. In particular, our research questions are as follows:
Is the effect of tight integration between R&D and marketing always positive, as stated in the majority of previous literature?
If a nonlinear effect is found, do NPD resources moderate the effect of R&D and marketing integration on NPD success?
Is there any significant difference in the R&D and marketing integration effect depending upon the new product success dimensions?
In order to answer these questions, we use a nonparametric regression model to implement the idea of a flexible functional relationship between R&D and marketing integration and NPD success. In this study, we apply the Multivariate Adaptive Regression Splines (MARS) regression model, which captures flexible function between R&D and marketing integration and new product performance without any parametric assumptions on model specification. Furthermore, the model can identify significant interaction effects between the integration of R&D and marketing and other NPD resources. MARS is applied to survey data from the Korean ICT industry. The data were collected using survey questionnaires, which targeted NPD project managers of NPD teams in Korean ICT companies. Additionally, we conduct Monte Carlo simulations to show what the marginal response function of R&D and marketing integration looks like and what the marginal response surface between R&D and marketing integration and other key NPD resources looks like.
One may counter that the use of a specific vertical industry (i.e. the South Korean ICT industry here) reduces the contributions of this research with respect to explaining the empirical anomalies in the literature. However, our study can be considered to be representative, as Korea is one of the leading countries in terms of ICT R&D investment and innovation performance. The Korean ICT industry is now not only the driving force behind the economic growth of Korea but also a top-tier industry in terms of technological competence compared to other developed countries (Kim, Yoon, Yoon, and Lee Citation2015). Therefore, considering the Korean ICT industry as representative of the high-tech industry in South Korea is suitable to reach the research objectives of this study.
Consequently, this study can make a number of contributions to the NPD literature and to ongoing academic discussions regarding the effect of integrating R&D and marketing. From a theoretical perspective, this study provides an over-arching explanation of opposing observations in the literature. From a managerial perspective, NPD managers may get a lesson for effective R&D and marketing integration by considering performance criteria and key NPD resources available.
This paper is structured in the following manner. In the next section, we provide an overview about the cause and effect of R&D and marketing integration in NPD processes by referencing previous research. In Section 3, we describe our theoretical framework, the questionnaire used, the data collection process, and the methodology applied. Section 4 presents the empirical analysis results. Based on the empirical findings, we conduct a simulation and present the marginal response function and marginal response surface with respect to R&D and marketing integration in Section 5. In Section 6, the academic and managerial implications are discussed, as are the limitations of the study and possible future research.
2. Theoretical background
Numerous studies have explored the factors affecting NPD success. Of particular interest has been the inter-functional organisation between R&D, production, marketing, and sales, as any lack of communication between these departments can be extremely detrimental to NPD outcomes. In an increasingly competitive environment, individual departments can no longer independently accomplish the task of NPD and increase business performance. In addition to this, due to the complexity of technological innovation, a department by itself can hardly implement the entire process of NPD (Chen, Lee, Wang, and Tong Citation2008; Yao, Xu, Song, Jiang, and Zhang Citation2014). In particular, the integration of and cooperation between R&D and marketing have been identified as an important factor which significantly influences the NPD success (Troy et al. Citation2008). One study (Cooper Citation1983) found that R&D and marketing are interdependent in the process of new product innovation, as the R&D department cannot develop new products that meet consumer needs without market information provided by the marketing department.
In this context, the role of R&D and marketing integration and its impact on NPD success have been attracting attention from researchers across many disciplines over the past few decades. Academics and practitioners have identified commonly used measures of success in their efforts to find the underlying reasons behind NPD success and the effects of integrating R&D and marketing on success at project-level as well as company-level (Griffin and Hauser Citation1996).
The majority of previous studies have empirically shown that the intensive integration of R&D and marketing enhances project performance and the competitiveness of new products (Souder Citation1988; Moenaert et al. Citation1994; Song and Parry Citation1997; Lu and Yang Citation2004; Song and Noh Citation2006). Earlier work (Cooper Citation1994a) investigated NPD success factors based on data conveyed from the international chemical industry, including 21 companies and 103 projects (68 successful projects and 35 failed projects), finding that a cross-functional approach had a positive impact on the profitability of new products. Another study (Cooper and Kleinschmidt Citation1994) also discovered that the cross-functional integration of project team positively influences the time efficiency of tasks.
The underlying advantages of integrating R&D and marketing and why it is so important have also actively been discussed. Inter-functional information transfer, uncertainty reduction, and knowledge creation have all been referred to as positive aspects of integration between different functional teams. Moenaert and Souder (Citation1990) have theoretically illustrated that R&D and marketing integration stimulates information transfers among different functional teams, thus playing a critical role within the process of technological innovation. They said this also reduces the uncertainty faced by each team. Moenaert et al. (Citation1994) empirically found that communication flows between marketing and R&D were increased under the condition of a positive inter-functional climate, which was also positively correlated with the commercial success of new products. In addition, Takeuchi and Nonaka (Citation1986) emphasised knowledge creation through high-level R&D and marketing integration, stating that collaboration between different functional teams is a vehicle for introducing creative, market-driven ideas.
Aside from these merits of integration, a handful of studies have pointed out negative effects of the excessive integration of R&D and marketing. Some said that more intensive integration may not always be a productive approach to enhance the performance of NPD, also arguing that there could be an optimal level of integration (Souder Citation1980; Leenders and Wierenga Citation2008). Particularly, Souder (Citation1980) found that if people from different functional teams have too much regard for each other or are too complacent in their relationships, important information and subtle observations may be overlooked. Therefore, the author argued that achieving an increased level of integration does not always guarantee increased performance. As a continuation of this line of thought, Gupta, Raj, and Wilemon (Citation1986) proposed that a firm should strive for an appropriate level of integration depending on its strategy and its perceived uncertainty of the environment. Additionally they also said that the difference between the level of integration required and the level of integration achieved practically can negatively influence new product innovation. However, researchers who highlighted negative effects of too much integration have failed to show an optimal level of integration empirically for maximising new product performance. In later work, Henard and Szymanski (Citation2001) found, in their meta-analysis, that cross-functional integration issues and new product performance were not significantly correlated, although, on average, increased diversity in functional specialisation may indeed be related to the rate of innovation. Kahn and Mentzer (Citation1998) also contended that intensive interaction activities do not promote company performance, instead overburdening personnel with too many meetings and stress.
The two above-mentioned divergent observations regarding the effects of integrating R&D and marketing on NPD success triggered further studies that aimed to explain these divergent observations in one unified framework. For example, Calantone and Rubera (Citation2012) reported that the effect of integration had only a negative impact on the performance of NPD if firms pursue an explorative innovation programme. Leenders and Wierenga (Citation2008) pointed out, based on survey data conveyed in the pharmaceutical industry, that integration of R&D and marketing need to be considered in conjunction with other NPD resources. Specifically, they found that if a firm has few NPD resources, the effort to pursue high level of integration may yield only modest returns. Brettel, Heinemann, Engelen, and Neubauer (Citation2011), who used efficiency and effectiveness to measure the impact of the integration of R&D and marketing, pointed out that the integration effect depends on the type of innovation (i.e. incremental innovation versus radical innovation).
Most of all, existing studies could not address these issues due to the methodological limitations. As shown in , the vast majority of prior studies assumed a parametric linear model between integration level and NPD success, which is largely motivated by methodological convenience in terms of its model structure and estimation process. However, this parametric model is inherently linked to model misspecification, possibly leading to mixed results. Hence, it was not possible to provide a comprehensive interpretation on R&D and marketing integration impact in one unified framework and previous literature unfortunately suggested confounding outcomes. When confounding outcomes of parametric models make it difficult to draw reliable causal relationships, nonparametric models can be very useful to overcome the limitation caused by parametric approaches.
Table 1: Confounding results on impact of R&D and marketing integration.
In addition to this methodological limitation, the fact that such an integration is embedded in a broad organisational context was often ignored, as any interaction effects between integration level and other NPD resources devoted to the NPD process also remain to be testable. Furthermore, it is not clear how the impact of integration differ depending on the performance criteria (e.g. efficiency and effectiveness). In reality, NPD managers must consider multiple performance objectives. For example, NPD managers not only have to implement new technologies (or technologies that already exist in competing products) into new products, but they also have to complete the project within a given period of time because the on-time release of a new product heavily influences the competitiveness of the new product in the market. Therefore, in this study, we hope to shed some light on this trade-off relationship between multiple success dimensions with respect to R&D and marketing integration.
3. Research design and methodology
3.1. Proposed research framework
In this study, four steps were followed in order to design the theoretical research framework and to reach the research objectives (). First, technological capability, marketing capability, and organisational capability (with their corresponding resources) are identified and included in the research framework. The R&D and marketing integration variable was classified as one of the main effect variables belonging to organisational capability. The integration variable and the other explanatory variables are related to the theoretical model, which postulates that performance is affected by a firm’s resources and capabilities. Second, a questionnaire was used to measure retrospectively the intensity and specialty of resources invested in NPD processes. The questionnaire was also used to capture the degree of success of a new product with respect to different performance criteria. Third, based on the collected data, the nonparametric regression model MARS was applied to estimate the function of covariates and the response variables. Fourth, the estimated regression results were used as input into Monte Carlo simulations in order to graphically illustrate the marginal response function of R&D and marketing integration and to show the marginal response surface with other resources devoted to the NPD process.
Figure 1: Proposed research framework.
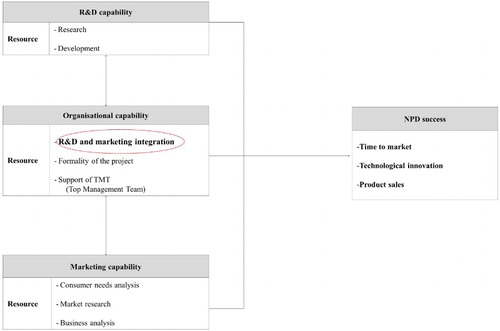
As indicated in , the proposed research framework consists of three NPD capabilities (‘Technological capability’, ‘Marketing capability’, and ‘Organisational capability’) and three different success dimensions (‘Time to market’, ‘Technological innovation’, and ‘Product sales’). Without doubt, technological capability and marketing capability are the most important drivers of successful product development. This has been demonstrated in a number of theoretical and empirical papers (Verona Citation1999; Keller Citation2004; Harmancioglu et al. Citation2009).
Technological capability can be separated into research resources and development resources. Research resources represent the ability to evaluate the technical specifications and preliminary technical assessments of new ideas. In other words, research resources are strongly linked to how much the firm’s own technological assets are utilised in the early stage of the NPD process. Development resources represent the ability to develop prototypes and design final products. In other words, development resources refer to technological proficiency associated with specific technical activities to realise a final product. Developing and testing a prototype require one to concentrate on the functional attributes of the product and involve turning an idea into a high-quality product. Therefore, technological proficiency in the development stage increases the likelihood that the final product has few defects and meets consumer expectations. In this context, Ulrich and Eppinger (Citation1995) reported that technological capability (e.g. knowledge about product architecture, aesthetics, and ergonomics) is the major source of competitiveness of new products.
Marketing capability consists of three different resources in our research framework: a consumer needs analysis, in-depth market research, and an analysis of the competitive environment of new products. Marketing capability is not something that is applied after engineering has developed a new product. Rather, well-developed marketing capability includes a proactive consideration of the external environment (e.g. considering customers in the NPD process). This philosophy reflects the fact that customers and market-based information guide internal decision-making and resolve internal conflicts during the NPD process. For instance, they can help guide technical specifications by identifying consumers’ hidden needs and reflecting them in the product. Marketing capability also helps to determine an appropriate market segment using well-implemented market research techniques (Shim, Kim, and Altmann, Citation2016). It is also possible to identify partners that could play a critical role in the product launch process and to capture a competitor’s strategy. Probert et al. (Citation2013) stated that, during the NPD process, it is necessary to demonstrate a sufficient understanding of potential market opportunities rather than to rely on the current market. Considering these benefits, marketing capability can undoubtedly be considered to be one of the major sources leading to NPD success (Kasprzak and Pelc Citation1978).
Regarding the organisation of NPD, organisational capability is also an important factor affecting a successful NPD outcome. As discussed above, the integration of R&D and marketing is an essential resource and part of what constitutes organisational capability. In addition, the formality of the NPD planning process (i.e. rigorous planning to adhere to the NPD process) and the support of the top management team (TMT) must also be considered as key components constituting organisational capability.
A formal planning process is an imperative resource related to organisational capability. Essentially, a formal planning process refers to a systemic approach for the evaluations of new ideas and the development and market launch of products during the NPD process (Cooper Citation1994b). Such a formal NPD process must be comprehensive and described by logical sequence. Using a formal planning process, leaders formulate their intentions in a written plan and then elaborate on the plan with schedules to guide its implementation. By sharing leader’s intention and plan officially, tasks can be conducted more efficiently.
With respect to the support of TMT, Cooper, Edgett, and Kleinschmidt (Citation2004) proposed that the support of top management through encouragement and risk-taking was one of the key factors affecting NPD success. Specifically, the commitment of top management is critical for the initiation of the NPD project, and this influences the quantity as well as quality of the resources devoted to the NPD project. Therefore, TMT’s will and support is a very critical factor determining success or failure of projects especially given that a firm’s resources are allocated only through the decisions of its top managers (Lee, Lee, and Souder Citation2000). Furthermore, strategic orientation toward new product performance in the high-tech industry is influenced by the TMT support (Chou and Yang Citation2011). Thus, TMT support is included as one of the main components of organisational capability in this study.
To measure the success of a new product, we include three success criteria: ‘Time to market’ as a proxy for project efficiency, ‘Technological innovation’ as a proxy for product effectiveness, and ‘Product sales’ as a proxy for market performance of NPD. The purpose of utilising three different performance criteria is to understand the trade-off effect between different competing NPD performance criteria. This information is essential for NPD managers, who must make strategic decisions about trade-offs while emphasising either efficiency or effectiveness depending on situations (O’Cass, Heirati, and Ngo Citation2014). For instance, the pressure quickly to develop a new product within a given time period has often led to few improvements and a failure to achieve planned technological innovations within the new product. Due to this matter, we will analyse all of these relationships in one unified empirical model, addressing the three different success criteria.
The proposed research framework is guided by the idea of Rubera, Ordanini, and Calantone (Citation2012), who found that the effect of integration depends strictly upon the competence that the firm uses to develop and launch a new product. However, the proposed framework is different from the body of extant studies in a point that this study finds the unbiased effects of resources and capabilities on NPD success by decreasing the likelihood of model misspecifications.
3.2. Questionnaire design and data collection
We used a questionnaire consisting of two parts to collect data. The first part of the questionnaire includes general questions about the firm. This includes the type of firm, the type of product or service developed, the number of employees participating in the project, and the development period.
The second part of the questionnaire focuses on collecting data about the constructs that have been described in proposed research framework (Appendix). Accordingly this part collects data about the resources and capabilities devoted to the NPD process, in which the respondents were actively involved. To measure the intensity of R&D and marketing integration, three items of semantic questions designed by Song and Noh (Citation2006) were adopted. Similarly, we collected data about firm’s resource devoted NPD process using three or four semantic questions in the survey. Besides, all questions were designed to be answered on a seven-point Likert scale.
Questions designed by Atuahene-Gima (Citation1996) and Cooper (Citation1983) were used in the ‘consumer needs analysis’, ‘market research’, and ‘business analysis’ part of the questionnaire, to assess those aspects as they pertain in marketing capability of the firm. The questions on the questionnaire by Tatikonda and Rosenthal (Citation2000) were used to measure the ‘formality of the project’, and the item used to measure the ‘support of the TMT’ was based on work by Swink (Citation2000) and Calantone, Garcia, and Dröge (Citation2003).
The sample was collected through a web-based survey system of the Korean panel survey company ‘Do-It-Survey’ and the Korean job market information company ‘Incruit’. Do-It-Survey is a firm specialising in web-based surveys, and Incruit manages a database on the human resources of Korean ICT firms. Both companies worked together to conduct this survey. A sample of Incruit’s survey panel was asked to participate in this survey. The survey was conducted from March of 2013 to April of 2013. The survey targeted managers or directors who actively participated in and supervised the development of a new and recently introduced product in the ICT industry. Out of the entire sample collected, 21 respondents were removed due to incompleteness of the questionnaire, leaving a final sample of 220 respondents. This sample was used in the empirical analysis.
The characteristics of the firms of the respondents are as follows: 59.1% of the firms are independent companies, whereas 40.9% correspond to companies affiliated with a corporate group; 29.5% of firms are listed on the Korean stock exchange, KOSPI, and 10% are listed on the Korean stock exchange for small and medium sized enterprises, KOSDAQ. The product type includes hardware and devices (20.9%), mobile contents (35.5%), and package software (27.3%). In terms of the number of employees, 28.2% of the firms have fewer than 50 employees, while 45.9% have more than 300 employees.
The characteristics of the respondents are as follows. Regarding the background related to their department, 64.5% of the respondents belonged to R&D department and 35.5% worked in a business department. In detail, 25.5% belong to the marketing department and 10% belong to the sales department or the communication department. The majority of those respondents are senior managers (83.7%), followed by directors (10.5%) and CEOs (5.8%). During the data collection process, we excluded general staff or research staff in order to guarantee the reliability of the responses to the survey.
shows the descriptive statistics of the research variables. The mean of all variables, except for the variable ‘Research Resource’, is between 4 and 5 (i.e. between ‘good’ and ‘relatively good’ on the Likert scale). The variable ‘Research Resource’ has the highest value (greater than 5), while its variance is the lowest. It is also interesting that the mean of the variable ‘Time to market’ is the lowest, while the variance of ‘Product sales’ is the highest. These findings indicate that the NPD teams show a relatively low performance in their efforts to deliver the final product on time, whereas they show a high performance in sales.
Table 2: Descriptive statistics of variables.
also shows Cronbach’s alpha values for each variable in the research model. The alpha values were used to check the reliability of multiple survey questions, which were chosen to measure the same construct. Since alpha values are high, it can be concluded that the collected answers through multiple questions have high internal consistency.
3.3. Methodology: MARS
MARS has been developed by Friedman (Citation1991). It finds a nonlinear flexible function without any functional assumptions, using smoothing splines to fit the relationships between a set of independent variables and a response variable. In other words, this methodology allows obtaining a very smooth line that can capture shifts in the relationships between variables. MARS only requires curve segments, in which these shifts occur, to be continuous. The locations of such segments are designated as ‘knots’.
Following the MARS algorithm, in the first stage, MARS builds a collection of basis functions. Basis functions are transformations of independent variables taking into account nonlinearities and interactions between independent variables in the model. That means basis functions can be highly nonlinear transformations of independent variables. The response variable
, however, is a linear function of the basis functions. In the second stage, MARS estimates a least-square model with its basis functions as independent variables (Deichmann, Eshghi, Haughton, Sayek, and Teebagy Citation2002).
For detailing the methodological framework, we consider here the following MARS model form:(1) where
is the number of basis functions, and
represents a set of candidate explanatory variables. With respect to our research framework, X is the set of independent variables (e.g. ‘R&D and Marketing Integration’).
denotes the m-th basis (spline) function. It is a hinge function that makes it possible to model separate effects on the dependent variable through a piecewise domain of independent variables. In other words,
is represented by either
, in which t is the location of the knot. It should be noted that
is a piecewise linear function with respect to the basis functions. Basis functions themselves are highly nonlinear transformations of
, so that the model can express any functional relationships. In addition to this, significant interaction effects among explanatory variables can be captured as a form of hyper-planes and represented by multiplication of basis functions of a single variable. Lastly,
are the estimated spline coefficients, corresponding to the basis functions
, which are chosen by minimising the sum of squared residuals for a given model.
By specifying the structure of basis functions, our MARS model can be represented in more detail as follows:(2) where
is the number of knots,
takes on values of either 1 or −1, indicating the right or left side of the associated step function,
is the label of the independent variable, and
indicates the knot location. The product over all knots Km represents the basis function hm(X) in Equation (1).
Following the MARS estimation procedure, our MARS model is estimated in a two-stage procedure. In the forward step, MARS constructs a very large number of basis functions to over fit the data initially, where variables are allowed to enter as continuous, categorical, or ordinal. After the forward step (i.e. after an iteration of times), the MARS model
is a sequence of at most
−1 basis functions.
In the backward step, basis functions are deleted in the order of least contributions using the generalised cross-validation (GCV) criterion. The importance of a variable can be assessed by observing the decrease in the calculated GCV value due to the removal of a variable from the model. The GCV can be expressed as follows:(3) where
represents the number of observations, and
is the cost penalty measure of a model containing
basis functions. The numerator
measures the lack of fit on the
basis function model
, and the denominator denotes the penalty for the model complexity
.
In summary, MARS uses piecewise linear functions for local fit and apply an adaptive procedure to select the number and location of breaking points called knots. The function estimation is basically generated via a two stepwise procedure: forward selection and backward elimination. In the first forward step, a large number of local fits is obtained by selecting large number of knots via a lack-of-fit criteria; and in the latter backward one, the least contributing local fits or knots are removed.
Concluding, the advantage of the MARS approach lies in its ability to implement the basis functions so that both the additive and the interactive effects of independent variables can impact the response variable. Consequently, the MARS method generates a continuous regression model with continuous derivatives and has the capability and flexibility to model relationships that are additive or have interactions (Steinberg and Colla Citation1999; Deichmann et al. Citation2002). By allowing any arbitrary shape for the functions and any interactions, and by using the above-mentioned two-stage model testing procedure, MARS can reveal very complex data relations that often hide in high-dimensional data. Therefore, the MARS model highly suits our research objectives of observing change of marginal impact of R&D and marketing integration, as well as finding marginal response function with respect to R&D and marketing integration (Lee and Chen Citation2005).
4. MARS model result
4.1. Model selection and validity
Three different MARS models were estimated with our data set by allowing different number of interactions between basis functions. In order to select the best fitting model, the Likelihood-Ratio (LR) test was adopted to statistically compare goodness of fit between estimated models having a different number of interactions of splines and to find the best model in accord with the given data. As a lower interaction model is nested into a higher one, we applied the LR-test (), in which the lower interaction model is represented as the null hypothesis and the higher interaction model is represented as the alternative hypothesis. The LR-test does not reject the null hypothesis, if the value of test statistics following chi-square is too small.
Table 3: LR-test of estimated models.
Explained earlier, we estimated three different models, ranging from the main effect only model to the main effect with three-way interaction model. With these three models, we assessed which model is most suited to our data set using the LR-test. We found that the two LR-tests statistics reject the null hypotheses, which demonstrates that the high interaction model is superior to explain our empirical data. In detail, shows that the main effect with three-way interaction model is preferred compared to the other two models. It is preferred, as it is superior to the main effect model with two-way interaction model, and as the main effect model with two-way interaction model is superior to the main effect model.
The Akaika Information Criterion (AIC) and Bayesian Information Criterion (BIC) were also used to compare the model fit ().
Table 4: Comparison of AIC and BIC between models.
shows that the AIC and BIC values of the main effect with three-way interaction model is lowest among the three different models. This also confirms the superiority of the main effect with three-way interaction model over the other two models. Note that we also tested the main effect with four-way interaction model. But estimation result of the main effect with four-way interaction model is identical to the one of the main effect with three-way interaction model, meaning that there is no significant four-way interaction term. Consequently, the results decisively show that the main effect with three-way interaction model is best-fitted to our data. Therefore, we adopted the main effect with three-way interaction model and discuss the estimation results with that model hereafter.
To check the validity of the nonparametric regression model over the corresponding parametric linear regression models, we compare the model fit between the nonparametric MARS regression model and the parametric linear regression models using LR-test (). To do this, the same covariates (i.e. the basis function as given in ) are selected for both models. The only difference between the models was that the nonparametric MARS model included the knot configurations that reflect the discontinuous effects of the selected covariates while parametric linear regression model did not.
Table 5: LR-test of parametric linear regression model and nonparametric MARS model.
shows that the LR-test rejects the null hypothesis (i.e. the parametric linear regression model), statistically supporting that the MARS model better explains the collected data in this study. We also compared the adjusted R-square values of both models. illustrates that the adjusted R-squares of MARS are higher than the adjusted R-squares of the parametric model for each response variable. Therefore, we can conclude that the MARS model is decisively preferred to a parametric linear regression model.
Table 6: Comparison of adjusted R-square between parametric model and nonparametric MARS model.
4.2. Result analysis
Before discussing the estimation results, it should be noted that we tried to achieve homogeneity of our data. First, we restricted our analysis to product level or project level activities in the Korean ICT industry, and did not consider firm level activities or the firm level performance. Consequently, we expected only a little possibility of heterogeneity. Nonetheless, as a few prior works in NPD research utilised control variables to detect heterogeneity, we also included three control variables, to guarantee homogeneity of the sample data and to ensure the reliability of analysis result. As product-level control variables, the number of NPD team members (NPD_Size) and the product type (NPD_Type) were selected. As a firm level control variable, the number of employees of the corresponding firm (Firm_Size) was selected. NPD_Size is a continuous variable representing the number of people, who officially participated in the NPD team. NPD_Type is a binary variable, in which 1 represents a hardware-and-device-related product and 0 represents a software-and-contents-related product. Finally, Firm_Size is a categorical variable, where 1 indicates firms with less than 50 employees, 2 indicates firms with 50–300 employees, and 3 indicates firms with more than 300 employees. The estimation result of the control variables showed that only the NPD_Type variable is significant and the other variables are insignificant.
The regression results, as shown in , depict some interesting results. First, we found a nonlinear effect of R&D and marketing integration on NPD success. The fact that the knot of the R&D and marketing integration variable was found to be significant implies that the relationship between the integration of R&D and marketing and the NPD success is not linear but nonlinear. The effect of R&D and marketing integration on every performance criteria is positive, only if the integration is larger than 4.75 (basis function: Max(0, RMI-4.75) of ). Therefore, we can state that the answer to the first research question is that impact of integrating R&D and marketing is not deterministic, rather dynamic.
Table 7: Regression result: knot configuration and spline coefficients.
Second, the amount of development resources devoted to the NPD process impacts the interaction effect between the R&D and marketing integration and the NPD success (basis function Max(0, 6-DEV) * Max(0, RMI-6) of ). The fact that the interaction effect between the R&D and marketing integration and the amount of development resources was captured is noteworthy, as it validates that the level of integration is influenced by the amount of available R&D resources allocated to the NPD project. In particular, among multiple technological and marketing resources that we explicitly considered in the model framework, development resources were found to have a significant interaction effect with R&D and marketing integration. This supports our second research question about whether the impact of integration is affected by the amount of R&D resources.
Furthermore, with respect to the second research question, the estimation result also shows that there is a significant interaction effect between project formality and R&D and marketing integration (basis function Max(0, 6-DEV) * Max(0, FOR-3) * Max(0, 6-RMI) of ). If both the level of integration and the development resources are lower than 6, an increase in the level of formality delays the time to market and hampers the technological innovation of new products, consequently leading to a deterioration of profitability. This shows that an excessive pursuit of project formality without collaboration of R&D and marketing and sufficient R&D resources results in a poor NPD outcome. Therefore, we can also state that the second research question has a positive answer. Accordingly, it opens up the possibility that an optimal configuration between resources and integration might exist.
In conclusion, the MARS algorithm successfully found three main effects and seven interactions (), using statistical optimisation on a recursive partitioning tree, which did not require an a priori parametric model specification. Therefore, our estimation results give a more comprehensive interpretation about the main effect as well as interaction effect regarding impact of R&D and marketing integration.
5. Monte Carlo simulation
With only spline coefficients and knot configuration of the regression results, we face a limitation in understanding the marginal effect of R&D and marketing integration. In order to overcome this limitation and to able to answer the third research question, we conducted simulations. The aim of the simulation is to visualise how the integration effect changes based on the estimated regression results.
Monte Carlo simulation helps controlling variables that are not the focus of the analysis. In detail, for the simulation, three steps were executed. First, the range of the main variable RMI, which is between 1 and 7, has been divided into 61 intervals. Second, in order to understand the relationship between RMI and NPD success in detail, we control the effects of all other independent variables (i.e. all independent variables except for RMI). For controlling the effect of the other independent variables, 10,000 data sets were generated by drawing random values for all the independent variables from uniform distribution in the range between 1 and 7 (i.e. the potential values of the independent variables). Third, the marginal effects of the variable RMI on the three NPD success variables for each of the 61 intervals was calculated by averaging the spline function value for the 10,000 data sets. The simulation results for each of the NPD success factors are illustrated in .
Figure 2: Marginal response functions for time to market, technological innovation, and product sales with respect to R&D and marketing integration.
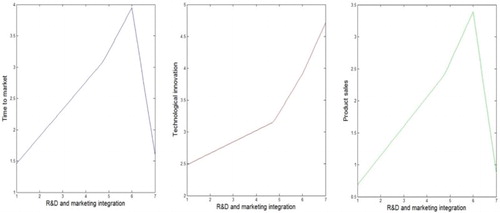
shows a few interesting simulation results. First, meeting our expectation, the intensity of R&D and marketing integration has a nonlinear impact on time to market, technological innovation, and product sales. Particularly, the effect of integration on technological innovation dramatically grows after it exceeds the middle point of the integration level. It indicates that the ‘more is better’ strategy holds for the technological innovation dimension. For time to market and product sales, however, the impact becomes saturated and eventually drops at the intensive integration area which means that too much integration hampers NPD outcomes in time to market domain and product sales domain.
Concluding, we found that the R&D and marketing integration effect depends on the performance criteria considered. A persuasive interpretation of these results is that an intensive integration of R&D and marketing may seem to be successful from the perspective of an organisation if managers do not know consumer responses to new products in the market yet. Although an intensive integration also contributes to technological innovation, it deteriorates market performance by delaying time to market of the new product. This may be an answer to the important managerial question about what the best R&D and marketing integration strategy for NPD success is.
In addition to this, it might be necessary for NPD team managers to pay attention to the joint effect between R&D and marketing integration and other NPD resources devoted to the NPD process. shows the marginal response surface of level of R&D and marking integration and the amount of development resources.
Figure 3: Marginal response surface for ‘Time to market’, ‘Technological innovation’, and ‘Product sales’ with respect to R&D and marketing integration and development resource.
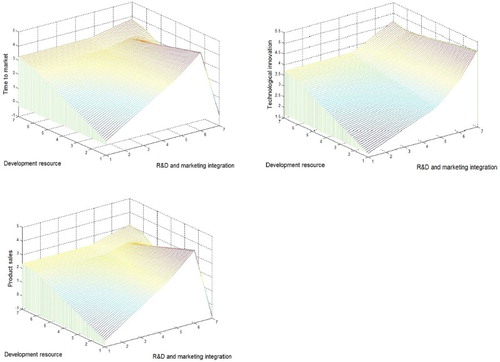
shows how development resources moderate the relationship between R&D and marketing integration and NPD success. If the development resources are sufficient, the impact of R&D and marketing integration on time to market, technological innovation, and product sales show a peak at a value of 7. It makes no odds to performance whether integration level is low or high. If the development resources are little, the impact of integration shows significant difference in time to market, technological innovation, and product sales. The results show that R&D and marketing integration has a bigger impact on NPD success, if the NPD team has little R&D resources available. This fact implies that integrating R&D and marketing operates as a leverage effect in NPD process by maximising the value of scarce development resources.
To suggest the rational reasons for that, we need to remember the practical role of R&D and marketing integration in NPD processes. R&D and marketing integration reduces uncertainty for the NPD team and generates innovative ideas in principle by information sharing. In this mechanism, R&D and marketing integration is more conducive to the use of the information. In other words, R&D and marketing update their market and technological information through integration. The R&D team can take information about consumer needs into consideration during the development process. The marketing team can utilise the technological information to establish marketing plans. This way, information sharing is an important factor for successful implementation of marketing plans and profit improvements. This results coincide with a previous finding by Leenders and Wierenga (Citation2008), who argued that integration of R&D with marketing need to be considered in conjunction with the variety and intensity of NPD resources devoted to the NPD process. Our finding goes way beyond the model of Leenders and Wierenga, as our proposed model is able to explicitly identify the optimal level of integration that maximises the NPD performance.
To go through the main points again, if a firm does not have enough skilful technicians or scientists and knowledge, which is required to turn ideas into feasible products, then technical information cannot be conveyed to the marketing people through the process of R&D-marketing integration. For example, without enough technological capability, a marketing department cannot educate consumers about a new product and, finally, cannot increase revenue. Accordingly, the efforts to attain intensive R&D and marketing integration lead to poor performance in the market under the situation where technological capability is insufficient. However, if a firm has enough technological experience in dealing with similar products then activities related to R&D and marketing integration stimulate the performance of new product developments.
6. Discussion and conclusion
6.1. Implication
The integration of R&D and marketing is a highly complex phenomenon in an organisation, especially considering the performance criteria, the variety of resources, and the intensity of resources devoted to the NPD process. In this point, this study is the first empirical examination to address the marginal impact of integration between R&D and marketing. Hence, the study provides an over-arching explanation of the findings of earlier studies which appear to be contradictory with regard to our findings. Most of those studies showed either only positive effects of integration or negative effects of excessive integration. The findings of our study empirically support not only a positive or negative impact of integration but also show that both outcomes can occur within the same context. In particular, our results show that integration has a different impact depending on the NPD performance criteria. In terms of the time to market and product sales criteria, it was found that an optimal level of integration between R&D and marketing exists. Moreover, in terms of technological innovation, we found that stronger integration leads to more success. The results also reveal that the effect of R&D and marketing integration can be moderated by the quality and quantity of the resources devoted to the NPD process. Consequently, the results of this study have three important implications.
First, using a nonparametric regression method with a fairly large sample at the project level, it was possible to empirically estimate the unbiased impact of integrating R&D and marketing and to visualise its impact. Given that the integration effect becomes saturated and ultimately hinder NPD success in time to market and product sales, we can conclude that prior empirical studies of cross-functional integration ignored an important aspect of NPD by assuming a linear relationship between integration and NPD success. In particular, the findings of this study indicate that the effects of integration are diverse. Therefore, the realised level of integration should receive distinctive attention in further NPD research.
Second, our analysis produced mixed findings depending on performance criteria which are connected to vital managerial questions, such as which aspects of NPD outcomes should be emphasised. Particularly, when technological innovation is a performance criterion, the impact of R&D and marketing integration continues to increase without reaching a peak point. This result supports the findings of Souder and Chakrabarti (Citation1978), who found that the interface between R&D and marketing stimulates technological innovation. However, when time to market and product sales are the performance criteria, the impact of integration is gradually diminishing. In consequence, managers must not only support the integration of different functional teams but also must limit the excessive interaction between R&D and marketing. Only then can managers achieve the multiple objectives of delivering new products on time, encouraging technological innovation and improving product sales. Furthermore, the graphical findings illustrate that completing projects on time is more closely linked to product sales than technological innovation. To understand this in more detail, further research is required to uncover the underlying reasons. It will be interesting to determine why the time to market performance shows a pattern more similar to that of product sales than technological innovation in terms of R&D and marketing integration.
Third, we showed that the amount of development resources devoted to the NPD team moderates the effect of integration on NPD success. The main managerial implication of this finding is that managers should not automatically determine the level of integration of R&D and marketing. Instead, the decision regarding integration level should consider the available technological resources. For example, if managers consider a firm with sufficient development resources that is willing to develop a new product, then they should strive to attain a high level of integration of R&D and marketing to increase the possibility of NPD success. In contrast, a firm with moderate development resources can be successful only if managers manipulate the optimal level of integration during a project. Too much integration slows the process, mainly because R&D must consider marketing’s opinions and insights and cannot focus solely on product development. Hence, we can conclude that the amount of resources available to the NPD team determines the optimal level of integration between R&D and marketing.
6.2. Limitations of study and outlook
The main limitation of this research stems from the definition of the R&D and marketing integration variable. Similar to other NPD studies, the manner in which the variables are measured depends on the operational definitions and corresponding survey questions. Although we defined the concept of R&D and marketing integration based on the previous literature, no study could be found which developed objective indicators which could be used to measure the integration level. If it was also possible to measure, for instance, the number of meetings or the meeting hours per week between R&D and marketing personnel, the validity of the measurement on R&D and marketing integration would have been increased. Future research must carefully address this limitation.
Following the approaches that were applied in previous NPD studies, this study also depended on a survey to collect data, though this method is somewhat affected by the subjective beliefs of the respondents. The retrospective nature of the data collection process constitutes limitation, raising the possibility that memories of the respondents were incomplete and might be coloured by the known success or failure of a project. Additionally, we targeted C-level managers or NPD team leaders as the respondents of the survey in this study, since they were more likely to fully understand the whole NPD process and detailed allocation of variety resources in NPD team. However, one may appeal that executives are more pressured to answer the survey questions in more positive tone, more than team members because they are responsible for the outcomes of their projects. This is also one of the unavoidable limitations, since it is practically difficult to obtain multiple response from the same project team. This limitation could be partly addressed by a longitudinal data collection, assessing R&D and marketing integration and other NPD resources at various points during the whole NPD cycle. Unfortunately, this approach would increase cost of the study dramatically and inevitably reduce participation rates because NPD team leaders are unwilling to reveal their process to external interviewers. Nevertheless, such a methodology remains an ambitious goal for future research.
Another limitation of this research is its generalizability, given that the sample was only drawn from those involved in ICT products. Although the ICT industry is a fairly typical example of a high-tech industry, there is the likelihood that a large part of variation takes place across industries. Specifically, in low-tech industries, the causes and effects pertaining to the integration of R&D and marketing may take on new aspects. Therefore, further research is needed to examine the impact of integration in other industries. In this regard, a direction of future research could be to compare the marginal effect of R&D and marketing integration across industries or across nations.
We expect that examining the underlying mechanism that influences integration activity can be an important next step. In other words, future research topic can include the following questions: what makes managers integrate R&D and marketing people during NPD processes or what problems do they face when the realised integration does not reach the optimal level. These questions suggest that more can be learned about R&D and marketing integration in the NPD context.
Finally, our study found that the significant interaction between development resource and the consumer needs analysis resource: (Max(0, DEV-6) * Max(0, CON-6)) has stronger effects on the three NPD performance criteria. This finding implies that observing not only the impact of the integration of R&D and marketing at the organisational level but also the impact of the interaction of physical R&D and marketing resources may be a potential stream of further research. That is, no coordination at organisational level but combination between physical R&D resources and marketing resources to maximise NPD performance will be a highly meaningful future research area in relation to NPD if they are measured objectively.
ORCID
Dongnyok Shim http://orcid.org/0000-0003-1406-9984
Additional information
Funding
References
- Atuahene-Gima, K. (1996), ‘Market orientation and innovation’, Journal of Business Research, 35, 93–103. doi: 10.1016/0148-2963(95)00051-8
- Bayus, B.L. (1997), ‘Speed-to-market and new product performance trade-offs’, Journal of Product Innovation Management, 14, 485–497. doi: 10.1016/S0737-6782(97)00062-3
- Brettel, M., Heinemann, F., Engelen, A., and Neubauer, S. (2011), ‘Cross-functional integration of R&D, marketing, and manufacturing in radical and incremental product innovations and its effects on project effectiveness and efficiency’, Journal of Product Innovation Management, 28, 251–269. doi: 10.1111/j.1540-5885.2011.00795.x
- Calantone, R.J., and di Benedetto, C.A. (1988), ‘An integrative model of the new product development process: an empirical validation’, Journal of Product Innovation Management, 5, 201–215. doi: 10.1016/0737-6782(88)90023-9
- Calantone, R., and Rubera, G. (2012), ‘When should RD&E and marketing collaborate? The moderating role of exploration–exploitation and environmental uncertainty’, Journal of Product Innovation Management, 29, 144–157. doi: 10.1111/j.1540-5885.2011.00884.x
- Calantone, R.J., Schmidt, J.B., and Benedetto, C.A. (1997), ‘New product activities and performance: the moderating role of environmental hostility’, Journal of Product Innovation Management, 14, 179–189. doi: 10.1111/1540-5885.1430179
- Calantone, R., Garcia, R., and Dröge, C. (2003), ‘The effects of environmental turbulence on new product development strategy planning’, Journal of Product Innovation Management, 20, 90–103. doi: 10.1111/1540-5885.2002003
- Chen, H.H., Lee, A.H.I., Wang, H.-Z., and Tong, Y. (2008), ‘Operating NPD innovatively with different technologies under a variant social environment’, Technological Forecasting and Social Change, 75, 385–404. doi: 10.1016/j.techfore.2007.02.012
- Chou, C., and Yang, K.-P. (2011), ‘The interaction effect of strategic orientations on new product performance in the high-tech industry: a nonlinear model’, Technological Forecasting and Social Change, 78, 63–74. doi: 10.1016/j.techfore.2010.07.018
- Cooper, R.G. (1983), ‘The impact of new product strategies’, Industrial Marketing Management, 12, 243–256. doi: 10.1016/S0019-8501(83)80004-2
- Cooper, R.G. (1994a). Debunking the myths of new product development. Research Technology Management, 37, 40–50.
- Cooper, R.G. (1994b), ‘Perspective third-generation new product processes’, Journal of Product Innovation Management, 11, 3–14. doi: 10.1016/0737-6782(94)90115-5
- Cooper, R.G., and Kleinschmidt, E.J. (1994), ‘Determinants of timeliness in product development’, Journal of Product Innovation Management, 11, 381–396. doi: 10.1016/0737-6782(94)90028-0
- Cooper, R.G., Edgett, S.J., and Kleinschmidt, E.J. (2004), ‘Benchmarking best NPD practices–II’, Research Technology Management, 47, 50–59.
- Deichmann, J., Eshghi, A., Haughton, D., Sayek, S., and Teebagy, N. (2002), ‘Application of multiple adaptive regression splines (MARS) in direct response modeling’, Journal of Interactive Marketing, 16, 15–27. doi: 10.1002/dir.10040
- Ernst, H. (2002), ‘Success factors of new product development: a review of the empirical literature’, International Journal of Management Reviews, 4, 1–40. doi: 10.1111/1468-2370.00075
- Friedman, J.H. (1991), ‘Multivariate adaptive regression splines’, The Annals of Statistics, 19, 1–67. doi: 10.1214/aos/1176347963
- Griffin, A., and Hauser, J.R. (1996), ‘Integrating R&D and marketing: a review and analysis of the literature’, Journal of Product Innovation Management, 13, 191–215. doi: 10.1111/1540-5885.1330191
- Gupta, A.K., Raj, S.P., and Wilemon, D. (1986), ‘A model for studying R&D. Marketing interface in the product innovation process’, Journal of Marketing, 50, 7–17. doi: 10.2307/1251596
- Harmancioglu, N., Droge, C., and Calantone, R.J. (2009), ‘Strategic fit to resources versus NPD execution proficiencies: what are their roles in determining success?’, Journal of the Academy of Marketing Science, 37, 266–282. doi: 10.1007/s11747-008-0125-x
- Henard, D.H., and Szymanski, D.M. (2001), ‘Why some new products are more successful than others’, Journal of Marketing Research, 38, 362–375. doi: 10.1509/jmkr.38.3.362.18861
- Kahn, K.B., and Mentzer, J.T. (1998), ‘Marketing’s integration with other departments’, Journal of Business Research, 42, 53–62. doi: 10.1016/S0148-2963(97)00068-4
- Kasprzak, W., and Pelc, K. (1978), ‘Analysis of human needs as a basis for research policy’, Technological Forecasting and Social Change, 12, 135–143. doi: 10.1016/0040-1625(78)90049-5
- Keller, R.T. (2004), ‘A resource-based study of new product development: predicting five-year later commercial success and speed to market’, International Journal of Innovation Management, 8, 243–260. doi: 10.1142/S1363919604001040
- Kim, J., Yoon, B., Yoon, J., and Lee, S. (2015), ‘Characteristics of new product development activities in SMEs: an empirical analysis of the Korean IT sector’, Asian Journal of Technology Innovation, 23, 1–25. doi: 10.7545/ajip.2015.4.1.001
- Lee, T.-S., and Chen, I.F. (2005), ‘A two-stage hybrid credit scoring model using artificial neural networks and multivariate adaptive regression splines’, Expert Systems with Applications, 28, 743–752. doi: 10.1016/j.eswa.2004.12.031
- Lee, J., Lee, J., and Souder, W.E. (2000), ‘Differences of organizational characteristics in new product development: cross-cultural comparison of Korea and the US’, Technovation, 20, 497–508. doi: 10.1016/S0166-4972(99)00169-8
- Leenders, M.A.A.M., and Wierenga, B. (2008), ‘The effect of the marketing–RD interface on new product performance: the critical role of resources and scope’, International Journal of Research in Marketing, 25, 56–68. doi: 10.1016/j.ijresmar.2007.09.006
- Lu, L.Y.Y., and Yang, C. (2004), ‘The R&D and marketing cooperation across new product development stages: an empirical study of Taiwan’s IT industry’, Industrial Marketing Management, 33, 593–605. doi: 10.1016/j.indmarman.2003.11.002
- Moenaert, R.K., and Souder, W.E. (1990), ‘An information transfer model for integrating marketing and R&D personnel in new product development projects’, Journal of Product Innovation Management, 7, 91–107. doi: 10.1016/0737-6782(90)90052-G
- Moenaert, R.K., Souder, W.E., De Meyer, A., and Deschoolmeester, D. (1994), ‘R&D-marketing integration mechanisms, communication flows, and innovation success’, Journal of Product Innovation Management, 11, 31–45. doi: 10.1016/0737-6782(94)90117-1
- O’Cass, A., Heirati, N., and Ngo, L.V. (2014), ‘Achieving new product success via the synchronization of exploration and exploitation across multiple levels and functional areas’, Industrial Marketing Management, 43, 862–872. doi: 10.1016/j.indmarman.2014.04.015
- Probert, D., Dissel, M., Farrukh, C., Mortara, L., Thorn, V., and Phaal, R. (2013), ‘The process of making the business case for technology: a sales and marketing perspective for technologists’, Technological Forecasting and Social Change, 80, 1129–1139. doi: 10.1016/j.techfore.2012.07.010
- Rubera, G., Ordanini, A., and Calantone, R. (2012), ‘Whether to integrate R&D and marketing: the effect of firm competence’, Journal of Product Innovation Management, 29, 766–783. doi: 10.1111/j.1540-5885.2012.00936.x
- Sethi, R., Smith, D.C., and Park, C.W. (2001), ‘Cross-functional product development teams, creativity, and the innovativeness of new consumer products’, Journal of Marketing Research, 38, 73–85. doi: 10.1509/jmkr.38.1.73.18833
- Shim, D., Kim, J. G., and Altmann, J. (2016), ‘Identifying key drivers and bottlenecks in the adoption of E-book readers in Korea’, Telematics and Informatics, 33, 860–871. doi: 10.1016/j.tele.2015.12.009
- Song, M., and Noh, J. (2006), ‘Best new product development and management practices in the Korean high-tech industry’, Industrial Marketing Management, 35, 262–278. doi: 10.1016/j.indmarman.2005.04.007
- Song, X.M., Montoya-Weiss, M.M., and Schmidt, J.B. (1997), ‘Antecedents and consequences of cross-functional cooperation: a comparison of R&D, manufacturing, and marketing perspectives’, Journal of Product Innovation Management, 14, 35–47. doi: 10.1111/1540-5885.1410035
- Song, X.M., and Parry, M.E. (1997), ‘The determinants of Japanese new product successes’, Journal of Marketing Research, 34, 64–76. doi: 10.2307/3152065
- Souder, W.E. (1980), ‘Promoting an effective R&D/marketing interface’, Research Management, 23, 10–15.
- Souder, W.E. (1988), ‘Managing relations between R&D and marketing in new product development projects’, Journal of Product Innovation Management, 5, 6–19. doi: 10.1016/0737-6782(88)90029-X
- Souder, W.E., and Chakrabarti, A.K. (1978), ‘The R&D/marketing interface: results from an empirical study of innovation projects’, IEEE Transactions on Engineering Management, 4, 88–93. doi: 10.1109/TEM.1978.6447302
- Steinberg, D., and Colla, P. (1999), MARS: An Introduction, San Diego, CA: Salford Systems.
- Swink, M. (2000), ‘Technological innovativeness as a moderator of new product design integration and top management support’, Journal of Product Innovation Management, 17, 208–220. doi: 10.1016/S0737-6782(00)00040-0
- Takeuchi, H., and Nonaka, I. (1986), ‘The new new product development game’, Harvard Business Review, 64, 137–146.
- Tatikonda, M.V., and Rosenthal, S.R. (2000), ‘Successful execution of product development projects: Balancing firmness and flexibility in the innovation process’, Journal of Operations Management, 18, 401–425. doi: 10.1016/S0272-6963(00)00028-0
- Troy, L.C., Hirunyawipada, T., and Paswan, A.K. (2008), ‘Cross-functional integration and new product success: an empirical investigation of the findings’, Journal of Marketing, 72, 132–146. doi: 10.1509/jmkg.72.6.132
- Ulrich, K.T., and Eppinger, S.D. (1995), Product Design and Development. New York: McGraw-Hill.
- Verona, G. (1999), ‘A resource-based view of product development’, Academy of Management Review, 24, 132–142.
- Yao, Q., Xu, M., Song, H., Jiang, W., and Zhang, Y. (2014), ‘R&D-marketing integration and performance—evidence provided by agricultural science and technology enterprises’, Journal of Service Science and Management, 7, 18–29. doi: 10.4236/jssm.2014.71003