
ABSTRACT
An active actin dynamic is a crucial feature of brain microglia. Here we report that LRRK2, a primary familial Parkinson’s disease-associated gene, negatively regulates microglia’s actin dynamics. LRRK2 depolymerized filamentous actin (F-actin) by directly binding to it or inhibiting microglia’s Rac-PAK signaling. LRRK2 knockdown resulted in a reduced ruffle and enhanced lamellipodia formation of ADP-activated microglia, altering the microglia’s physiological activity to vigorous migration toward damaged cells. These results suggest that LRRK2 is a negative regulator for the controlled actin dynamics in microglia.
Introduction
Leucine-rich repeat kinase 2 (LRRK2) is an autosomal dominant gene, typical of late-onset familial Parkinson's disease (PD) (Healy et al. Citation2008). Its importance in PD has been emphasized by multiple genome-wide association studies in large cohorts showing that mutations in LRRK2 are closely linked to the risk of sporadic PD (International Parkinson Disease Genomics et al. Citation2011). Like other causative genes of neurodegenerative disorders, LRRK2 studies have focused on dopaminergic neurons and their correlation with the other causative factors of PD (Nam et al. Citation2021). However, most LRRK2 transgenic mice have shown limited age-dependent degeneration of dopaminergic neurons, suggesting that indirect factor(s), such as neuroinflammation, may initiate the pathogenesis of PD (Lee et al. Citation2017; Dawson et al. Citation2018; Joe et al. Citation2018 ). Similarly, various lines of evidence support that LRRK2 mediates neuroinflammation in various immune cell types, including the microglia of brain-resident macrophages (Tong et al. Citation2009; Li et al. Citation2010; Gao and Hong Citation2011; Gillardon et al. Citation2012; Kim et al. Citation2012; Moehle et al. Citation2012; Ho et al. Citation2019 ).
Microglia, the leading actor of neuroinflammation, is the most motile cell type in the brain, continuously surveying the brain microenvironment by active actin remodeling (Nimmerjahn et al. Citation2005). Excessive actin dynamics were described in vivo in activated microglia after stimulation with extracellular ATP/ADP at the site of a brain microdamage, leading to rapid elongation of its processes toward the release site (Davalos et al. Citation2005; Haynes et al. Citation2006). Similarly, the active actin architectures of membrane ruffles and lamellipodia were observed a few min after ATP/ADP treatment in vitro in isolated primary rodent microglia, showing that the in vivo microglia actin dynamics initiated by ATP/ADP treatment can be mimicked in in vitro (Honda et al. Citation2001).
Several biochemical studies revealed that LRRK2’s intracellular functions are closely related to actin, as shown by LRRK2’s binding activity to actin itself and actin-associated protein subunit (Parisiadou et al. Citation2009; Chan et al. Citation2011; Kicka et al. Citation2011; Meixner et al. Citation2011; Choi et al. Citation2015; Moehle et al. Citation2015). Accordingly, a pathogenic mutant LRRK2 inhibits neurite outgrowth by modulation its effect on actin dynamics (Parisiadou et al. Citation2009; Chan et al. Citation2011). However, the roles of LRRK2 in microglia actin dynamics have been partly investigated despite its active actin polymerization activity in the brain (Nimmerjahn et al. Citation2005; Choi et al. Citation2015). Therefore, to close the gap between biochemical and neurological studies, we examined the role of LRRK2 in microglia actin dynamics.
Materials and methods
Cell culture
All animal procedures were approved by the Ajou University Institutional Animal Experimentation Committee. Primary rat microglia were obtained from mixed glial cultures generated from the cerebral cortices of 1-day-old Sprague Dawley rats (Samtako, Korea) as described previously (Kim et al. Citation2011). Briefly, the cortices were carefully isolated and dissociated into single cells using Pasteur pipettes in a minimal essential medium (Hyclone, USA) containing 10 mM HEPES (pH 7.4), 2 mM L-glutamine, penicillin/streptomycin (P/S, 100 U/mL), and 10% (v/v) FBS (Hyclone, USA), and plated into 75 cm2 T-flasks (half a hemisphere in each flask) in the same culture medium. After two weeks, floating microglia were detached from flasks by gentle shaking and filtered through a nylon mesh (40 μm pore size, SPL, Korea). Microglia were counted and plated into culture vessels (4 × 10⁴ cells/cm2). Pure microglia (isolectin B4-positive, > 90%) were subsequently used for the experiments. Primary mixed mouse glia was isolated from 1-day-old cerebral cortices of C57/BL6 mice. Dissociated cells (a hemisphere in each flask) were cultured in DMEM (Hyclone, USA) containing 10 mM HEPES (pH 7.4), 2 mM L-glutamine, P/S (100 U/mL), and 10% (v/v) FBS. As mouse glial culture does not generate a floating microglia population, the confluent mixed mouse glia subculture was used for a scratch assay after 2 weeks of culture. The murine microglia cell line BV2 was grown in DMEM containing 4 mM L-glutamine, 20 mM HEPES (pH 7.4), P/S (50 U/mL), and 5% (v/v) FBS. Non-target and LRRK2-knockdown (LRRK2-KD) BV2 stable clones were generated as previously described (Kim et al. Citation2012). Notably, LRRK2-KD clones were sparsely grown, not forming the clumps generally observed in wild-type and control clones.
In vivo F-actin sedimentation assay
Primary microglia or BV2 were washed with PBS and lysed with actin stabilization lysis buffer (50 mM PIPES, pH 6.9, 50 mM KCl, 5 mM MgCl2, 5 mM EGTA, 5% Glycerol, 0.1% NP-40, 0.1% TX-100, 0.1% Tween-20, 0.1% 2-Mercaptoethanol, 0.001% AntifoamC, 1 mM ATP) containing 1 mM NaVO4, 1 mM PMSF, and 10 μg/mL leupeptin at room temperature. Cytochalasin D (2 μM) was added to the lysis buffer for negative control samples. After incubation at 37°C for 10 min, lysates were briefly centrifuged. The supernatant was centrifuged at 37°C, 16,000 g for 75 min. The supernatant containing G-actin was transferred, and the pellet containing F-actin was dissolved in 8 M urea at 4°C for 1 h. Actin (sc-1616, Santa Cruz), Rac1 (05-389, Millipore), and LRRK2 (ab133474, Abcam) levels were analyzed by Western blotting.
siRNA transfection into microglia and mixed glia
The following sequences were selected as effective target sequences against the endogenous LRRK2 for each animal (rat, 5’-AAGTTATTTGAAGGCAAAAATGT-3’ and 5’-ATGTGATGTTTTCCTGTTAATTT-3’; mouse, 5’-AAGTTATTTGAAGATAAAAATTT-3’ and 5’-GAGTCGGGAGTTCTTCTGCAT-3’) after screening (Genolution Pharmaceuticals, Korea). Cultured microglia (4 × 10⁴ cells/cm2) or mixed glia (3 × 10⁴ cells/cm2) were plated and transfected with 10 nM of RNAi using Lipofectamine RNAiMAX (Invitrogen, USA). Cells transfected with non-targeted RNAi (Genolution Pharmaceuticals) were used as negative controls. The maximal transfection efficiency of primary microglia was achieved by replacing the Opti-MEM transfection medium with a primary glia-conditioned medium (>3 days in vitro (DIV)) 4 h after transfection. Three days after transfection, cells were used in knockdown experiments.
Lentiviral shRNA production and infection
Primary microglia were infected with one multiplicity of infections and incubated for five days under a primary glia-conditioned medium. Primary microglia were purified as described above.
Rac1 activation assay
Microglia were washed with cold PBS. Cells were lysed in Rac1 lysis buffer (50 mM Tris-Cl, pH 7.5, 150 mM NaCl, 20 mM MgCl2, 2% NP-40, 1 mM NaVO4, 1 mM PMSF, and 10 μg/mL each of leupeptin and pepstatin). Cleared lysates were incubated with PAK-PBD agarose beads (Cytoskeleton, USA) for 1 h at 4°C. After washing three times, active Rac1 levels were analyzed by Western blotting with LRRK2 and Rac1 antibodies. One-twelfth of the total lysate was used to detect total protein levels. The relative Rac1 activation was determined by dividing the signal values of a Rac1-GTP pulldown by those of total proteins.
Organotypic hippocampal slice cultures (OHSCs)
Coronal hippocampal slices (400 μm thick) were prepared from 5-day-old SD rats using a McIlwain tissue chopper (Mickle Laboratory Engineering, UK). A hippocampal slice was cultured on a Millicell CM insert (Millipore, USA) fitted into 24-well plates with 200 μL of serum-based medium (MEM containing 25% [v/v] Hanks’ balanced salt solution, 25% [v/v] heat-inactivated horse serum [Hyclone, USA], 6.5 mg/mL glucose, 1 mM L-glutamine, 100 U/mL P/S). After 10 days in vitro (DIV), propidium iodide (PI, 2 μg/mL) negative slices were selected for subsequent experiments. Excitotoxicity was induced by 500 μM of an NMDA treatment over 24 h. Carboxyfluorescein diacetate (CFDA, Invitrogen, USA)-pre-labeled control or LRRK2-KD BV2 cells (10 μM, 1 h) were directly added onto the top of the slices (8 × 10⁴ cells/slice in a 2 μL of OHSC culture medium). Damaged neurons were stained with PI (2 μg/mL, 30 min). OHSCs were fixed using 4% paraformaldehyde (PFA, w/v in PBS) for 1 h and mounted with Vectashield (Invitrogen, USA). Confocal images using LSM510 (Zeiss, Germany) were obtained.
Scratched assay
Primary mouse glia was plated on 6-well plates. After confluency, a scratch in the middle of the well was made with a fine tip. Images from the same site were obtained over four days. Microglia were stained with Alexa 555-isolectin B4 (Invitrogen, USA) according to the manufacturer’s instructions. Images were obtained using an Axiovert200M (Zeiss, Germany).
F-actin staining
Primary microglia were seeded onto coverslips (Fisherbrand Coverglass for growth, Fischer Scientific, USA) and incubated overnight. After incubation with/without ADP (100 μM), cells were fixed in 4% PFA for 15 min. Fixed cells were washed twice with PBS and permeabilized with PBS-T (0.1% Triton X-100 in PBS) for 10 min. Permeabilized cells were incubated with Phalloidin Alexa 488 (0.1 μM, Cytoskeleton, USA) for staining F-actin. Images were captured with fluorescence confocal microscopes (LSM510, Zeiss, Germany).
In vitro actin polymerization assay
This assay was performed using skeletal-muscle actin and the Actin Polymerization Biochem Kit (Cytoskeleton, USA). Briefly, depolymerized pyrene-actin (0.4 mg/mL) was added to a 96-well plate and mixed with 10–50 nM of recombinant human LRRK2s containing 970–2527 catalytic domains (Invitrogen, USA). Polymerization was simultaneously induced by recombinant protein treatment at 10 mM NaCl. The fluorescence signal of pyrene-actin was measured with a SpectraMAX Gemini spectrofluorometer (Molecular Devices, USA) every 30 s for 20 min. The basal fluorescence before polymerization was measured for 3 min; the measurement was restarted after adding the recombinant.
In vitro actin depolymerization assay
For this assay, F-actin was pre-assembled from G-actin (1 mg/mL) in G-buffer (5 mM Tris-Cl pH 8.0, 0.2 mM CaCl2, and 0.2 mM ATP) by adding a concentrated salt solution to a final concentration of 25 mM KCl, 0.5 mM MgCl2, and 0.45 mM ATP. After 1 h of polymerization at room temperature, the pre-formed F-actin was further diluted 20-fold with G-buffer to stop polymerization. BSA or recombinant LRRK2s (50 nM) were added to the pre-formed F-actin and incubated for 30 min. F- and G-actin were separated by ultracentrifugation in 100,000 K for 60 min at 4°C. The F-actin pellet was disassembled with 8 M urea. The actin levels in the supernatant (G-actin) and pellet (F-actin) were analyzed by Coomassie blue staining, followed by SDS-PAGE. The same conditions but adding the G-buffer instead of the salt solution at the polymerization step were used as G-actin-rich control.
Immunoprecipitation (IP) assay
Cultured primary microglia were lysed with a buffer containing 1% Triton X-100, 150 mM NaCl, 10 mM NaH2PO4, 15 mM Na2HPO4, 50 mM NaF, 1 mM EDTA, and 1 mM Na3VO4. Cell lysates (500 μg) were incubated with an MJFF2 LRRK2 antibody (5 μL/rxn) and further incubated with agarose-G (20 μL, 50% slurry). After washing three times with lysis buffer, Rac1 (1:3,000, Millipore) and LRRK2 (1/1,000, Millipore) were used to detect the levels of protein bound to rat LRRK2 by Western Blot.
Time-lapse microscopy
Phase-contrast images of primary microglia were acquired every 2 s for 12 min using Axiovision 4.8 software (Zeiss) with a 40x/0.6 NA objective (Zeiss). The cells were maintained at 37°C (Tempcontrol 37–2 digital, Zeiss). Extracellular ADP (100 μM) was added to the culture medium 2 min after initiation of image capture.
Quantification and statistical analysis
Quantification of band intensities of Western blots was measured using Bio1D software (Vilber Lourmat, France). Coomassie-stained bands were quantified using ImageJ software (NIH, USA). Unpaired Student's t-tests were performed to assess the statistical significance of all assays.
Results and discussion
LRRK2 is rapidly redistributed to polymerizing F-actin in ADP-activated microglia
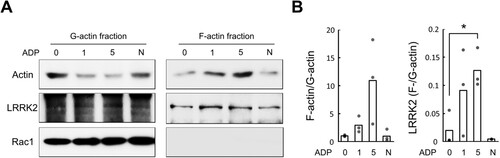
To address the direct role of LRRK2 in microglia actin dynamics, we first examined the correlation between endogenous LRRK2 and filamentous actin (F-actin) before and after ADP treatment on primary microglia. As reported (Honda et al. Citation2001), membrane ruffles and lamellipodia, F-actin-rich structures, dramatically increased within minutes after ADP treatment in primary microglia (Supplementary Figure 1). The sedimentation assay showed F-actin accumulation in primary microglia after ADP stimulation (A). The ratio of F-actin to G-actin increased to 2.9 and 10.9 fold after 1 and 5 min of ADP stimulation compared to control, respectively (B). Interestingly, LRRK2 protein co-sedimented with F-actin, suggesting a correlation between LRRK2 and the newly assembled F-actin in microglia (A). The LRRK2 levels in the F-actin fraction increased by 4.5 and 6.3 fold after 1 and 5 min of ADP treatment, respectively (B).
Figure 1. Co-localization of LRRK2 in the F-actin fraction of ADP-stimulated microglia. F-actin sedimentation assay in ADP-treated and non-treated primary microglia. (A) Western blot of actin, LRRK2, and Rac1 proteins in the F- and G-actin-rich fractions. Rac1 was used as a marker for cytosolic G-actin fraction. (B) Actin or LRRK2 ratio in F-actin/G-actin fractions (N = 3). Values are mean ± SEM (**, p < 0.01). N, cytochalasin D treated negative control. Figures are presentative of ≥3 independent experiments.
LRRK2 directly depolymerizes F-actin
After observing the rapid LRRK2 transfer to the F-actin fraction in cultured primary microglia (), we speculated that LRRK2 might be active in F-actin but not in G-actin in microglia. Since recombinant human LRRK2 protein inhibits in vitro actin polymerization (Meixner et al. Citation2011), we hypothesized that LRRK2 might reduce actin polymerization by depolymerizing F-actin to G-actin.
LRRK2’s F-actin depolymerization activity was assayed by incubating pre-formed F-actin under low salt conditions to halt actin polymerization, followed by adding recombinant human LRRK2 protein. Separation of G- and F-actin showed that adding LRRK2 led to increased G-actin in the solution; 120% G-actin was detected in the presence of LRRK2 recombinant protein compared to the BSA control (A). Since no further F-actin polymerization occurred after adding LRRK2, this reduction indicates that LRRK2 directly depolymerized F-actin. The G2019S LRRK2 mutant, the most frequently found mutation in PD patients (Healy et al. Citation2008), showed higher F-actin depolymerization activity (135% G-actin compared to BSA control; A). Moreover, the existence of wild-type and G2019S LRRK2 in the F-actin-rich pellet, but not in G-actin-rich supernatants like BSA, confirmed the solid binding of LRRK2s to F-actin (A).
Figure 2. LRRK2 depolymerizes F-actin. (A) In vitro F-actin depolymerization assay. 5 μM of bovine serum albumin (BSA), recombinant human wild-type (WT) or G2019S mutant (G2019S) LRRK2 were added to pre-formed F-actin under low salt conditions (Depol.). Coomassie Blue staining (left) and G-actin to F-actin ratio (right). Neg., G-actin-rich condition. (B) Realtime in vitro actin polymerization assay. BSA, WT, or G2019S LRRK2 was added at 3 min after fluorescence measurement of pyrene-labeled actin (10 μM) (White arrow). Proteins in A and B, 50 nM. (C) LRRK2 and actin levels in the G-actin rich (Supernatant, Sup.) or F-actin rich (Pellet) fractions of BV2 microglial cytoplasm. Cont., control; KD, LRRK2-knockdown. Western blot (left) and the quantified densitometry data of the G-actin to F-actin ratio (middle) and the levels of LRRK2 in each group (right). Values are mean with each data point shown as a dot or ± SD. (*, p < 0.05; **, p < 0.01). N = 3–4.
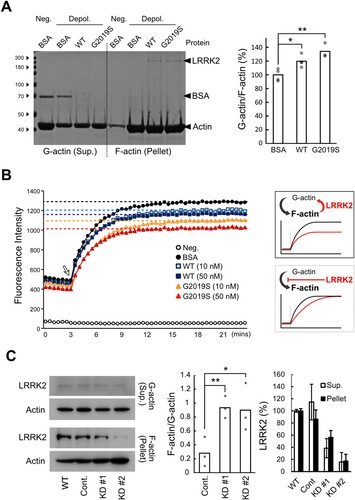
To further test the depolymerization activity of LRRK2, we next performed a real-time in vitro actin polymerization assay using pyrene-labeled G-actin, producing higher fluorescence with F-actin. If LRRK2 inhibits G-actin polymerization, LRRK2 treatment would later reach F-actin’s maximum fluorescence levels but the same maximum fluorescence intensity. However, LRRK2 incubation resulted in lower maximum fluorescence intensity compared to the BSA-treated control at the stationary phase, indicating that LRRK2 actively depolymerizes F-actin rather than inhibiting G-actin polymerization (B). The G2019S LRRK2 mutant further reduced the fluorescence levels of F-actin in a dose-dependent manner (B). More importantly, the cytoplasmic F-actin in LRRK2 knockdown (LRRK2-KD) microglia showed at least 50% decreased levels of LRRK2 compared to wild-type and control BV2 cells, produced a 3-fold higher amount that in control cells (C). It indicates that LRRK2 negatively regulates F-actin formation in live microglia like the polymerized F-actin in vitro. Therefore, LRRK2 seems to play a role in F-actin depolymerization both in in vitro and in the cytoplasm of microglia, and the G2019S pathogenic mutant has higher F-actin depolymerization activity under in vitro conditions.
LRRK2 binds to Rac1 decreasing GTP-Rac1 formation
In addition to its direct binding to F-actin, it has been suggested that LRRK2 interacts with actin-associated proteins (Parisiadou et al. Citation2009; Chan et al. Citation2011; Meixner et al. Citation2011). Rac1 is actively involved in F-actin elongation in highly motile cells (Ridley et al. Citation1992; Kraynov et al. Citation2000), binding to LRRK2 in brain lysates (Chan et al. Citation2011).
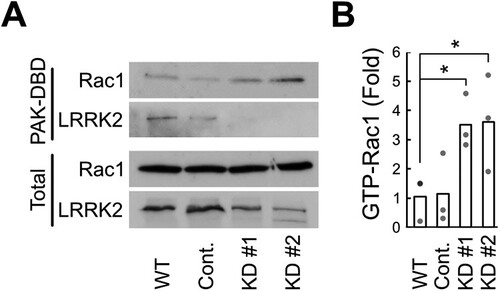
Therefore, we next analyzed the effect of LRRK2 on the levels of GTP-Rac1, the active form of Rac1, in microglia. Intracellular GTP-Rac1 levels were measured in wild-type (WT), non-targeted control (control), and LRRK2-KD BV2 microglia using a PAK-DBD binding assay. LRRK2 detection in the PAK-DBD binding fraction of WT and control indicates that LRRK2 is bound to GTP-Rac1 in microglia (A). Interestingly, LRRK2-KD showed significantly increased GTP-Rac1 levels compared to wild-type microglia, suggesting that LRRK2 negatively regulates Rac1 activation by decreasing GTP-Rac1 levels in microglia, contributing to limited F-actin formation in microglia ().
Figure 3. Inhibition of Rac1 activity through Rac1-LRRK2 interaction in microglia. (A) Rac1 activation assay. Wild-type (WT), control (Cont.), and the two LRRK2-knockdown clones (KD#1 and KD#2) of BV2 microglia cells. PAK-PBD binding to Rac1 and LRRK2 is shown in the upper two panels (PAK-DBD). Total Rac1 and LRRK2 levels are shown in the bottom (total). (B) Relative GTP-Rac1 levels compared to those of total Rac1. N = 3. Values are mean with each data point shown as a dot. (*, P < 0.05 compared to wild-type). Data are representative of ≥3 independent experiments.
LRRK2 knockdown induces lamellipodia formation causing rapid movement to the damaged area
Next, we investigated the inhibitory effects of LRRK2 on F-action formation. As excessive actin remodeling and morphological changes were found in ADP-stimulated primary microglia ( and Supplementary Fig. 1), we generated lentivirus harboring shRNA for LRRK2-KD in primary microglia and used ADP for inducing F-actin formation. Intriguingly, LRRK2-KD primary microglia showed a reduced number of ruffles in ADP-stimulated microglia but significantly increased lamellipodia formation, suggesting enhanced cell movement of LRRK2-KD microglia in response to a danger signal (A and Supplementary Movie 1).
Figure 4. Knockdown of LRRK2 enhances migration of microglia. (A) Time-lapse images of ADP-activated primary microglia infected with non-targeted control (shCont) or LRRK2-targeted (shLRRK2 #1, #2) small-hairpin RNA expressing lentivirus. Left, Co-expressed eGFP signal from the virus-infected cells. Arrow, Ruffle; Arrowhead, Lamellipodia. (B) Migration of LRRK2-knockdown microglia to the scratched area. Morphological changes in the region of scratch after four days (dot line) were analyzed in non-target control (siCont) or LRRK2-targeted (siLRRK2) siRNA transfected mixed mouse glia. PC, phase-contrast image; IB4, isolectin B4-FITC positive microglia image. (C, D) Migration of LRRK2-knockdown BV2 microglia to the NMDA-induced damaged area. The non-treated or 24 h NMDA-treated (NMDA) organotypic hippocampal slices were incubated with CFDA-labeled control (+Cont) and LRRK2-knockdown microglia (+LRRK2-KD). Damaged neurons were stained with propidium iodide (red). Infiltrated microglia were quantified in (D). Values are the mean for each data point (dots). (*, p < 0.05). Arrowhead, infiltrated microglia (yellow merged cells); Arrow, attached microglia on the slice. (E) Directed migration of LRRK2-KD BV2 microglia to external ATP signal. ATP (1mM) was loaded to the right side, and the indicated BV2 cells were placed on the left side of a microfluidic chamber. The images were taken after 24 h of incubation of the cells. Yellow arrowhead, actively migrating microglia crossing a thin capillary. Bars = 20 µm (A), 100 μm (B), 50 μm (C-inset and E), or 200 μm (C).
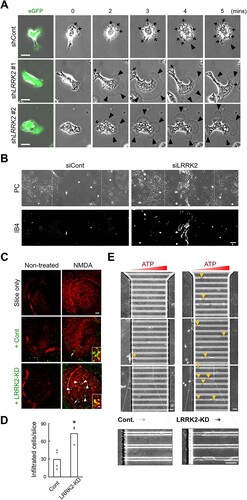
Since extracellular ATP and ADP are released in damaged brain areas and induce microglia migration toward the site through actin remodeling (Heppner et al. Citation1998; Neary et al. Citation2003; Eichhoff et al. Citation2011 ), we next tested whether the enhanced movement of LRRK2-KD microglia influences traveling to the damaged area. The damaged area induced by scratching on a confluent 2D cultured glia was rapidly recovered in the LRRK2 siRNA-treated group but not in the non-targeted siRNA-treated group 4 days after scratching (B). The fast-accumulating cells in the center of the scratched areas were identified as migrating microglia by isolectin-B4 staining (B). The active migration of LRRK2-KD microglia to the damaged area was further tested in NMDA-induced neurotoxic brain slices (C, D). In this case, exogenous LRRK2-KD microglia labeled with green fluorescence colocalized mainly with the dead cells in the slice showing yellow fluorescence, unlike control microglia (C, D). More importantly, we observed that LRRK2-KD microglia largely infiltrated the thin capillary space, where the ATP gradient formed (E). These results collectively suggested that LRRK2 is the inhibitory signal for the actin dynamics in microglial movement and controls the excessive movement of microglia to the damaged sites.
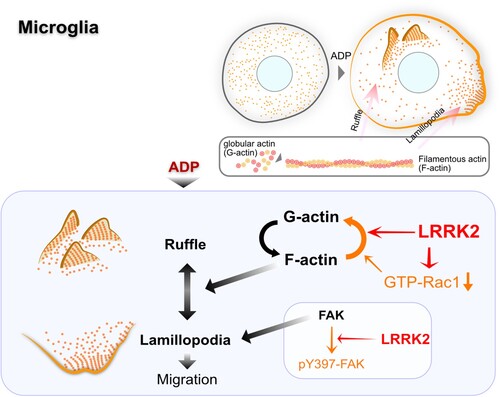
In the present study, we investigated the role of LRRK2 in microglia F-actin remodeling. We revealed that LRRK2 in microglia negatively affects migration by promoting direct F-actin depolymerization and inhibiting GTP-Rac1 formation. LRRK2-KD produced a prominent lamellipodia formation to migrate to a damaged brain site. The negative effect of LRRK2 on microglia migration to damaged areas suggests that LRRK2 attenuates microglial migration through the regulation of actin dynamics ().
A protein involved in migration often has dual roles in cell adhesion and cytoskeletal rearrangement (Jeon et al. Citation2021). Pathogenic LRRK2 mutants cause an abnormal response of microglia to a micro-injury through its kinase activity to FAK, causing the inhibition of the cell adhesion (Choi et al. Citation2015) (). Concorrently, the excessive effect of recombinant mutant LRRK2 on the F-actin rearrangement found in this study may also contribute to triggering the imbalanced formation of ruffle rather than lamellipodia ().
Figure 5. Illustration of LRRK2 effect on the actin dynamics of microglia. LRRK2 decreases microglial actin dynamics by F-actin depolymerization and Rac1 inhibition and inhibitory phosphorylation of focal adhesion kinase (red lines). FAK, focal adhesion kinase; pY397-FAK, phosphorylated FAK at the tyrosine 397 residue.
Together with the result of excessive F-actin depolymerization of G2019S mutant LRRK2, the moderate, but not complete, inhibition of LRRK2 activity in Parkinson’s disease may cause beneficial effects by recovering the impaired actin dynamics of microglia.
Supplemental Material
Download PDF (184.8 KB)Acknowledgments
We thank Prof. G. Yoon (Ajou University School of Medicine, Dept. Biochemistry and molecular biology) for technical help.
Disclosure statement
No potential conflict of interest was reported by the author(s).
Additional information
Funding
References
- Chan D, Citro A, Cordy JM, Shen GC, Wolozin B. 2011. Rac1 protein rescues neurite retraction caused by G2019S leucine-rich repeat kinase 2 (LRRK2). J Biol Chem. 6(286):16140–16149. Epub 20110316.
- Choi I, Kim B, Byun JW, Baik SH, Huh YH, Kim JH, Mook-Jung I, Song WK, Shin JH, Seo H, et al. 2015. LRRK2 g2019s mutation attenuates microglial motility by inhibiting focal adhesion kinase. Nat Commun. 14(6):8255. Epub 20150914.
- Davalos D, Grutzendler J, Yang G, Kim JV, Zuo Y, Jung S, Littman DR, Dustin ML, Gan WB. 2005. ATP mediates rapid microglial response to local brain injury in vivo. Nat Neurosci. 8:752–758. Epub 20050515.
- Dawson TM, Golde TE, Lagier-Tourenne C. 2018. Animal models of neurodegenerative diseases. Nat Neurosci. 21:1370–1379. Epub 20180924.
- Eichhoff G, Brawek B, Garaschuk O. 2011. Microglial calcium signal acts as a rapid sensor of single neuron damage in vivo. Biochimica et Biophysica Acta (BBA) - Molecular Cell Research. 1813:1014–1024. Epub 20101105.
- Gao HM, Hong JS. 2011. Gene-environment interactions: key to unraveling the mystery of Parkinson's disease. Prog Neurobiol. 94:1–19. Epub 20110323.
- Gillardon F, Schmid R, Draheim H. 2012. Parkinson's disease-linked leucine-rich repeat kinase 2(R1441G) mutation increases proinflammatory cytokine release from activated primary microglial cells and resultant neurotoxicity. Neuroscience. 208:41–48. Epub 20120207.
- Haynes SE, Hollopeter G, Yang G, Kurpius D, Dailey ME, Gan WB, Julius D. 2006. The P2Y12 receptor regulates microglial activation by extracellular nucleotides. Nat Neurosci. 9:1512–1519. Epub 20061119.
- Healy DG, Falchi M, O'Sullivan SS, Bonifati V, Durr A, Bressman S, Brice A, Aasly J, Zabetian CP, Goldwurm S, et al. 2008. Phenotype, genotype, and worldwide genetic penetrance of LRRK2-associated Parkinson's disease: a case-control study. The Lancet Neurology. 7:583–590. Epub 20080606.
- Heppner FL, Skutella T, Hailer NP, Haas D, Nitsch R. 1998. Activated microglial cells migrate towards sites of excitotoxic neuronal injury inside organotypic hippocampal slice cultures. Eur J Neurosci. 10:3284–3290.
- Ho DH, Lee H, Son I, Seol W. 2019. G2019s LRRK2 promotes mitochondrial fission and increases TNFα-mediated neuroinflammation responses. Animal Cells Syst (Seoul). 23:106–111. Epub 20190301.
- Honda S, Sasaki Y, Ohsawa K, Imai Y, Nakamura Y, Inoue K, Kohsaka S. 2001. Extracellular ATP or ADP induce chemotaxis of cultured microglia through Gi/o-coupled P2Y receptors. J Neurosci. 21:1975–1982.
- International Parkinson Disease Genomics C, Nalls MA, Plagnol V, Hernandez DG, Sharma M, Sheerin UM, Saad M, Simon-Sanchez J, Schulte C, Lesage S, et al. 2011. Imputation of sequence variants for identification of genetic risks for Parkinson's disease: a meta-analysis of genome-wide association studies. Lancet. 377:641–649. Epub 20110201.
- Jeon J, Kim D, Jeon TJ. 2021. Opposite functions of RapA and RapC in cell adhesion and migration in Dictyostelium. Animal Cells Syst (Seoul). 25(4):203–210.
- Joe E, Choi D, An J, Eun J, Jou I, Park S. 2018. Astrocytes, microglia, and Parkinson’s disease. Exp Neurobiol. 27(2):77–87.
- Kicka S, Shen Z, Annesley SJ, Fisher PR, Lee S, Briggs S, Firtel RA. 2011. The LRRK2-related Roco kinase Roco2 is regulated by Rab1A and controls the actin cytoskeleton. Mol Biol Cell. 22:2198–2211. Epub 20110505.
- Kim B, Jeong HK, Kim JH, Lee SY, Jou I, Joe EH. 2011. Uridine 5′-diphosphate induces chemokine expression in microglia and astrocytes through activation of the P2Y6receptor. The Journal of Immunology. 186:3701–3709. Epub 20110211.
- Kim B, Yang MS, Choi D, Kim JH, Kim HS, Seol W, Choi S, Jou I, Kim EY, Joe EH. 2012. Impaired inflammatory responses in murine Lrrk2-knockdown brain microglia. PLoS One. 7:e34693. Epub 20120409.
- Kraynov VS, Chamberlain C, Bokoch GM, Schwartz MA, Slabaugh S, Hahn KM. 2000. Localized Rac activation dynamics visualized in living cells. Science. 290:333–337.
- Lee H, James WS, Cowley SA. 2017. LRRK2 in peripheral and central nervous system innate immunity: its link to Parkinson's disease. Biochem Soc Trans. 45:131–139.
- Li X, Patel JC, Wang J, Avshalumov MV, Nicholson C, Buxbaum JD, Elder GA, Rice ME, Yue Z. 2010. Enhanced striatal dopamine transmission and motor performance with LRRK2 overexpression in mice is eliminated by familial Parkinson's disease mutation G2019S. J Neurosci. 30:1788–1797.
- Meixner A, Boldt K, Van Troys M, Askenazi M, Gloeckner CJ, Bauer M, Marto JA, Ampe C, Kinkl N, Ueffing M. 2011. A QUICK screen for Lrrk2 interaction partners–leucine-rich repeat kinase 2 is involved in actin cytoskeleton dynamics. Mol Cell Proteomics. 10:M110 001172. Epub 20100927.
- Moehle MS, Daher JP, Hull TD, Boddu R, Abdelmotilib HA, Mobley J, Kannarkat GT, Tansey MG, West AB. 2015. The G2019S LRRK2 mutation increases myeloid cell chemotactic responses and enhances LRRK2 binding to actin-regulatory proteins. Hum Mol Genet. 24:4250–4267. Epub 20150429.
- Moehle MS, Webber PJ, Tse T, Sukar N, Standaert DG, DeSilva TM, Cowell RM, West AB. 2012. LRRK2 inhibition attenuates microglial inflammatory responses. J Neurosci. 32:1602–1611.
- Nam D, Kim A, Han SJ, Lee S, Park S, Seol W. 2021. Analysis of α-synuclein levels related to LRRK2 kinase activity: from substantia nigra to urine of patients with Parkinson’s disease. Animal Cells Syst (Seoul). 25(1):28–36.
- Neary JT, Kang Y, Willoughby KA, Ellis EF. 2003. Activation of extracellular signal-regulated kinase by stretch-induced injury in astrocytes involves extracellular ATP and P2 purinergic receptors. J Neurosci. 23:2348–2356.
- Nimmerjahn A, Kirchhoff F, Helmchen F. 2005. Resting microglial cells are highly dynamic surveillants of brain parenchyma in vivo. Science. 308:1314–1318. Epub 20050414.
- Parisiadou L, Xie C, Cho HJ, Lin X, Gu XL, Long CX, Lobbestael E, Baekelandt V, Taymans JM, Sun L, et al. 2009. Phosphorylation of ezrin/radixin/moesin proteins by LRRK2 promotes the rearrangement of actin cytoskeleton in neuronal morphogenesis. J Neurosci. 29:13971–13980.
- Ridley AJ, Paterson HF, Johnston CL, Diekmann D, Hall A. 1992. The small GTP-binding protein rac regulates growth factor-induced membrane ruffling. Cell. 70:401–410.
- Tong Y, Pisani A, Martella G, Karouani M, Yamaguchi H, Pothos EN, Shen J. 2009. R1441c mutation in LRRK2 impairs dopaminergic neurotransmission in mice. Proc Natl Acad Sci USA. 106:14622–14627.