
ABSTRACT
Riptortus pedestris is a major pest of soybean in East Asia that feeds on maturing seeds, reducing nutritional quality and causing seed abortion. Aggregation pheromone of the bean bug has been conventionally used as a lure for mass-trapping, but the control practices, used by farmers and recommended by the manufacturer can increase infestation in soybean fields. Here we investigated the efficacy of soybean semiochemical blend as a repellent incorporated with an attractant blend to develop a push–pull strategy. The efficacy of potential repellents was tested in a soybean field by evaluating three control strategies: a potential repellent (push), an attractant based on the synergistic effect of synthetic host plant volatiles and the aggregation pheromone (pull), and a combination of the attractant and the potential repellent. We adopted two different monitoring systems, sticky traps and camera traps, to assess the spatial distribution of the bean bugs. The attractant and repellents were strategically deployed, by putting the repellent in the center of soybean plot while the attractants were placed at the edge of the plot. In soybean plots treated with only attractants at the edge, the number of bean bugs was significantly higher in both soybean and edge areas than those of control plots. In contrast, the number of attracted bean bugs to soybean area significantly decreased in the push–pull treated plot, verified by both sticky trap and camera trap methods. This strategy could prevent colonization and population establishment of the bean bugs in soybean fields as part of an integrated pest management.
Introduction
The bean bug, Riptortus pedestris (Hemiptera: Alydidae) is one of the most important pests of soybean (Glycine max) in East Asia (Leal et al. Citation1995; Lee et al. Citation2004; Li et al. Citation2019). The bean bugs feed on maturing seed pods and leaves by piercing and sucking, which decreases nutritional quality, germination potential and eventually causes seed abortion (Lim Citation2013; Bae et al. Citation2014). Abortive seed rates can reach 80% depending on the pest population density and developmental stage of soybean (Li et al. Citation2021). The feeding mode also makes this insect an efficient virus vector as shown by a recent outbreak of stay-green syndrome in China (Li et al. Citation2019; Wei et al. Citation2023). In agricultural systems, bean bugs populate dramatically well on leguminous crops, but also feed on a number of fruits, such as persimmon (Diospyros kaki) (Kang et al. Citation2003; Kim and Lim Citation2012), Yuzu (Citrus junos) (Choi et al. Citation2000; Kang et al. Citation2003), and apple (Malus domestica) (Kim and Lim Citation2012), as well as crop species including barley (Hordeum vulgare) and sesame (Sesamum indicum) (Mainali and Lim Citation2012). Feeding on fruit crops causes fruit spotting and is often directly related to an economic loss of farmers. However, the bean bugs cannot survive solely feeding on these fruits or crops other than leguminous crops (Kim et al. Citation2014; Mainali et al. Citation2014; Rahman and Lim Citation2017a).
Former studies on R. pedestris revealed the components and composition of the aggregation pheromone released by adult males (Numata et al. Citation1990; Leal et al. Citation1995; Endo et al. Citation2006; Mizutani et al. Citation2007; Yasuda et al. Citation2007). This pheromone has been commercialized and conventionally used to control the bean bugs in agricultural environment as a mass-trapping method. However, this ‘pull strategy’ alone is unsuitable to control the bean bugs because installing aggregation pheromone traps near the field unintentionally increases the infestation of R. pedestris in the soybean field (Rahman et al. Citation2018). This might be due to (1) a strong synergistic effect of soybean volatiles with the aggregation pheromone in attracting the conspecifics (Song et al. Citation2022) and (2) a spillover of insects from traps into the soybean field (Switzer et al. Citation2009). Such a strong attractant can be strategically used to control the bean bugs in combination with repellents as a push–pull strategy.
Push–pull strategies are often employed in contemporary integrated pest management. These strategies deploy two semiochemicals in the field: one to repel target pests from crops, and the other to attract them to a trap (Cook et al. Citation2007). Artificial changes in host plant volatiles by adding synthetic volatiles can distract ratio-specific host recognition process, i.e. interfering chemical perception at sensory peripheries (Schröder and Hilker Citation2008; Webster et al. Citation2010; Cai et al. Citation2017; Dupuy et al. Citation2017). Similarly, plant crude extracts or essential oils are often proposed as a push agent to control agricultural pests, by altering attraction behavior of the pest (Zhang et al. Citation2014). A volatile compound or a subset of volatiles might repel the pest as a predator-calling signal by damaged plants (Aartsma et al. Citation2017). Assessment of push–pull strategy is often conducted by comparing spatial variations in pest abundance. However, the data is often acquired by specific trapping methods that are prone to method-biased or observer-biased error (Scheirs et al. Citation1997). To overcome such limitations of traditional trapping methods, the deep learning-based image analysis in computer vision has been developed for pest monitoring (Høye et al. Citation2021).
In this study, we investigated the efficacy of soybean-based semiochemicals as repellents incorporated with the attractant to develop a push–pull strategy. As potential repellents, we utilized a volatile mixture to which bean bugs showed a strong avoidance response in laboratory conditions. The efficacy of potential repellents was tested in a soybean field by evaluating three control strategies: a potential repellent (push), attractant based on the synergistic effect of synthetic soybean volatiles and the aggregation pheromone (pull), and a combination of the attractants and a potential repellent strategically deployed as a push–pull strategy. Two different monitoring systems, (1) sticky trap and (2) camera trap, were adopted to assess the spatial distribution of the bean bugs in soybean fields in response to different control strategies.
Materials and methods
Semiochemicals
All synthetic chemicals for bioassays, including (Z)-3-hexen-1-ol (98%, cat# H12900), (Z)-3-hexenyl acetate (≥98%, cat# 31701), 4-ethylbenzaldehyde (98%, cat# 233633), and methyl salicylate (≥99%, cat# M6752), and organic solvents such as hexane (≥97%, cat# 34859), dichloromethane (≥99.9%, cat# 650463), and methanol (≥99.9%, cat# 34860) for washing analytical apparatus were purchased from Sigma-Aldrich (St. Louis, MO, USA). A commercially available synthetic aggregation pheromone was purchased from Greenagrotech Inc. (Gyeongsan, South Korea) and used to make a lure for ‘pull’ treatments by blending with the soybean volatile mixture. Pheromone lure consists of (E)-2-hexenyl (Z)-3-hexenoate, (E)-2-hexenyl (E)-2-hexenoate, tetradecyl isobutyrate, and octadecyl isobutyrate with 2,6-di-tert-butyl-4-methylphenol as an additive compound in a mass ratio of 5.5:27.6:38.7:13.3:13.9. Mineral oil (cat# 1632129, Biorad, Hercules, CA, USA) was used to dilute the synthetic volatiles. All chemicals were stored according to the manufacturer’s suggested conditions. Synthetic soybean volatile mixture (SSV B) was blended in the ratio as described in the previous study (Song et al. Citation2022). In brief, (Z)-3-hexen-1-ol, (Z)-3-hexenyl acetate, 4-ethylbenzaldehyde, and methyl salicylate were combined in a mass ratio of 2.6:5.9:46.7:15.8. A potential repellent mixture (SSV R) was composed of (Z)-3-hexenyl acetate and 4-ethylbenzaldehyde in 1:1 mass ratio. To assess the effects of control and repellent measures, we introduced 100 µL of a specific solution into each rubber septum. For the attractant trials, we combined 60 µL of a commercially available aggregation pheromone with 100 µL of a synthetic soybean volatile mixture, which served as the attractant solution. This attractant mixture was then also placed in rubber septa. A rubber septum (cat# wh.224100.060, Wheaton, Millville, NJ, USA) with chemicals pipetted inside was used as a dispenser for each treatment in field experiments.
Behavioral bioassay
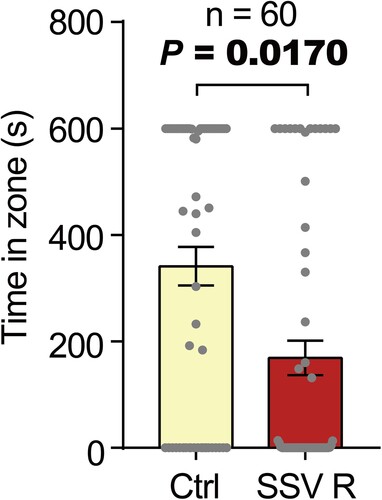
Procedures of behavioral bioassays and specifications of the vertical airflow olfactometer are described in a previous study (Song et al. Citation2022). In brief, two different odors are provided with constant airflow through funnels made of stainless steel into an acrylic chamber, where individual bean bugs can freely move (Supplementary Figure 1a). A white LED panel with 30 modules was placed behind the olfactometer for uniform lighting (30 µmol m−2 s−1). Given that male bean bugs are better at orienting to their host plant odors than females (Song et al. Citation2022), only male bean bugs were tested for the behavioral bioassays. Virgin male bean bugs less than 20 days old were starved for 24 h prior to the bioassays. A bean bug was introduced into the acrylic chamber through a small entrance (20 mm × 20 mm) and were observed in the presence of various odors diluted in mineral oil. The bean bugs were allowed to move freely from one side to the other side of the chamber for 10 min, while the duration that individual bean bugs remained on either side were measured. A minimum of 46 to maximum of 60 insects were individually tested. Each individual was used only once in this experiment. The odor source diluted in mineral oil or pure mineral oil as control was pipetted to a filter paper (42.5 mm in diameter; Whatman No. 1) inside a stainless funnel. Charcoal filter purified air flowed at a rate of 0.5 L min−1 to each zone of the bioassay chamber. To ensure unbiased results, the positions of both sides of the funnel and the odorants were periodically reversed after every 10–15 trials. In addition, behavioral responses of the bean bugs to mineral oil (control), 500 µg of aggregation pheromone, full-headspace extraction samples were examined to ensure the validity of the olfactometer system. In addition to various synthetic soybean volatile mixtures tested by Song et al. (Citation2022), a volatile mixture of (Z)-3-hexenyl acetate and 4-ethylbenzaldehyde in a 1:1 ratio (500 µg) was tested for the behavioral responses of the bean bugs ().
Figure 1. Behavioral responses of the male bean bugs in a vertical airflow olfactometer. Virgin male bean bugs (n = 60) showed a strong avoidance behavior to a synthetic soybean volatile mixture R (SSV R). Bars represent mean time an individual bean bug stayed in each zone ± SEM. P-value was determined by the Wilcoxon signed-rank test. Visual description of vertical airflow olfactometer and behavioral responses of the bean bugs to other odors are represented in Supplementary .
Field sites and layout
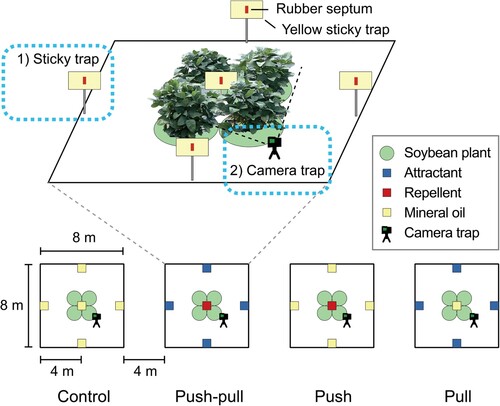
Field experiments were conducted in an experimental farm of Pusan National University, Miryang of South Korea over one month of soybean seed maturation period, from the 23rd of August until the 22nd of September 2022. Soybean seeds were directly germinated in early June of 2022. No chemical insecticides were applied in the field during the whole experimental period. Four treatments were tested in four different plots: (1) mineral oil (control), (2) repellent (SSV R) in the center of a soybean plot (push), (3) attractant, a blend of synthetic soybean volatile mixture (SSV B) and aggregation pheromone, at the edge (pull), and (4) repellent (SSV R) in the center of a soybean plot and attractant, the blend of synthetic soybean volatile mixture (SSV B) and aggregation pheromone, at the edge (push–pull). Chemicals for each treatment were pipetted in rubber septum and fixed on sticky traps. All plots were in 8 m × 8 m size and placed in line with minimum 4 m distance from each other. Each plot was composed of four soybean plants planted in a square with 1.5 m distance (). Spatial distribution of the bean bugs to each treatment was measured via two different trapping methods: (1) sticky trap and (2) camera trap.
Figure 2. Layout of experimental sites. Schematic diagram of experimental layout in the field. In brief, a field consists of four different plots representing each treatment. Each plot was at least 4 meters apart. In each plot, four soybean plants were planted in the center. A sticky trap installed in the center of a plot represents soybean area, while four sticky traps installed 4 meters away from the center represent the edge area. A stationary camera trap was installed to face soybean plants in each plot.
Sticky trapping
All sticky traps were placed at 1 m above ground, one in the center and four sticky traps at the edge of each plot (). Experimental procedures to test the efficacy of push–pull treatment are as follows: On the first day of the experiment, sticky traps were installed with lures as explained above. On consecutive three days, the number of bean bugs trapped to each sticky trap was recorded and the trapped insects were removed every 24 h. On the last day of the experiment all lures and traps were removed from the field. Each replication was conducted with at least 5-day intervals according to the local weather conditions as this experimental period included the summer monsoon season of Korea.
Camera trapping
In camera trapping, the cameras (GoPro Hero 9 Black) were equipped at a distance of 10 cm from soybean plants in the soybean area ( and Supplementary Figure 2). After the installation of sticky traps baited with treatment chemicals, videos were recorded for three consecutive days from 5 am on the first day to 5 pm on the last day of the trial in a one-frame-per-minute time-lapse mode in 4 K quality. After each trial, video data was collected by removing secure digital cards from each camera trap. The videos were split by experimental date for the analysis. In total, 9 videos of about 2500 frames for each treatment corresponding to each experimental data were generated.
Video analysis
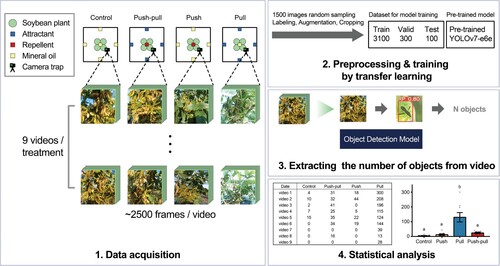
Video analysis was performed by using a deep learning-based object detection model, YOLOv7 (Wang et al. Citation2022; Park et al. Citation2023). To construct training, validation, and test datasets, we randomly extracted 1500 images from videos recorded by camera trapping. The 1500 images were preprocessed by performing image resizing to 640 × 640 pixels, labeling the positions of the bean bugs in each image, flipping augmentation, and object cropping. The preprocessed 1500 images were split into a training set of 3100 images, a validation set of 300 images, and a test set of 100 images (). Four models were constructed by transfer learning based on four YOLOv7 pre-trained models with the dataset and options described in Supplementary Table 2. The models were trained with one NVIDIA GeForce RTX 3090 GPU for 27 min. By checking the training log and evaluation results for each checkpoint, the best-fit weight (146 iterations) was selected (Supplementary Figure 3). The number of bean bugs in each video was automatically counted using the best-fit checkpoint of the model ().
Figure 3. The overview of camera trapping and deep learning-based analysis. The process of stationary camera trapping and deep learning-based analysis consists of four steps: (1) video data acquisition from each plot of treatment for each day; (2) video data preprocessing and training YOLOv7, an object detection model, by transfer learning; (3) extracting the number of objects from each video by using object detection model; and (4) statistical analysis of number of objects among each treatment.
Statistical analysis
The behavioral responses of the bean bugs to synthetic volatile compounds in the vertical airflow olfactometer were analyzed for statistical significance using the Wilcoxon signed-rank test. For sticky trap experiments, the total number of bean bugs attracted to each plot was compared by One-way ANOVA, followed by Tukey’s post hoc multiple comparisons. In addition, the captured bean bugs to each treatment plot were compared separately by soybean area and edge area by conducting Two-way ANOVA, followed by Tukey’s post hoc multiple comparisons. All statistical tests were performed on GRAPHPAD PRISM 7. Figure layouts were designed and organized using Adobe Illustrator CC (2017, Adobe Inc., San Jose, CA, USA). The number of bean bugs recorded by camera trap was compared by One-way ANOVA, followed by Tukey’s post hoc multiple comparisons at the 0.05 significant level. All statistical tests for data from camera trapping were performed by Scipy 1.9.3 and Statsmodel 0.13.5 library, and figure layouts were designed with Matplotlib 3.6.2 and Seaborn 0.12.1 library in Python 3.8.0.
Results
Behavioral bioassay with synthetic volatile compounds
Behavioral bioassays using vertical airflow olfactometer were validated with mineral oil (Supplementary Figure 1b), commercial aggregation pheromone (Supplementary Figure 1c), and full-headspace extraction of soybean volatiles (Supplementary Figure 1d) as previously reported (Song et al. Citation2022). In addition, the bean bugs were attracted to 500 µg of synthetic volatile mixture B (Supplementary Figure 1e). More importantly, we found that the bean bugs showed a strong avoidance behavior to the potential synthetic soybean volatile mixture (SSV R) (; P-value = .017). Accordingly, we tested SSV R in a field environment to test its potential application as a repellent to push away the bean bugs from the soybean field, by placing it strategically with the strong attractant suggested in our previous study (Song et al. Citation2022).
Validation of push–pull strategy by sticky trapping
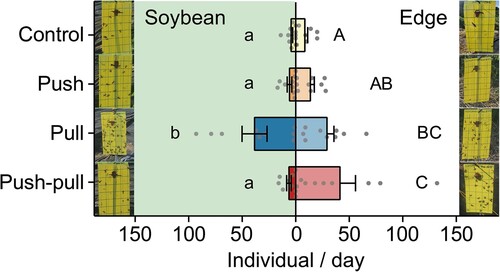
In total, five field experiments were conducted from August 22nd to September 22nd. However, some of the data (trials 1 and 2) were excluded from the analyses because both sticky traps and camera traps were heavily disturbed by unexpected monsoon shower events during this period. To examine our push–pull strategy in the field, we monitored the number of captured bean bugs in soybean plots with four different strategies (). Sticky trap monitoring was performed three times and 1329 individuals of bean bugs were captured in total (Supplementary Table 1). The captured bean bugs in each treatment were separately compared for soybean area and edge area, with the results represented using lowercase and capital letters, respectively (). In general, bean bugs were captured more in the edge area in all treatment plots than in the soybean area. Much more bean bugs were captured in plots where the only attractants were deployed (pull), compared to control and push plots (F3,32 = 4.136, P-value = .014, One-way ANOVA). Also, there was a significant difference in number of captured R. pedestris by treatment in both soybean and edge areas by treatments (F3,48 = 6.103, P-value = .001, Two-way ANOVA). Interestingly, in the push–pull treated plot, the number of bean bugs attracted to soybean area did not significantly differ from that attracted to control or push plot (P-value = .994 and .999, respectively, Two-way ANOVA, followed by Tukey’s post hoc multiple comparisons). In contrast, a difference between the number of bean bugs attracted to the edge area of the pull treatment plot and the push–pull treatment plot was not statistically significant (P-value = .383, Two-way ANOVA, followed by Tukey’s post hoc multiple comparisons).
Figure 4. Validation of push–pull strategy by sticky trapping. Average number of bean bugs (±SEM) to sticky traps in soybean and edge area of different treatment plots. Experiments were conducted three times for the whole experimental period. Much more individuals were attracted to edge area of pull and push–pull treatment plots, but the number of captured bean bugs in the soybean area of push–pull plot was remained as low as control and push treatment plots. Different letters on bars indicate statistically significant differences by Tukey’s post hoc multiple comparisons (P < .05).
Model training for video analyses
To analyze videos recorded by camera trap, we trained a deep learning-based object detection model, YOLOv7 (Wang et al. Citation2022). Four models were trained from 4 yolov7 pre-trained weights by transfer learning with 3100 preprocessed training images and options described in Supplementary Table 2. As shown in Supplementary Table 3, four models showed acceptable performance in all metrics: precision, recall, mAP@50, and mAP@50-95 (Supplementary Table 3 and Supplementary Figure 3B), and the model trained from yolov7-e6e outperformed the other three models, showing the precision of 0.971, recall of 0.980, mAP@50 of 0.991, and mAP@50-95 of 0.675. Thus, we further evaluated the model trained from yolov7-e6e qualitatively by comparing the numbers of objects that were manually counted by a researcher or automatically detected by the model in ten random-sampled images. A root mean squared error (RMSE) between the counted and detected numbers of objects of 0.837 supported the confidence of the model (Supplementary Table 4). Therefore, the model was utilized to extract the number of objects from each video recorded by the camera trap ().
Validation of push–pull strategy by camera trapping
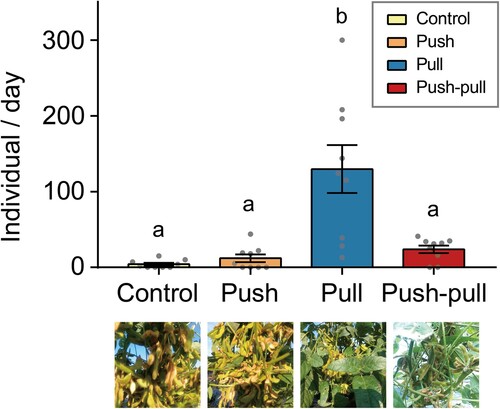
In total, 1527 bean bugs were detected in all camera traps by deep learning-based object detection model described in the previous section (Supplementary Table 1). Since the camera traps were equipped only in the soybean area of plots, we compared the population of bean bugs in the soybean area by treatments. The results showed a significant difference in the numbers of bean bugs captured in camera traps among different treatments (P-value < .001, repeated measure One-way ANOVA). In the push–pull treatment, the number of objects detected in the video is significantly lower than in the pull treatment (P-value < .001, repeated measure One-way ANOVA followed by Tukey’s post hoc multiple comparisons), while there is no statistically significant difference between the control, push, and push–pull treatments (P-value = .986, .956, .830, respectively, repeated measure One-way ANOVA followed by Tukey’s post hoc multiple comparisons) (). Therefore, the statistical results of camera trapping in the soybean were consistent with the results of sticky trapping.
Figure 5. Validation of push–pull strategy by camera trapping. Average number of bean bugs (±SEM) to camera traps in the soybean area of different treatment plots. Experiments were conducted three times for the whole experimental period. The number of captured bean bugs in the soybean area of push–pull plot was remained as low as control and push treatment plots, while was significantly lower than the number of bean bugs in the soybean area of pull plot. Different letters on bars indicate statistically significant differences by Tukey’s post hoc multiple comparisons (P < .05).
Discussion
In our study, the efficacy of strategic deployment of repellents with attractants was confirmed by the traditional sticky trap method and camera trap followed by recently emerging deep learning-based image analyses. A mixture of (Z)-3-hexenyl acetate and 4-ethylbenzaldehyde successfully manipulated the spatial distribution of the bean bugs by repelling them from soybean plants in the field conditions. Simultaneously, bean bugs were strongly attracted to sticky traps treated with a mixture of soybean volatile blend and synthetic aggregation pheromone. In the plot where only attractants were treated at the edge (Pull), the bean bugs were strongly attracted to soybean area, which might cause severe damage to soybean plants. This result highlights the need for a more efficient trapping system, as sticky traps used in this study and funnel traps used by Rahman et al. (Citation2018) resulted in a more severe infestation of bean bugs to soybean plants.
We did not observe any significant difference in the number of bean bugs observed between the control plot and the push–pull plot within the soybean area ( and ). This result could be attributed to the relatively low population density of bean bugs at that time. In cases where the local bean bug population is too low, it becomes challenging to discern a clear difference between control and push plot because the majority of bean bugs are attracted to traps lured with attractants, i.e. push–pull and pull plots. Additionally, it is possible that the mixture of soybean volatile blend and aggregation pheromone attracted the bean bugs so strongly, which affected the number of bean bugs attracted to adjacent control treatments (control and push). However, the ratio of attracted bean bugs to soybean area over the total number of attracted bean bugs to each treatment plot (Supplementary Table 1) reflects that the relatively more bean bugs were attracted to control and push plots than to push–pull plots. In addition, it might be more perceptive to assume that natural conditions without any treatments of soybean plot would be closer to a state of pull treatment than to that of control because bean bug communities consistently emit aggregation pheromone.
(E)-2-hexenyl hexanoate was first reported as an alarm pheromone in R. pedestris because it induced dispersive behavior of adults and nymphs for several minutes in closed captivity (Leal and Kadosawa Citation1992). A former study evaluated push–pull strategy to control bean bugs in soybean field with the incorporation of alarm pheromone and aggregation pheromone of the bean bug. Although the combination of alarm pheromone and aggregation pheromone is a common approach to control insect pest in agricultural environment (Kim et al. Citation2023), Rahman and Lim (Citation2017b) found that alarm pheromone of the bean bug, (E)-2-hexenyl hexanoate was not effective in repelling bean bugs when incorporated with the aggregation pheromone in soybean field during the pod maturation period. Interestingly, (E)-2-hexenyl hexanoate reduced the number of bean bugs when added to aggregation pheromone, but only from April to August. Similarly, Yasuda et al. (Citation2007) proposed a different role of this compound as a supplemental component of aggregation pheromone rather than an alarm pheromone, especially in October. In this study, structurally similar compounds, (E)-2-hexenyl (Z)-3-hexenoate and (E)-2-hexenyl (E)-2-hexenoate were included in the commercial aggregation pheromone blend. These two compounds do not seem to have a seasonally changing effect in attracting bean bugs because of its consistent effect in attracting the bean bugs in the field (Rahman and Lim Citation2017b).
This study represents that the specific blends of host plant semiochemicals can modify the spatial distribution of pest in field conditions. It is crucial to verify the efficacy of repellents in field conditions because field background odors can mask and disrupt attracting signals (Cai et al. Citation2017). The same principle applies to repellents as well. Field background odors can indeed affect the efficacy of bioactive volatiles and pheromones by either masking or enhancing effect (Schröder and Hilker Citation2008). For example, the existence of isoprene can dramatically lower the attraction of a parasitoid wasp, Diadegma semiclausum, to its prey-indicating herbivore-induced plant volatiles (HIPVs) (Loivamäki et al. Citation2008). In this study, we observed a reduction in the number of the bean bugs attracted to the soybean area in the push–pull plot, which suggests that field background odors have little effect on the efficacy of repellents ().
Formerly, (Z)-3-hexenyl acetate has been reported not to induce any behavioral responses especially when provided as a single compound to the bean bugs (Song et al. Citation2022). However, it is a common HIPV that induces priming or directly activating defense mechanisms across numerous plant taxa (Frost et al. Citation2008; Ameye et al. Citation2015; Xiao et al. Citation2023). The potential effect of (Z)-3-hexenyl acetate and 4-ethylbenzaldehyde inducing priming or direct defense mechanisms of adjacent soybean plants cannot be excluded in this study and needs to be investigated in further studies. Similarly, 4-ethylbenzaldehyde is one of the plant volatiles (Wang et al. Citation2014; Ren et al. Citation2020) that is bioactive to the bean bugs, yet does not induce any behavioral responses when provided alone (Song et al. Citation2022). Since a single compound or a subset of plant volatiles can increase predator attraction (Dicke and Baldwin Citation2010), we did not exclude the effect of putative repellents as a calling signal for predators of bean bugs. However, during the experimental period, we did not observe any other insects attracted to repellent or attractant-treated plots other than bean bugs via both trapping methods. Implementation of these chemicals also should be cautious as synthetic green leaf volatiles such as (Z)-3-hexenyl acetate can also induce adverse outcomes depending on plant species, causing retarded growth as a growth-defense tradeoff (Freundlich et al. Citation2021), which should be investigated in further research.
For more comprehensive monitoring, a camera trapping and deep learning-based video analysis were utilized to monitor the pest (i.e. R. pedestris) in the plant (i.e. soybean) in parallel with sticky trapping. Based on the consistency between the results of sticky trapping and camera trapping in the soybean area, we confirmed the validity of camera trapping method. The camera trapping could be more informative in pest monitoring since a video contains the spatio-temporal information of insects, while sticky trapping shows only the integrated number of insects along time and space axis. This additional information is crucial to optimize pest management regimes such as deciding the application timing of insecticide (Hall and Norgaard Citation1974). Furthermore, camera trapping could be considered as an easy-to-use trapping method because data acquisition and analysis are automated after equipping cameras. Camera traps also provide practical advantages such as low labor cost and time compared to traditional traps such as sticky traps (Preti et al. Citation2021). We also validated the application of mobile camera trapping by mounting the camera on a remote-controlled vehicle, which suggests the possibility of covering wider three-dimensional space per camera (Supplementary Figure 4). In addition, camera traps are highly versatile and can be adopted to monitor different types of pests. On the other hand, the scalability of deep learning-based video analysis still remains as a challenge of camera trapping method because the model can detect only the insects that were labeled and trained. To overcome this limitation, we suggest constructing a pre-trained object detection model that is trained in a large group of insects for practical usage.
In conclusion, this study shows the application of repellent mixture, (Z)-3-hexenyl acetate and 4-ethylbenzaldeyde as a part of a push–pull strategy in combination with a strong attractant mixture in the soybean field. We expect this push–pull strategy can be potentially applied in other economically important crops and fruit trees that are prone to damage by R. pedestris. Further studies need to optimize the effect of semiochemical-based push–pull strategy and pest monitoring to maximize cost–benefit of this practice. The development of push–pull based integrated pest management strategies to manipulate the pest behavior, combined with the deep learning-based pest monitoring should reduce environmental and economic costs for agricultural practices by alleviating insecticide application.
Declaration of interest
J. S. and S. K. have filed a patent application based on this work.
Ethics approval
This article does not contain any studies with human participants or animals performed.
Supplemental Material
Download Zip (9.5 MB)Acknowledgements
J. S., S. K., and T. J. designed experiments. J. S. conducted field bioassay; Y. P. and T. K. conducted video analyses; S. P. and T. J. provided materials; J. S., T. K., T. J., and S. K. wrote the manuscript; T. J. and S. K. conceived the project. All authors read and approved the manuscript.
Disclosure statement
No potential conflict of interest was reported by the author(s).
Data availability statement
Not applicable.
Additional information
Funding
References
- Aartsma Y, Bianchi FJJA, van der Werf W, Poelman EH, Dicke M. 2017. Herbivore-induced plant volatiles and tritrophic interactions across spatial scales. New Phytol. 216(4):1054–1063. doi:10.1111/nph.14475.
- Ameye M, Audenaert K, De Zutter N, Steppe K, Van Meulebroek L, Vanhaecke L, De Vleesschauwer D, Haesaert G, Smagghe G. 2015. Priming of wheat with the green leaf volatile Z-3-hexenyl acetate enhances defense against Fusarium graminearum but boosts deoxynivalenol production. Plant Physiol. 167(4):1671–1684. doi:10.1104/pp.15.00107.
- Bae SD, Kim HJ, Mainali BP. 2014. Infestation of Riptortus pedestris (Fabricius) decreases the nutritional quality and germination potential of soybean seeds. J Asia Pac Entomol. 17(3):477–481. doi:10.1016/j.aspen.2014.04.006.
- Cai X, Bian L, Xu X, Luo Z, Li Z, Chen Z. 2017. Field background odour should be taken into account when formulating a pest attractant based on plant volatiles. Sci Rep. 7(1):1–10. doi:10.1038/s41598-016-0028-x.
- Choi D, Kim K, Lim K. 2000. The status of spot damage and fruit piercing pests on yuzu (Citrus junos) fruit. Korean J Appl Entomol. 39(4):259–266.
- Cook SM, Khan ZR, Pickett JA. 2007. The use of push-pull strategies in integrated pest management. Annu Rev Entomol. 52:375–400. doi:10.1146/annurev.ento.52.110405.091407.
- Dicke M, Baldwin IT. 2010. The evolutionary context for herbivore-induced plant volatiles: beyond the ‘cry for help’. Trends Plant Sci. 15(3):167–175. doi:10.1016/j.tplants.2009.12.002.
- Dupuy F, Rouyar A, Deisig N, Bourgeois T, Limousin D, Wycke MA, Anton S, Renou M. 2017. A background of a volatile plant compound alters neural and behavioral responses to the sex pheromone blend in a moth. Front Physiol. 8:1–16. doi:10.3389/fphys.2017.00079.
- Endo N, Wada T, Nishiba Y, Sasaki R. 2006. Interspecific pheromone cross-attraction among soybean bugs (Heteroptera): does Piezodorus hybneri (Pentatomidae) utilize the pheromone of Riptortus clavatus (Alydidae) as a kairomone? J Chem Ecol. 32(7):1605–1612. doi:10.1007/s10886-006-9093-0.
- Freundlich GE, Shields M, Frost CJ. 2021. Dispensing a synthetic green leaf volatile to two plant species in a common garden differentially alters physiological responses and herbivory. Agronomy. 11(5):958. doi:10.3390/agronomy11050958.
- Frost CJ, Mescher MC, Dervinis C, Davis JM, Carlson JE, De Moraes CM. 2008. Priming defense genes and metabolites in hybrid poplar by the green leaf volatile cis-3-hexenyl acetate. New Phytol. 180(3):722–734. doi:10.1111/j.1469-8137.2008.02599.x.
- Hall DC, Norgaard RB. 1974. On the timing and application of pesticides. Am J Agric Econ. 56(3):644–645. doi:10.2307/1238624.
- Høye TT, Ärje J, Bjerge K, Hansen OLP, Iosifidis A, Leese F, Mann HMR, Meissner K, Melvad C, Raitoharju J. 2021. Deep learning and computer vision will transform entomology. Proc Natl Acad Sci U S A. 118(2):1–10.
- Kang CH, Huh HS, Park CG. 2003. Review on true bugs infesting tree fruits, upland crops and weeds in Korea. Korean J Appl Entomol. 42(3):269–277.
- Kim CY, Khan F, Kim Y. 2023. A push-pull strategy to control the western flower thrips, Frankliniella occidentalis, using alarm and aggregation pheromones. PLoS One. 18(2):1–18.
- Kim E, Lim UT. 2012. Fruits of apple and sweet persimmon are not essential food sources for Riptortus pedestris (Hemiptera: Alydidae) which causes fruit-spotting. J Asia Pac Entomol. 15(2):203–206. doi:10.1016/j.aspen.2011.12.001.
- Kim E, Park CG, Lim UT. 2014. Evaluation of three plant seeds as potential pre-season diets for Riptortus pedestris. J Asia Pac Entomol. 17(3):521–524. doi:10.1016/j.aspen.2014.04.013.
- Leal WS, Higuchi H, Mizutani N, Nakamori H, Kadosawa T, Ono M. 1995. Multifunctional communication in Riptortus clavatus (Heteroptera: Alydidae): conspecific nymphs and egg parasitoid Ooencyrtus nezarae use the same adult attractant pheromone as chemical cue. J Chem Ecol. 21(7):973–985. doi:10.1007/BF02033802.
- Leal WS, Kadosawa T. 1992. (E)-2-Hexenyl hexanoate, the alarm pheromone of the bean bug Riptortus clavatus (Heteroptera: Alydidae). Biosci Biotechnol Biochem. 56(6):1004–1005. doi:10.1271/bbb.56.1004.
- Lee GH, Paik CH, Choi M-Y, Oh Y-J, Kim D-H, Na S-Y. 2004. Seasonal occurrence, soybean damage and control efficacy of bean bug, Riptortus clavatus Thunberg (Hemiptera: Alydidae) at soybean field in Honam province. Korean J Appl Entomol. 43(3):249–255.
- Li K, Zhang X, Guo J, Penn H, Wu T, Li L, Jiang H, Chang L, Wu C, Han T. 2019. Feeding of Riptortus pedestris on soybean plants, the primary cause of soybean staygreen syndrome in the Huang-Huai-Hai river basin. Crop J. 7(3):360–367. doi:10.1016/j.cj.2018.07.008.
- Li W, Gao Y, Hu Y, Chen J, Zhang J, Shi S. 2021. Field cage assessment of feeding damage by Riptortus pedestris on soybeans in China. Insects. 12(3):2–13.
- Lim UT. 2013. Occurrence and control method of Riptortus pedestris (Hemiptera: Alydidae): Korean perspectives. Korean J Appl Entomol. 52(4):437–448. doi:10.5656/KSAE.2013.08.0.038.
- Loivamäki M, Mumm R, Dicke M, Schnitzler JP. 2008. Isoprene interferes with the attraction of bodyguards by herbaceous plants. Proc Natl Acad Sci. 105(45):17430–17435. doi:10.1073/pnas.0804488105.
- Mainali BP, Kim HJ, Yoon YN, Oh IS, Bae SD. 2014. Evaluation of different leguminous seeds as food sources for the bean bug Riptortus pedestris. J Asia Pac Entomol. 17(2):115–117. doi:10.1016/j.aspen.2013.11.007.
- Mainali BP, Lim UT. 2012. Annual pattern of occurrence of Riptortus pedestris (Hemiptera: Alydidae) and its egg parasitoids Ooencyrtus nezarae Ishii and Gryon japonicum (Ashmead) in Andong, Korea. Crop Prot. 36:37–42. doi:10.1016/j.cropro.2012.01.016.
- Mizutani N, Yasuda T, Yamaguchi T, Moriya S. 2007. Individual variation in the amounts of pheromone components in the male bean bug, Riptortus pedestris (Heteroptera: Alydidae) and its attractiveness to the same species. Appl Entomol Zool. 42(4):629–636. doi:10.1303/aez.2007.629.
- Numata H, Kon M, Hidaka T. 1990. Male adults attract conspecific adults in the bean bug, Riptortus clavatus THUNBERG (Heteroptera: Alydidae). Appl Entomol Zool. 25(1):144–145. doi:10.1303/aez.25.144.
- Park YH, Choi SH, Kwon YJ, Kwon SW, Kang YJ, Jun TH. 2023. Detection of soybean insect pest and a forecasting platform using deep learning with unmanned ground vehicles. Agronomy. 13(2):477. doi:10.3390/agronomy13020477.
- Preti M, Verheggen F, Angeli S. 2021. Insect pest monitoring with camera-equipped traps: strengths and limitations. J Pest Sci. 94(2):203–217. doi:10.1007/s10340-020-01309-4.
- Rahman MM, Kim E, Kim D, Bhuyain MMH, Lim UT. 2018. Use of aggregation pheromone traps increases infestation of adult Riptortus pedestris (Hemiptera: Alydidae) in soybean fields. Pest Manag Sci. 74(11):2578–2588. doi:10.1002/ps.5046.
- Rahman MM, Lim UT. 2017a. Evaluation of mature soybean pods as a food source for two pod-sucking bugs, Riptortus pedestris (Hemiptera: Alydidae) and Halyomorpha halys (Hemiptera: Pentatomidae). PLoS One. 12(4):1–16. doi:10.1371/journal.pone.0176187.
- Rahman MM, Lim UT. 2017b. Evaluation of aggregation and alarm pheromones of Riptortus pedestris (Hemiptera: Alydidae) as a push–pull strategy in soybean fields. Appl Entomol Zool. 52(3):469–479. doi:10.1007/s13355-017-0498-8.
- Ren X, Wu S, Xing Z, Gao Y, Cai W, Lei Z. 2020. Abundances of thrips on plants in vegetative and flowering stages are related to plant volatiles. J Appl Entomol. 144(8):732–742. doi:10.1111/jen.12794.
- Scheirs J, De Bruyn L, Von Tschirnhaus M. 1997. Comparison of different trapping methods in Agromyzidae (Diptera). J Appl Entomol. 121(8):429–433. doi:10.1111/j.1439-0418.1997.tb01430.x.
- Schröder R, Hilker M. 2008. The relevance of background odor in resource location by insects: a behavioral approach. Bioscience. 58(4):308–316. doi:10.1641/B580406.
- Song J, Lee G, Jung J, Moon JK, Kim SG. 2022. Effect of soybean volatiles on the behavior of the bean bug, Riptortus pedestris. J Chem Ecol. 48(2):207–218. doi:10.1007/s10886-021-01343-1.
- Switzer PV, Enstrom PC, Schoenick CA. 2009. Behavioral explanations underlying the lack of trap effectiveness for small-scale management of Japanese beetles (Coleoptera: Scarabaeidae). J Econ Entomol. 102(3):934–940. doi:10.1603/029.102.0311.
- Wang C, Bochkovskiy A, Liao HM. 2022. YOLOv7: trainable bag-of-freebies sets new state-of-the-art for real-time object detectors. arXiv Preprint ArXiv. 2207:02696.
- Wang P, Zhang N, Zhou LL, Si SY, Lei CL, Ai H, Wang XP. 2014. Antennal and behavioral responses of female Maruca vitrata to the floral volatiles of Vigna unguiculata and Lablab purpureus. Entomol Exp Appl. 152(3):248–257. doi:10.1111/eea.12216.
- Webster B, Gezan S, Bruce T, Hardie J, Pickett J. 2010. Between plant and diurnal variation in quantities and ratios of volatile compounds emitted by Vicia faba plants. Phytochemistry. 71(1):81–89. doi:10.1016/j.phytochem.2009.09.029.
- Wei Z, Guo W, Jiang S, Yan D, Shi Y, Wu B, Xin X, Chen L, Cai Y, Zhang H, et al. 2023. Transcriptional profiling reveals a critical role of GmFT2a in soybean staygreen syndrome caused by the pest Riptortus pedestris. New Phytol. 237:1876–1890. doi:10.1111/nph.18628.
- Xiao Y, Qian J, Hou X, Zeng L, Liu X, Mei G, Liao Y. 2023. Diurnal emission of herbivore-induced (Z)-3-hexenyl acetate and allo-ocimene activates sweet potato defense responses to sweet potato weevils. J Integr Agric. 22(6):1782–1796. doi:10.1016/j.jia.2023.02.020.
- Yasuda T, Mizutani N, Endo N, Fukuda T, Matsuyama T, Ito K, Moriya S, Sasaki R. 2007. A supplemental component of attractive aggregation pheromone in the bean bug, Riptortus clavatus (Thunberg) (Heteroptera: Alydidae). Appl Entomol Zool. 42(1):161–166. doi:10.1303/aez.2007.161.
- Zhang QH, Schneidmiller RG, Hoover DR, Zhou G, Margaryan A, Bryant P. 2014. Essential oils as spatial repellents for the brown marmorated stink bug, Halyomorpha halys (Stål) (Hemiptera: Pentatomidae). J Appl Entomol. 138(7):490–499. doi:10.1111/jen.12101.