
ABSTRACT
A complete reconstruction of the history regarding the distribution of a species requires a separate analysis of the events before and after colonizing the current distribution. In a freshwater species, the historical pattern of linkages between water systems, as an event before colonization, can be determined by examining the phylogenetic relationship between the populations from different drainages. Given the insular nature of freshwater systems, on the other hand, intra-population genetic diversity is largely related to the effective sizes of the first colonizing populations and the habitat capacities. This study analyzed the genetic diversity and structure of Rhodeus sinensis, a freshwater acheilognathid inhabiting the southern and western parts of the Korean Peninsula using two mitochondrial and twenty microsatellite loci. Korean R. sinensis appears to have originated from mainland China along the paleo-Yellow river across the vast continental shelf of the Yellow Sea and first colonized the west coast of the Korean Peninsula, based on phylogenetic data obtained from mitochondrial loci. These west coast populations have remained relatively small, and populations that migrated south appear to have thrived in the southwestern part of the peninsula, where the populations thereby displayed relatively high genetic diversity. Southern populations appear to have been formed by the movement of relatively small numbers following geological fluctuations, which likely have left traces of genetic drift throughout history, as also reflected in our results. The population of this species on the southeast coast of the peninsula appears to have been established by anthropogenic translocation.
Introduction
The distribution of a species is a by-product of biogeographical dispersal in response to past climate change and adaptation to newly colonized habitats (Thomas Citation2010). A complete reconstruction of the history associated with the distribution of a species requires a separate analysis of the events before and after colonizing the current distribution. The genetic data from different classes should be used to accomplish this. By studying the phylogenetic relationship among populations of a particular species and closely related species, it is possible to reveal the origin and dispersal pathways of the species (Avise et al. Citation1987). Quantifying genetic diversity of populations or lineages provides information on the historical demographic pattern since the events of colonization (Austerlitz et al. Citation1997; Avise Citation2000; Crawford and Whitney Citation2010).
In a freshwater system, climate change is not simply a unique historical issue to be considered as a trigger for many species to spread out in search of new niches. Decreases in global temperature have been accompanied by lower sea levels, greatly expanding the total area of the freshwater system (Lambeck and Chappell Citation2001; Clark and Mix Citation2002; Lambeck et al. Citation2014). Consequently, the areas of shallow seas have often formed huge lakes or rivers, which may have served as pathways for the migration of freshwater fish species by connecting rivers currently isolated by the sea (Unmack et al. Citation2013; Zúñiga-Vega et al. Citation2014). The historical connections between drainages that do not currently exist can be determined by examining the phylogenetic relationship between the populations from different water systems. Even in the absence of historical inter-drainage confluence formation, gene flow between spatially separated water systems can occur through events, such as watershed capture due to geological fluctuations (Lima et al. Citation2017; Jeon et al. Citation2018) or anthropogenic introduction (Kwan et al. Citation2014; Baltazar-Soares et al. Citation2020). Given the insular nature of freshwater systems, the level of population genetic diversity within drainages is largely related to the effective sizes of the first colonizing populations and the environmental factors, such as habitat capacity (Pavlova et al. Citation2017; Martinez et al. Citation2018; Bernos et al. Citation2023). Watershed capture or anthropogenic introduction only allowed relatively fewer individuals to migrate than inter-drainage confluence formations through sea level fluctuations, likely generating a greater potential for a genetic bottleneck in newly formed populations (McCall and Fluker Citation2021).
The Yellow Sea is a gulf area located on the eastern edge of the Eurasian continent, surrounded by the Korean Peninsula and mainland China. Because the large continental shelf extending from the lands occupies most of this sea, the water depth is low (<100 m) throughout most of its area (Yang and Liu Citation2007), and the seafloor topography has been exposed frequently to sea level fluctuations in response to the historical repetition of warm and cold climates during the Pleistocene (Wageman et al. Citation1970; Park Citation1992; Yi and Saito Citation2004; Kong et al. Citation2006). The exposed seafloor topography of the continental shelf may have served as a link connecting rivers in China, such as the paleo-Yellow River, which flowed east through the middle of China, with rivers flowing to the west coast of the Korean Peninsula (Song et al. Citation2010; Jeon and Suk Citation2014; Jang et al. Citation2017; Kwan et al. Citation2018). Considering the species composition of freshwater fish, various species migrated from the Eurasian continent through the Yellow Sea and colonized the rivers flowing to the west coast of the Korean Peninsula (Won et al. Citation2020; Jeon et al. Citation2022; Hu et al. Citation2023). In addition, the Yellow Sea frequently or intermittently formed confluences allowing gene flow between rivers flowing to the west coast of the peninsula (Jeon and Suk Citation2014; Won et al. Citation2020; Jeon et al. Citation2022). Because the continental shelf is relatively small on the southern coast (Park et al. Citation1996), it is unlikely that the rivers flowing south had less chance of gene flow through sea level fluctuations.
This study analyzed the genetic diversity and structure of Rhodeus sinensis, a freshwater bitterling (Acheilognathidae) that inhabits the southern and western parts of the Korean Peninsula, by the analysis of two mitochondrial and 20 microsatellite loci. Bitterlings are well known for their unusual reproductive ecology, in which females deposit the eggs inside freshwater mussels, typically Unionidae, and males spray the sperm into the inhalent current of the mussels, thereby fertilizing the eggs (Barnes et al. Citation1936). R. sinensis also exists in China (Akai and Arai Citation1998; Chang et al. Citation2014). Korean R. sinensis was known as a Korean endemic species under the name R. uyekii until recently. Nevertheless, it is now regarded as the synonym of Chinese R. sinensis, based on the results of recent studies (Akai and Arai Citation1998; Chang et al. Citation2014). Given its distribution, it can be assumed that Korean R. sinensis originated from mainland China, settled around the west coast of the Korean Peninsula, and later expanded its distribution to the southeast. R. sinensis is the species with the widest distribution among bitterlings on the Korean Peninsula, distributed throughout most rivers in the western and southern regions (Kim and Park Citation2002). On the other hand, the genetic structure of this species has not been reported at the population level to prove this assumption.
Our study was designed to achieve three objectives. First, our genetic analysis tested whether the continental shelf and historical repetition of warm and cold climates during the Pleistocene shaped the distribution and structure of the R. sinensis populations during the proliferating process of freshwater species from continental to distal. There had probably been direct connections allowing potential active gene flow between rivers flowing down the west coast, and R. sinensis may have dispersed along the continental shelf to the southwest part of the peninsula. Our study attempted to find genetic and phylogenetic traces related to these biogeographic processes. Second, populations distributed in rivers flowing down the southern coast, where the continental shelf is not well-developed, may have originated from relatively small levels of gene flow without ancient confluence. Our genetic analysis tested wheter these populations are more likely to exhibit low levels of genetic diversity and the signatures of genetic drift than the populations of west coastal rivers. Finally, our results were compared with the results of previous genetic studies of other Rhodeus species with similar geographic distributions to R. sinensis, R. notatus (Won et al. Citation2020), and R. pseudosericeus (Jeon and Suk Citation2014; Won et al. Citation2021), which partially corroborated the assumptions related to the continental shelf and sea level changes.
Materials and methods
Sample collection and DNA isolation
Two hundred and fifty-five Rhodeus sinensis individuals were collected from eight localities throughout the Korean Peninsula between 2012 and 2015 (; Table S1). The samples for genetic analysis were prepared by cutting a fin-clip (2 × 2 mm) from the tip of the caudal fin that can be regenerated (Uemoto et al. Citation2020). All individuals were released to the site where they were collected. The fin-clips were transferred to the laboratory and stored in 95% ethanol at −20 °C until DNA isolation. The genomic DNA was isolated using a Wizard Genomic DNA purification kit (Promega). Sample collections were performed in strict accordance with the Inland Water Fisheries Act and Wildlife Protection and Management Act of the Republic of Korea.
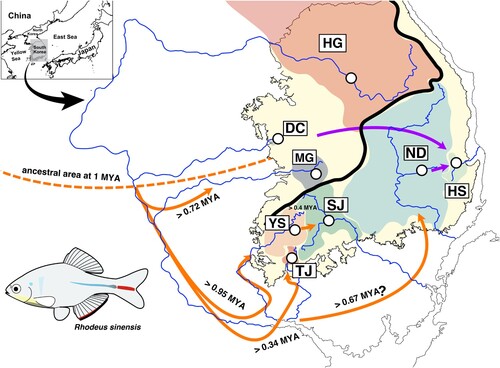
Figure 1. The sampling locations of Rhodeus sinensis (see for the details of the locations) and the spatiotemporal pattern of its ancestral populations. Black dash lines represent the lowest sea level (−125 m) at the last glacial maximum, and blue lines indicate the paleo-drainage systems, both of which were reconstructed based on the bathymetric information extracted from the digital elevation model implemented in ArcGIS (see Materials and Methods for the details). Orange dashed line represents the limit of ancestral distributions for the ancestral R. sinensis around 1 MYA (million years ago). Orange solid and purple lines indicate the inferred colonization pathways of ancestral populations and the inferred event(s) of anthropogenic introductions, assumed based on our results.
Mitochondrial sequencing and haplotype analysis
Two mitochondrial loci, cytochrome b (cyt b) and cytochrome oxidase subunit I (COI), were amplified using previously reported primers (Brito et al. Citation1997; Perdices et al. Citation2004; Ivanova et al. Citation2007). Amplification was performed in a 25 μL reaction volume containing 1 μL of 30–50 ng of genomic DNA, 2.5 μL of reaction buffer, 0.25 μM of each dNTP, 0.3 μM of each primer, 1 unit of Taq polymerase (Solgent) and 19.93 μL of water. Amplification was carried out using GenePro (Bioer) under the following thermal cycling profile: initial denaturation at 94 °C for 3 min, 30 cycles of denaturation at 95 °C for 1 min, annealing at 56 °C for 1 min, extension at 72 °C for 1 min, and final extension at 72 °C for 10 min. The PCR products were loaded on 1.5% agarose gels to visualize the products for the checking of quality. Successful products were purified using Wizard Genomic DNA purification kit (Promega) and sequenced by Genotech (Daejeon, South Korea) on an ABI3730XL (Applied Biosystems) with BigDye Terminator 3.1 Cycle Sequencing Kit (Applied Biosystems).
All mitochondrial sequences were checked using BLAST searches and edited using GENEIOUS v 9.1.8 (Kearse et al. Citation2012). Alignments were performed using ClustalX (Thompson et al. Citation1994) implemented in GENEIOUS. All haplotypes characterized were sorted using DnaSP v 5.1 (Librado and Rozas Citation2009). All novel haplotype sequences found in this study were deposited in the NCBI GenBank (cyt b: OR496837 – OR496873, COI: OR485643 – OR485661).
Phylogenetic structure
The genetic diversity indices (Nei Citation1987) of the two mitochondrial loci, including the number of haplotypes (h), haplotype diversity (hd), and nucleotide diversity (π), were calculated using DnaSP. The unrooted haplotype network was generated for each locus and the sequences generated by concatenating the two loci (hereafter ‘cyt b + COI’) based on the connection limit above 0.95 probability using TCS 1.2 (Clement et al. Citation2000). The cyt b haplotypes were used to reconstruct phylogenetic trees based on Bayesian inference (BI) algorithms performed using MrBayes v 3.1.4 (Ronquist et al. Citation2012). GTR + I + G was determined as the best-fitting substitution model according to Akaike Information Criterion (AIC; Akaike Citation1974) using jModelTest V 2 (Darriba et al. Citation2012). Four independent runs of Markov chain Monte Carlo (MCMC) were performed under 40 million generations, with sampling every 1,000th step. The convergence between runs was determined based on whether the effective sample sizes (ESSs) reached more than 200 using TRACER v 1.7 (Rambaut et al. Citation2018). The node confidence was provided with the Bayesian posterior probabilities. The nodes with low values (<50% or 0.5) for both algorithms collapsed. FigTree v 1.4.2 was used to visualize the topology of a consensus tree.
The divergence time between the lineages was estimated using BEAST v 2.3.0 (Bouckaert et al. Citation2014) on cyt b. Two independent runs were performed based on 40 million MCMC generations with sampling every 1,000 generations under GTR + I + G and a strict clock model with known substitution rates in cyprinids (1% per million years; Zardoya and Doadrio Citation1999). The molecular clock was calibrated using the fossil record data of Acheilognathidae (Yasuno Citation1984) for the basal node in the tree and Tanakia lanceolata (Tomoda Citation1977) for node clustering Rhodeus and Tanakia. The final consensus tree with maximum clade credibilities was generated, after discarding the first 25% of trees as a burn-in using TreeAnnotator v 2.3.0 (Bouckaert et al. Citation2014). The node credibilities of the consensus tree were evaluated using the posterior probabilities. TRACER was used to determine if the ESSs exceeded 200 and the MCMC parameters of runs converged on the same stationary point with a unimodal distribution. The geographic regions where the common ancestors of R. sinensis populations and the sister species were distributed were estimated using the dispersal-extinction-cladogenesis (DEC) model, which was implemented in RASP (Reconstruct Ancestral State in Phylogenies; Yu et al. Citation2015). Nine areas, including China and eight Korean drainages collected in this study, were coded to calculate the likelihood of each area being the distributional region of the common ancestor corresponding to the nodes of the time-calibrated consensus tree produced by BEAST analysis. This analysis was conducted under the JC model with the default parameters.
Demographic history
The mitochondrial loci were used to find the best approximation regarding the pattern of the demographic history for each R. sinensis population based on the three following approaches. First, Fu’s FS (Fu Citation1997) and Tajima’s D (Tajima Citation1989) statistics were calculated under the coalescent model using ARLEQUIN 3.5 (Excoffier and Lischer Citation2010) using each mitochondrial locus and ‘cyt b + COI’. Second, mismatch distribution analysis (MMD; Rogers and Harpending Citation1992) was performed using ARLEQUIN by examining whether the observed distribution of pairwise differences between haplotype sequences deviated from the predicted pattern using ‘cyt b + COI’ to identify the statistically significant signature of historical population expansion. Finally, extended Bayesian skyline plot (EBSP) analysis (Drummond et al. Citation2012) was used to describe the historical changes in the ESSs under the HKY model and strict-clock model with a constant mutation rate (1% per million years; Zardoya and Doadrio Citation1999) using ‘cyt b + COI’. EBSP analysis was performed for 40 million generations with sampling every 1,000 steps; the first 25% were discarded as burn-in. TRACER was used to assess the convergence between runs by examining whether ESSs exceeded 200.
Microsatellite genotyping
All 255 individuals used in the mitochondrial analysis were genotyped using 20 previously reported microsatellite primer sets (Supplementary Table 2). The 5’ end of each forward primer was labeled fluorescently with either 6-FAM, VIC, NED, or PET (Applied Biosystems). PCR amplification was performed in a mixture of the same composition as that used for mitochondrial analysis under the following thermal cycling profile: initial denaturation at 95 °C for 5 min, 35 cycles of denaturation at 95 °C for 30 sec, annealing at 54–58 °C for 30 sec, extension at 72 °C for 45 sec, and a final extension at 72 °C for 10 min. The fluorescently labeled PCR products were genotyped on an ABI 3730xl Genetic Analyzer by Macrogen (Seoul, South Korea) and scored using GeneMapper 3.7 (Applied Biosystems). The allele size was determined using Peak Scanner 1.0 (Applied Biosystems).
Intrapopulation diversity
The average number of alleles per locus (A), allelic richness (AR), heterozygosity observed (HO) and expected (HE), and fixation index (FIS) were quantified using ARLEQUIN and GenAlEx v 6.503 (Peakall and Smouse Citation2012). The likelihood of a recent bottleneck was tested for each population using Bottleneck v 1.273 (Piry et al. Citation1999) by checking whether significant excess of expected heterozygosity quantified under the mutation-drift equilibrium relative to expected heterozygosity quantified under Hardy-Weinberg equilibrium existed based on the Wilcoxon sign-rank test under three different microsatellite mutation models, infinite alleles model (IAM), stepwise mutations model (SMM), and two-phase model (TPM) with a setting of 70% SMM and 30% IAM. Bottleneck was also used to determine if there was a marked deviation from the typical L-shaped distribution of the allelic frequencies that often occurs when the population has recently undergone a significant size reduction. The likelihood of a historical population decline was checked based on whether the M-ratio, the mean ratio of the number of alleles to the range in the allele size, was significantly lower than the commonly used threshold level, 0.68 (Garza and Williamson Citation2001). The critical significance values of all statistics used were adjusted for multiple comparisons based on the Bonferroni procedure.
Population structure
Three different analyses were applied to detect the genetic structure among the populations of R. sinensis. First, the pairwise-FST and -RST were quantified among the populations using ARLEQUIN. Second, STRUCTURE v 2.3.4 (Pritchard et al. Citation2000) was used to examine the pattern of population structuring under the Bayesian framework. The most likely numbers of genetically different clusters (K) of R. sinensis populations were predicted by ΔK statistics (Evanno et al. Citation2005) implemented in STRUCTURE HARVESTOR v0.6.94 (Earl and vonHoldt Citation2012). STRUCTURE analysis was performed for each K (2–8), with 20 independent MCMC runs, each consisting of 2 × 10⁶ generations after discarding 10% as burn-in. Finally, principal component analysis (PCA) was performed using GenAlEx to visualize the relationship among populations at the individual level in 2-dimensional space. The critical significance values of all statistics used were adjusted for multiple comparisons based on the Bonferroni procedure.
One population, HS, is located on the east coast of the Korean Peninsula. Because Acheilognathidae has not been reported on the east coast of this peninsula until relatively recently, it is necessary to determine if it is a population formed by anthropogenic introduction (Kim and An Citation2010). NewHybrids v 1.1 (Anderson and Thompson Citation2002) was thus used to identify the origin(s) and the level of admixture in this population (due to the potential origin from multiple populations). The parameters were set to MCMC of 10 generations after discarding the first 10% as burn-in.
Reconstruction of paleo-drainages
The paleo-drainage structure around the Korean Peninsula during the Last Glacial Maximum (LGM) was reconstructed from the bathymetric information extracted from the digital elevation model (DEM) using the hydrological implemented in ArcGIS10 (). A 30-arc-second resolution (c. 1 km) of the General Bathymetric Chart of the Oceans (GEBCO, http://www.gebco.net/) was used as an input file. The sea level at LGM entered was 125 m, combining the results of previous studies (Elias et al. Citation1996). The watershed areas of paleo-drainages were delineated and extracted using the steps presented in a previous study (Thomaz et al. Citation2015). The sea level at LGM was determined using the Contour tool after masking the area around the Korean Peninsula using the Mask tool. The basin borders and flow direction were identified using the tools, Fill, Flow direction, and Basin. Paleo-drainages system for the masked areas was reconstructed using the Stream order tool.
Results
Mitochondrial analysis
Thirty-seven cyt b and 19 COI haplotypes were discovered from the analysis of 255 Rhodeus sinensis individuals. Among them, nine cyt b haplotypes were observed from at least two populations. In contrast, no COI haplotype was shared between populations, except for the population HS, which had the haplotypes of populations MG and ND. Population HS consisted of the cyt b haplotypes of populations HG, DC, MG, and ND. Haplotype network analysis showed that the haplotypes from the same population tended to be clustered closely together (). From Bayesian phylogenetic analysis using cyt b data, Rhodeus species were likely divided into three major clades, R. sinensis, R. smithii group (R. notatus, R. atremius, R. fangi, and R. suigensis) and R. ocellatus complex (). All Korean R. sinensis populations were resolved to form a single monophyly (). On the other hand, Korean and Chinese (AB366522) R. sinensis did not form complete monophyly. The Korean populations even showed a closer phylogenetic affinity to R. amurensis, which raises the suspicion that R. sinensis may be a species complex (). In the cyt b data, no distinct phylogenetic divisions between the west and south coastal populations were found, and the haplotypes of populations HG and DC were found in multiple clades ().
Figure 2. (a) Ancestral distributions of Rhodeus sinensis populations reconstructed based on the two loci of mitochondrial haplotypes (‘cyt b + COI’); the phylogenetic tree for the ancestral area reconstruction was inferred using BEAST with the fossil calibration points for the major clades, and the outgroups were trimmed out to obtain the visual clearance. (b) Median-joining network analysis of R. sinensis haplotypes estimated using ‘cyt b + COI’; the numbers on the branches in the network represent the mutation steps.
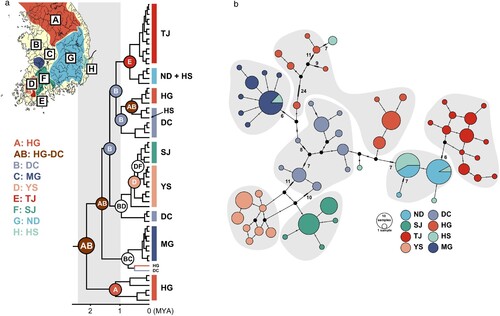
Figure 3. Divergence time estimation of Rhodeus sinensis populations analyzed based on cyt b sequences. The blue shade represents the R. sinensis group, while the green shade indicates the R. smithii group that shows the sister relationship. R. ocellatus group are located at the basal placement in this phylogenetic tree.
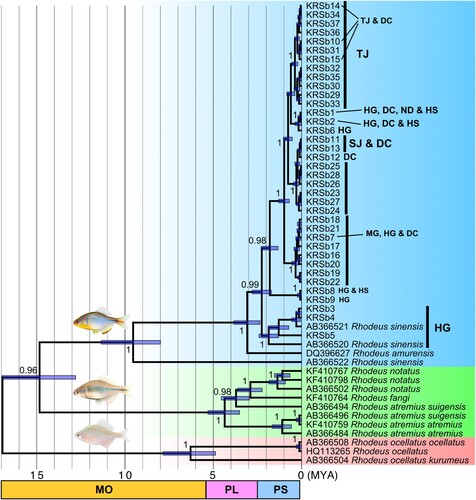
Based on cyt b data, the common ancestor of R. sinensis and R. smithii group diverged from the R. ocellatus complex at approximately 17 MYA (). The R. sinensis and R. smithii groups likely diverged at around 15 MYA (). It was estimated that R. sinensis was geographically separated from Chinese R. sinensis and R. amurensis at around 10 and 3 MYA, respectively, and began to distribute in the freshwater systems on the Korean Peninsula (). Considering such a phylogenetic pattern, R. sinensis likely colonized the Korean Peninsula for the first time around the Han River region at approximately 2 MYA. Subsequently, they took over the MG area and the southwest coastal corner by dispersing south (). The BEAST results indicated that colonization at the population level occurred after 0.6 MYA (late Pleistocene; ). s-DIVA analysis showed that the geographical locations of the common ancestors of the major clades were found to be HG and DC, indicating that multiple dispersal routes may have formed from the population(s) located around the Han River and the south ().
Fu's Fs and Tajima's D analysis yielded slightly different results of population demographic patterns depending on the mitochondrial loci. An analysis of the cyt b revealed the signatures of historical expansion in only two populations, MG and TJ (Supplementary Table 1). From COI analysis, the signatures of population expansion were observed in the DC, SJ, TJ, and ND populations (Supplementary Table 1). Giving high reliability for these estimates was difficult because the haplotype diversity of COI was low at the population level. Traces of historical expansion were found in populations MG, TJ, and ND when both mitochondrial loci were considered simultaneously (Supplementary Table 1). In mismatch distribution analysis, a unimodal distribution showing the historical expansion of the population was observed in populations MG, SJ, TJ, and YS (Supplementary Figure 1). Despite its multimodal pattern, population ND showed a distribution close to unimodal (Supplementary Figure 1). Populations HG and DC showed a perfect multimodal distribution pattern, confirming the existence of several isolates that may have been the beginning of a dispersal route to other regions, given that they are phylogenetically close to other populations (Supplementary Figure 1). Population HS showed a distinct multimodal distribution pattern, suggesting immigration originating from several different populations (Supplementary Figure 1). In the EBSP analysis, the signature of historical population size expansion was observed in populations MG, SJ, TJ, and YS (Supplementary Figure 2). As predicted from mismatch distribution analysis, a distinct increase pattern was not observed in the HG and DC populations (Figure S4). Populations ND and HS showed a sharp increase relatively recently, with no statistical signature of a historical increase (Supplementary Figure 2).
Microsatellite analysis
Extensive microsatellite polymorphism was detected at the twenty loci genotyped. For example, the observed number of alleles at a locus ranged from nine (RC741) to 60 (RY73), and HE ranged from 0.168 (RC741) to 0.690 (RY73; Table S2). Significant departure from HWE was detected at two loci (RY73 and RY414; Supplementary Table 1) due to the heterozygote deficiency in several populations (data not shown). No significant deviation from HWE was observed at the population level (). Three populations located around the southwest tip of the Korean Peninsula, MG, TJ, and YS, exhibited a higher level of genetic diversity than the others (; Mann–Whitney U: P < 0.05 for all indices). In the heterozygosity excess test or mode-shift examination analyzed using BOTTLENECK, the signature of the contemporary bottleneck did not appear in any population (data not shown). On the other hand, an estimation of the M-ratio gave insight into the historical growth and decline of R. sinensis populations. Populations HG, DC, SJ, and HS appear to have undergone historical population size declines with values below 0.68. The three populations with high genetic diversity, MG, TJ, and YS, exhibited relatively high M-ratio values ().
Table 1. Genetic diversity indices estimated from the analysis of twenty microsatellites for the eight Rhodeus sinensis populations.
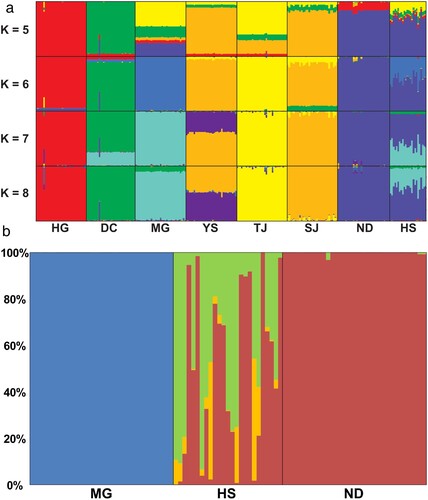
The pairwise-FST was 0.356–0.714 (mean = 0.531), and the pairwise-RST was 0.295–0.876 (mean = 0.674), indicating that the degree of genetic differentiation between populations was relatively high overall (Supplementary Table 3). The eight populations were allocated into six genetic clusters (best K = 6) based on the results of K statistics using STRUCTURE HARVESTER, indicating that each population has distinctive genetic characteristics (Supplementary Figure 4). From a more conservative point of view at K = 3, the STRUCTURE results were generally divided into three groups, HG-DC-MG, YS-TJ-SY, and ND-HS, in relation to the geographical location ((a)). Populations YS-SJ and ND-HS were noted because they existed in the same cluster, even at different K values ((a)). In PCA analysis, the first principal component (PC; 17.04%) showed similar results to the STRUCTURE analysis results at K = 3, but only the HG population was clearly separated in the second PC (13.73%; Supplementary Figure 3). In the present STRUCTURE and PCA results, population HS appeared to be the closest genetically to population ND, and shared some genetic traits with population MG, but not as much as ND ((a); Supplementary Figure 3). In NewHybrids analysis, 11 out of 24 individuals had similar genetic characteristics to that of population ND individuals, and the remaining individuals exhibited a pattern of a genomic admixture ((b)). On the other hand, none of the individuals from population HS possessed the genetic characteristics of individuals in the population MG ((b)).
Figure 4. (a) Population structure of Rhodeus sinensis populations that was estimated using STRUCTURE analyses at K (cluster number) of 5–8 in descending order. (b) Contemporary genomic admixture analysis of population HS to discover the populational origin. Based on this analysis, population HS was at least partially originated from population ND. Each color bar represents posterior probability of individual ancestry, in which orange and green indicates the potential hybrid generations between populations (green: backcross, orange: F2).
Discussion
In the robust phylogenetic data, the Korean Rhodeus sinensis populations were monophyletic, and the sister shared a recent common ancestry with R. amurensis occurring in the Russian Amur River. The clade to which R. sinensis belongs and the R. smithii group appeared to have differentiated in the middle Miocene (15 MYA) when the global temperature dropped sharply (Flower and Kennett Citation1994). A decline in sea levels accompanied the middle Miocene climate transition to such an extent that mainland China, the Korean Peninsula, and the Japanese Archipelago were connected (Noda Citation2004; Collins et al. Citation2018). A recent study suggested that the common ancestor of acheilognathid species may have originated in the Japanese Archipelago, based on the abundance of endemic bitterling species (Kawamura et al. Citation2014). Assuming that this hypothetical estimation is correct, a common ancestor of R. sinensis, which diverged from species of the R. smithii group abundant in the Japanese Archipelago in the middle Miocene, would have dispersed into the paleo-Yellow region, as supported by s-DIVA analysis. On the other hand, the biogeographic origin or dispersion of acheilognathid species distributed in East Asia is expected to become clear only when comprehensive sampling and phylogenetic studies based on substantial genetic information are performed.
Based on the phylogenetic data, the common ancestor of R. amurensis and Korean R. sinensis was distributed in the paleo-Amur and paleo-Yellow rivers. It is presumed that the Liao River in China flowing into the present Yellow Sea was, at least intermittently, connected to the paleo-Amur River until the late Pleistocene (Qiu et al. Citation2012; Xu et al. Citation2014). R. amurensis and Korean R. sinensis appear to have been differentiated from the Late Pliocene (3 MYA), based on the phylogenetic data. In the present study, Chinese R. sinensis diverged during Pliocene warming from the group of Korean R. sinensis and R. amurensis. It is difficult to draw clear conclusions from only the single Chinese R. sinensis used in this analysis. A clearer phylogenetic estimation will be possible if sampling and direct genetic information of Chinese R. sinensis are obtained from various regions.
s-DIVA analysis suggested that Korean R. sinensis was differentiated from R. amurensis in the Late Pliocene or Early Pleistocene and appeared to be distributed around populations HG (Han River) and DC (Daecheon River) for the first time on the Korean Peninsula. Considering that the haplotypes of populations HG and DC were distributed across several clades in phylogenetic analysis, and there was no graphic pattern of population growth by mismatch distribution analysis or EBSP analysis, these two populations were presumed to have consisted of small and isolated subpopulations. The reason that the populations in this area were fragmented without growing was probably due to environmental factors at the time of colonization, which can only be judged strictly through genetic comparisons with other freshwater fish species distributed widely on the Korean Peninsula. In the case of R. notatus, which does not inhabit the Daecheon River, but has a similar distribution to R. sinensis, the size of the Han River population was smaller than that of other western and southwestern coastal populations (Won et al. Citation2020). Some HG and DC haplotypes were clustered as phylogenetic sisters, indicating at least partial gene flow between these two populations until differentiation in the Late Pleistocene (ca. 0.5–0.6 MYA). Evidence of a biogeographical connection between the Han River and the Daecheon River was also found in a study of R. pseudosericeus, a closely related species to R. sinensis (Jeon and Suk Citation2014).
Based on the s-DIVA analysis and geographic location, it appears that some of the subpopulations of the population DC migrated to the southwestern corner of the Korean Peninsula and formed several populations. Population MG (Mangyeong River), which is geographically closest to population DC, appears to have formed first in this region, probably approximately 700,000 years ago. The mitochondrial and microsatellite data showed that the populations MG, TJ (Tamjin River), and YS (Yeongsan River) located near this area exhibited rapid growth and could retain high genetic diversity. This pattern of high genetic diversity in the southwestern corner populations of the Korean Peninsula was also found in a study of R. notatus (Won et al. Citation2020). When these populations colonized these rivers, it was presumed there were a wide variety of habitats that could accommodate large populations. Considering that these three populations formed distinctly different clades in the haplotype network analysis or phylogenetic trees, it was estimated that the level of gene flow between these rivers was not that active, but this corner area was connected to the paleo-Yellow confluence while dropping in sea levels during the Pleistocene.
Colonization in the rivers flowing to the south coast, where the continental shelf size is relatively small, occurred more recently than in the rivers flowing to the west coast, assuming no gene flow through a direct connection with paleo-yellow confluence. The historical demographic dynamics shown in the EBSP results indicated that the populations of the two rivers flowing down the south coast, populations SJ (Seomjin River) and ND (Nakdong River), grew rapidly at a significantly later time than that of the other populations. In these results, it is more a matter of where the populations SJ and ND came from rather than when they were formed. Population SJ showed the highest genetic affinity with population YS in mitochondrial and microsatellite data. Both the Tamjin and Yeongsan rivers are located in the southwestern corner of the Korean Peninsula, but given the estuary location, the Tamjin River is geographically closer to the Seomjin River. These results indicated that the population SJ did not colonize the present habitat through estuary coalescence. Because the upper areas of the Yeongsan River are adjacent to the upper areas of the Seomjin River, it is believed that capture accompanying the geological fluctuations in the headwater regions likely occurred (Kang Citation2005), which may have led to the migration of R. sinensis into the Seomjin River. According to the estimates of the time of divergence made in the present study, the populations SJ and YS were estimated to have differentiated at approximately 0.4 MYA.
Although it is possible to presume from a geographical point of view that the population of the Nakdong River (population ND) may have originated from the nearest adjacent population (Seomjin River), our results did not show any genetic or phylogenetic affinity between the populations SJ and ND. Based on the mitochondrial data, population TJ appears to be the origin of population ND. No empirical evidence has been reported to suggest that there may have been any geological events that would enable gene flow between these two geographically distant populations. Events that would have formed a confluence between the Nakdong River and Tamjin River regions can also be presumed, considering that the sea level off the southern coast of the Korean Peninsula was 50–60 m lower than at present, approximately 10,000 years ago (Lee et al. Citation2008). During this period of sea level descent, the Korean Peninsula was connected to the southernmost islands (e.g. Jeju Island), which can be supported by the floral similarity between Jeju Island and the southern coast of the Korean Peninsula (Chung et al. Citation2013). Because no empirical studies that make it possible to estimate biogeographic migrations in the southern coast of the Korean Peninsula have been conducted, more relevant data needs to be accumulated in the future.
Population HS was assumed to be formed by artificial introduction. The Hyeongsan River, where this population is located, is not likely to have been associated with paleo-Yellow confluences, either from its geographical location or from the surrounding mountainous terrain. Several species appearing with high frequency in this river flowing to the eastern coast of the Korean Peninsula (e.g. Squalidus multimaculatus, Iksookimia yongdokensis, and Liobagrus hyeongsanensis) are not found in the rivers flowing to the western and southern coasts (Kim and Park Citation2002). A previous study reported that anthropogenic inflow was frequently observed in the rivers flowing to the east coast of the Korean Peninsula (Lee et al. Citation2017). Microsatellite analysis showed that population HS showed a clear genetic affinity only with the geographically closest population ND. However, the mitochondrial haplotypes originating from population MG and ND were found frequently in population HS. Hence, population HS appears to have been introduced anthropogenically from the Nakdong River and other water systems, such as the Mangyeong River (population MG). Probably because relatively few individuals were introduced from the Mangyeong River, the genetic characteristics of microsatellites have been diluted over time, while the mitochondrial haplotype remained and was detected in the present study.
Based on these results, the management units for establishing a conservation strategy with Korean R. sinensis can be determined. Although R. sinensis inhabits the Korean Peninsula and mainland China, this study shows that the Korean and Chinese species are in a relatively distant evolutionary relationship to be considered the same species. This is why Korean R. sinensis should be recognized as a local native species, which can be the purpose for devising a conservation strategy, but extensive sampling and investigation in China are needed in the future. It is difficult to say that the current freshwater system on the Korean Peninsula is well preserved in terms of the ecological conditions that allow the natural populations of R. sinensis to maintain the historically formed size and genetic diversity. Korean R. sinensis is rare in many areas where large populations were naturally maintained 20 years ago (Choi Citation1973; Jang et al. Citation2008). Korean R. sinensis should be divided into three regions from the standpoint of natural population management: west coastal rivers (populations HG and DC), southwest coastal rivers (populations MG, TJ, and YS), and south coastal rivers (populations SJ and ND). The west coastal rivers can be considered the historical starting point of Korea R. sinensis, but the formation of large populations was complex, probably because of environmental factors, which likely led to relatively low population genetic diversity. For this reason, continuous monitoring of the populations and the surrounding ecosystems is needed to identify natural and anthropogenic factors that interfere with a population habitat or growth in this region. The southwest coastal rivers are a hotspot of Korean R. sinensis genetic diversity. Nevertheless, each population in this region has unique genetic characteristics. Populations in the south coastal rivers were formed by a small number of individuals during the dispersal process and are likely to have suffered historical bottlenecks.
Supplemental Material
Download MS Word (482.6 KB)Disclosure statement
No potential conflict of interest was reported by the author(s).
Data availability statement
The datasets generated during the current study are available from the corresponding author on reasonable request.
Additional information
Funding
References
- Akai Y, Arai R. 1998. Rhodeus sinensis, a senior synonym of R. Lighti and R. Uyekii (acheilognathinae, cyprinidae). Ichthyol Res. 45(1):105–110. doi:10.1007/BF02678582.
- Akaike H. 1974. A new look at the statistical model identification. IEEE Trans Autom Control. 19(6):716–723. doi:10.1109/TAC.1974.1100705.
- Anderson E, Thompson E. 2002. A model-based method for identifying species hybrids using multilocus genetic data. Genetics. 160(3):1217–1229. doi:10.1093/genetics/160.3.1217.
- Austerlitz F, Jung-Muller B, Godelle B, Gouyon P-H. 1997. Evolution of coalescence times, genetic diversity and structure during colonization. Theor Popul Biol. 51(2):148–164. doi:10.1006/tpbi.1997.1302.
- Avise JC. 2000. Phylogeography: the history and formation of species. Cambridge: Harvard University Press.
- Avise JC, Arnold J, Ball RM, Bermingham E, Lamb T, Neigel JE, Reeb CA, Saunders NC. 1987. Intraspecific phylogeography: the mitochondrial DNA bridge between population genetics and systematics. Annu Rev Ecol Evol Syst. 18(1):489–522. doi:10.1146/annurev.es.18.110187.002421.
- Baltazar-Soares M, Blanchet S, Cote J, Tarkan AS, Záhorská E, Gozlan RE, Eizaguirre C. 2020. Genomic footprints of a biological invasion: Introduction from Asia and dispersal in Europe of the topmouth gudgeon (Pseudorasbora parva). Mol Ecol. 29(1):71–85. doi:10.1111/mec.15313.
- Barnes BO, Kanter AE, Klawans AH. 1936. Bitterling ovipositor lengthening produced by adrenal extracts. Science. 84(2179):310. doi:10.1126/science.84.2179.310.b.
- Bernos TA, Avlijaš S, Hill J, Morissette O, Ricciardi A, Mandrak NE, Jeffries KM. 2023. Genetic diversity and structure of a recent fish invasion: Tench (Tinca tinca) in eastern North America. Evol Appl. 16(1):173–188. doi:10.1111/eva.13520.
- Bouckaert R, Heled J, Kühnert D, Vaughan T, Wu C-H, Xie D, Suchard MA, Rambaut A, Drummond AJ. 2014. BEAST 2: a software platform for Bayesian evolutionary analysis. PLoS Comput Biol. 10(4):e1003537. doi:10.1371/journal.pcbi.1003537.
- Brito RM, Briolay J, Galtier N, Bouvet Y, Coelho MM. 1997. Phylogenetic relationships within genus Leuciscus (Pisces, Cyprinidae) in Portuguese fresh waters, based on mitochondrial DNA cytochrome b sequences. Mol Phylogenet Evol. 8(3):435–442. doi:10.1006/mpev.1997.0429.
- Chang C-H, Li F, Shao K-T, Lin Y-S, Morosawa T, Kim S, Koo H, Kim W, Lee J-S, He S, et al. 2014. Phylogenetic relationships of Acheilognathidae (Cypriniformes: Cyprinoidea) as revealed from evidence of both nuclear and mitochondrial gene sequence variation: evidence for necessary taxonomic revision in the family and the identification of cryptic species. Mol Phylogenet Evol. 81:182–194. doi:10.1016/j.ympev.2014.08.026.
- Choi K. 1973. On the geographical distribution of freshwater fishes south of DMZ in Korea. Korean J Limnol. 6(3):29–36.
- Chung MY, Moon M-O, López-Pujol J, Maki M, Yamashiro T, Yukawa T, Sugiura N, Lee Y-I, Chung MG. 2013. Was Jeju Island a glacial refugium for East Asian warm-temperate plants? Insights from the homosporous fern Selliguea hastata (Polypodiaceae). Am J Bot. 100(11):2240–2249. doi:10.3732/ajb.1300134.
- Clark PU, Mix AC. 2002. Ice sheets and sea level of the Last Glacial Maximum. Quat Sci Rev. 21(1–3):1–7. doi:10.1016/S0277-3791(01)00118-4.
- Clement M, Posada D, Crandall KA. 2000. TCS: a computer program to estimate gene genealogies. Mol Ecol. 9(10):1657–1659. doi:10.1046/j.1365-294x.2000.01020.x.
- Collins DS, Avdis A, Allison PA, Johnson HD, Hill J, Piggott MD. 2018. Controls on tidal sedimentation and preservation: Insights from numerical tidal modelling in the Late Oligocene-Miocene South China Sea, Southeast Asia. Sedimentology. 65(7):2468–2505. doi:10.1111/sed.12474.
- Crawford KM, Whitney KD. 2010. Population genetic diversity influences colonization success. Mol Ecol. 19(6):1253–1263. doi:10.1111/j.1365-294X.2010.04550.x.
- Darriba D, Taboada GL, Doallo R, Posada D. 2012. jModelTest 2: more models, new heuristics and parallel computing. Nat Methods. 9(8):772–772. doi:10.1038/nmeth.2109.
- Drummond AJ, Suchard MA, Xie D, Rambaut A. 2012. Bayesian phylogenetics with BEAUti and the BEAST 1.7. Mol Biol Evol. 29(8):1969–1973. doi:10.1093/molbev/mss075.
- Earl DA, vonHoldt BM. 2012. STRUCTURE HARVESTER: a website and program for visualizing STRUCTURE output and implementing the Evanno method. Conserv Genet Resour. 4(2):359–361. doi:10.1007/s12686-011-9548-7.
- Elias SA, Short SK, Nelson CH, Birks HH. 1996. Life and times of the Bering land bridge. Nature. 382(6586):60–63. doi:10.1038/382060a0.
- Evanno G, Regnaut S, Goudet J. 2005. Detecting the number of clusters of individuals using the software STRUCTURE: a simulation study. Mol Ecol. 14(8):2611–2620. doi:10.1111/j.1365-294X.2005.02553.x.
- Excoffier L, Lischer HE. 2010. Arlequin suite ver 3.5: a new series of programs to perform population genetics analyses under Linux and Windows. Mol Ecol Resour. 10(3):564–567. doi:10.1111/j.1755-0998.2010.02847.x.
- Flower BP, Kennett JP. 1994. The middle Miocene climatic transition: east Antarctic ice sheet development, deep ocean circulation and global carbon cycling. Palaeogeogr Palaeoclimatol Palaeoecol. 108(3-4):537–555. doi:10.1016/0031-0182(94)90251-8.
- Fu Y-X. 1997. Statistical tests of neutrality of mutations against population growth, hitchhiking and background selection. Genetics. 147(2):915–925. doi:10.1093/genetics/147.2.915.
- Garza JC, Williamson EG. 2001. Detection of reduction in population size using data from microsatellite loci. Mol Ecol. 10(2):305–318. doi:10.1046/j.1365-294X.2001.01190.x.
- Hu J, Li H, Sakai H, Mukai T, Suk HY, Li C. 2023. Molecular phylogenetics of the fresh water sleepers Odontobutis (Gobiiformes: Odontobutidae) and its implications on biogeography of freshwater ichthyofauna of East Asia. Mol Phylogenet Evol. 186:107871. doi:10.1016/j.ympev.2023.107871.
- Ivanova NV, Zemlak TS, Hanner RH, Hebert PD. 2007. Universal primer cocktails for fish DNA barcoding. Mol Ecol Notes. 7(4):544–548. doi:10.1111/j.1471-8286.2007.01748.x.
- Jang Ji Eun, Kim Jae Hwan, Kang Ji Hyoun, Baek Song Yi, Wang Ju-hyoun, Lee Hwang-Goo, Choi Jun-Kil, Choi Jae-Seok, Lee Hyuk Je. 2017. Genetic diversity and genetic structure of the endangered Manchurian trout, Brachymystax lenok tsinlingensis, at its southern range margin: conservation implications for future restoration. Conservation Genetics. 18(5):1023–1036. http://dx.doi.org/10.1007/s10592-017-0953-7.
- Jang M-H, Yoon J-D, Shin J-H, Joo G-J. 2008. Status of freshwater fish around the Korean Demilitarized Zone and its implications for conservation. Aquat Conserv: Mar Freshw Ecosyst. 18(6):819–828. doi:10.1002/aqc.891.
- Jeon H-B, Kim D-Y, Lee YJ, Bae H-G, Suk HY. 2018. The genetic structure of Squalidus multimaculatus revealing the historical pattern of serial colonization on the tip of East Asian continent. Sci Rep. 8(1):1–12.
- Jeon H-B, Song HY, Suk HY, Bang I-C. 2022. Phylogeography of the Korean endemic Coreoleuciscus (Cypriniformes: Gobionidae): the genetic evidence of colonization through Eurasian continent to the Korean Peninsula during Late Plio-Pleistocene. Genes Genom. 44(6):709–719. doi:10.1007/s13258-022-01243-y.
- Jeon H-B, Suk HY. 2014. Pseudo but actually genuine: Rhodeus pseudosericeus provides insight into the phylogeographic history of the Amur bitterling. Anim Cells Syst. 18(4):275–281. doi:10.1080/19768354.2014.936506.
- Kang S-Y. 2005. The Geomorphic characteristics of the Seum-Jin drainage basin. South Korea [PhD Dissertation]. Gwangju (South Korea): Chonnam National University.
- Kawamura K, Ueda T, Arai R, Smith C. 2014. Phylogenetic relationships of bitterling fishes (Teleostei: Cypriniformes: Acheilognathinae), inferred from mitochondrial cytochrome b sequences. Zool Sci. 31(5):321–329. doi:10.2108/zs130233.
- Kearse M, Moir R, Wilson A, Stones-Havas S, Cheung M, Sturrock S, Buxton S, Cooper A, Markowitz S, Duran C, et al. 2012. Geneious basic: an integrated and extendable desktop software platform for the organization and analysis of sequence data. Bioinformatics. 28(12):1647–1649. doi:10.1093/bioinformatics/bts199.
- Kim I, Park J. 2002. Freshwater fishes of Korea. Seoul: Kyohak Publishing Co; p. 1–466.
- Kim Y-P, An KG. 2010. Evaluations of ecological habitat, chemical water quality, and fish multi-metric model in Hyeongsan River watershed. Kor J Ecol Environ. 43(2):279–287.
- Kong G, Park S-C, Han H-C, Chang J, Mackensen A. 2006. Late Quaternary paleoenvironmental changes in the southeastern Yellow Sea, Korea. Quat Int. 144(1):38–52. doi:10.1016/j.quaint.2005.05.011.
- Kwan Y-S, Kim D, Ko M-H, Lee W-O, Won Y-J. 2018. Multi-locus phylogenetic analyses support the monophyly and the Miocene diversification of Iksookimia (Teleostei: Cypriniformes: Cobitidae). Syst Biodivers. 16(1):81–88. doi:10.1080/14772000.2017.1340912.
- Kwan Y-S, Ko M-H, Won Y-J. 2014. Genomic replacement of native Cobitis lutheri with introduced C. tetralineata through a hybrid swarm following the artificial connection of river systems. Ecol Evol. 4(8):1451–1465. doi:10.1002/ece3.1027.
- Lambeck K, Chappell J. 2001. Sea level change through the last glacial cycle. Science. 292(5517):679–686. doi:10.1126/science.1059549.
- Lambeck K, Rouby H, Purcell A, Sun Y, Sambridge M. 2014. Sea level and global ice volumes from the last glacial maximum to the Holocene. Proc Natl Acad Sci USA. 111(43):15296–15303. doi:10.1073/pnas.1411762111.
- Lee YG, Choi JM, Oertel GF. 2008. Postglacial sea-level change of the Korean Southern Sea shelf. J Coast Res. 24(10024):118–132. doi:10.2112/06-0737.1.
- Lee YJ, Bae H-G, Jeon H-B, Kim D-Y, Suk HY. 2017. Human-mediated processes affecting distribution and genetic structure of Squalidus multimaculatus, a freshwater cyprinid with small spatial range. Anim Cells Syst. 21(5):349–357. doi:10.1080/19768354.2017.1371074.
- Librado P, Rozas J. 2009. DnaSP v5: a software for comprehensive analysis of DNA polymorphism data. Bioinformatics. 25(11):1451–1452. doi:10.1093/bioinformatics/btp187.
- Lima SMQ, Berbel-Filho WM, Araújo TFP, Lazzarotto H, Tatarenkov A, Avise JC. 2017. Headwater capture evidenced by paleo-rivers reconstruction and population genetic structure of the armored catfish (Pareiorhaphis garbei) in the Serra do Mar Mountains of Southeastern Brazil. Front Genet. 8:199.
- Martinez AS, Willoughby JR, Christie MR. 2018. Genetic diversity in fishes is influenced by habitat type and life-history variation. Ecol Evol. 8(23):12022–12031. doi:10.1002/ece3.4661.
- McCall BL, Fluker BL. 2021. Conservation genetic assessment of the paleback darter, Etheostoma pallididorsum, a narrowly distributed endemic in the Ouachita Highlands, Arkansas, USA. Aquatic Conserv: Mar Freshw Ecosyst. 31(7):1817–1830. doi:10.1002/aqc.3510.
- Nei M. 1987. Molecular evolutionary genetics. New York: Columbia University Press; p. 1–514.
- Noda Y. 2004. Paleogeographic maps of the Japanese Islands and their application to exhibition of the Fukui Prefectural Dinosaur Museum. Mem Fukui Prefect Dinosaur Mus. 3:47.
- Park SC, Hong SK, Kim DC. 1996. Evolution of late Quaternary deposits on the inner shelf of the South Sea of Korea. Mar Geol. 131(3–4):219–232. doi:10.1016/0025-3227(96)00006-0.
- Park Y. 1992. The changes of sea level and climate during the late Pleistocene and Holocene in the Yellow Sea region. Kor J Quat Res. 6:13–20.
- Pavlova A, Beheregaray LB, Coleman R, Gilligan D, Harrisson KA, Ingram BA, Kearns J, Lamb AM, Lintermans M, Lyon J, et al. 2017. Severe consequences of habitat fragmentation on genetic diversity of an endangered Australian freshwater fish: a call for assisted gene flow. Evol Appl. 10(6):531–550. doi:10.1111/eva.12484.
- Peakall R, Smouse PE. 2012. GenAlEx 6.5: genetic analysis in excel. Population genetic software for teaching and research-an update. Bioinformatics. 28(19):2537–2539. doi:10.1093/bioinformatics/bts460.
- Perdices A, Cunha C, Coelho MM. 2004. Phylogenetic structure of Zacco platypus (Teleostei, Cyprinidae) populations on the upper and middle Chang Jiang (= Yangtze) drainage inferred from cytochrome b sequences. Mol Phylogenet Evol. 31(1):192–203. doi:10.1016/j.ympev.2003.07.001.
- Piry S, Luikart G, Cornuet JM. 1999. BOTTLENECK: a computer program for detecting recent reductions in the effective size using allele frequency data. J Hered. 90(4):502–503. doi:10.1093/jhered/90.4.502.
- Pritchard JK, Stephens M, Donnelly P. 2000. Inference of population structure using multilocus genotype data. Genetics. 155(2):945–959. doi:10.1093/genetics/155.2.945.
- Qiu S, Wang X, Zhang S, Lian Y, Zhang Z, Zhu J. 2012. The evolution of the large paleolake in Songliao plain and its formation. Quat Sci. 32(5):1011–1021.
- Rambaut A, Drummond AJ, Xie D, Baele G, Suchard MA. 2018. Posterior summarization in Bayesian phylogenetics using Tracer 1.7. Syst Biol. 67(5):901–904. doi:10.1093/sysbio/syy032.
- Rogers AR, Harpending H. 1992. Population growth makes waves in the distribution of pairwise genetic differences. Mol Biol Evol. 9(3):552–569.
- Ronquist F, Teslenko M, Van Der Mark P, Ayres DL, Darling A, Höhna S, Larget B, Liu L, Suchard MA, Huelsenbeck JP. 2012. MrBayes 3.2: efficient Bayesian phylogenetic inference and model choice across a large model space. Syst Biol. 61(3):539–542. doi:10.1093/sysbio/sys029.
- Song H-Y, Kim K-Y, Yoon M, Nam YK, Kim DS, Bang I-C. 2010. Genetic variation of Coreoleuciscus splendidus populations (Teleostei; Cypriniformes) from four major river drainage systems in South Korea as assessed by AFLP markers. Genes Genom. 32(3):199–205. doi:10.1007/s13258-009-0881-0.
- Tajima F. 1989. Statistical method for testing the neutral mutation hypothesis by DNA polymorphism. Genetics. 123(3):585–595. doi:10.1093/genetics/123.3.585.
- Thomas CD. 2010. Climate, climate change and range boundaries. Divers Distrib. 16(3):488–495. doi:10.1111/j.1472-4642.2010.00642.x.
- Thomaz AT, Malabarba LR, Bonatto SL, Knowles LL. 2015. Testing the effect of palaeodrainages versus habitat stability on genetic divergence in riverine systems: study of a Neotropical fish of the Brazilian coastal Atlantic Forest. J Biogeogr. 42(12):2389–2401. doi:10.1111/jbi.12597.
- Thompson JD, Higgins DG, Gibson TJ. 1994. CLUSTAL W: improving the sensitivity of progressive multiple sequence alignment through sequence weighting, position-specific gap penalties and weight matrix choice. Nucleic Acids Res. 22(22):4673–4680. doi:10.1093/nar/22.22.4673.
- Tomoda Y. 1977. Fossil freshwater fishes from Japan. Mem Geol Soc Jpn. 14:221–243.
- Uemoto T, Abe G, Tamura K. 2020. Regrowth of zebrafish caudal fin regeneration is determined by the amputated length. Sci Rep. 10:649. doi:10.1038/s41598-020-57533-6.
- Unmack PJ, Hammer MP, Adams M, Johnson JB, Dowling TE. 2013. The role of continental shelf width in determining freshwater phylogeographic patterns in south-eastern Australian pygmy perches (Teleostei: Percichthyidae). Mol Ecol. 22(6):1683–1699. doi:10.1111/mec.12204.
- Wageman JM, Hilde TW, Emery K. 1970. Structural framework of East China Sea and Yellow Sea. AAPG Bull. 54(9):1611–1643.
- Won H, Jeon H-B, Kim D-Y, Suk HY. 2021. Differential patterns of diversity at neutral and adaptive loci in endangered Rhodeus pseudosericeus populations. Sci Rep. 11(1):15953. doi:10.1038/s41598-021-95385-w.
- Won H, Jeon H-B, Suk HY. 2020. Evidence of an ancient connectivity and biogeodispersal of a bitterling species, Rhodeus notatus, across the Korean Peninsula. Sci Rep. 10(1):1011. doi:10.1038/s41598-020-57625-3.
- Xu W, Yin W, Chen A, Li J, Lei G, Fu C. 2014. Phylogeographical analysis of a cold-temperate freshwater fish, the Amur sleeper (Perccottus glenii) in the Amur and Liaohe River Basins of northeast Asia. Zool Sci. 31(10):671–679. doi:10.2108/zs130046.
- Yang ZS, Liu J. 2007. A unique Yellow River-derived distal subaqueous delta in the Yellow Sea. Mar Geol. 240(1–4):169–176. doi:10.1016/j.margeo.2007.02.008.
- Yasuno K. 1984. Fossil pharyngeal teeth of the Rhodeinae fish from the Miocene Katabira Formation of the Kani Group, Gifu Prefecture, Japan. Bull Mizunami Fossil Mus. 11:101–105.
- Yi S, Saito Y. 2004. Latest Pleistocene climate variation of the East Asian monsoon from pollen records of two East China regions. Quat Int. 121(1):75–87. doi:10.1016/j.quaint.2004.02.017.
- Yu Y, Harris AJ, Blair C, He X. 2015. Rasp (Reconstruct Ancestral State in Phylogenies): a tool for historical biogeography. Mol Phylogenet Evol. 87:46–49. doi:10.1016/j.ympev.2015.03.008.
- Zardoya R, Doadrio I. 1999. Molecular evidence on the evolutionary and biogeographical patterns of European cyprinids. J Mol Evol. 49(2):227–237. doi:10.1007/PL00006545.
- Zúñiga-Vega JJ, Ingley SJ, Unmack PJ, Johnson JB. 2014. Do freshwater ecoregions and continental shelf width predict patterns of historical gene flow in the freshwater fish Poecilia butleri? Biol J Linn Soc. 112(3):399–416. doi:10.1111/bij.12289.