
ABSTRACT
Parkinson’s disease (PD) often results in hippocampal dysfunction, which leads to cognitive and emotional challenges and synaptic irregularities. This study attempted to assess behavioral anomalies and identify differentially expressed genes (DEGs) within the hippocampus of a hemiparkinsonian rat model to potentially uncover novel genetic candidates linked to hippocampal dysfunction. Striatal 6-hydroxydopamine (6-OHDA) infusions were performed unilaterally in the brains of adult SD rats, while dopaminergic impairments were verified in rats with 6-OHDA-lesioned striata. RNA sequencing and gene expression analysis unveiled 1018 DEGs in the ipsilateral rat hippocampus following 6-OHDA infusion: 631 genes exhibited upregulation, while 387 genes were downregulated (with FDR-adjusted p-value < 0.05 and absolute fold-change > 1.5). Gene ontology analysis of DEGs indicated that alterations in the hippocampi of 6-OHDA-lesioned rats were primarily associated with synaptic signaling, axon development, behavior, postsynaptic membrane, synaptic membrane, neurotransmitter receptor activity, and peptide receptor activity. The Kyoto Encyclopedia of Genes and Genomes analysis of DEGs demonstrated significant enrichment of the neuroactive ligand–receptor interaction, calcium signaling pathway, cAMP signaling pathway, axon guidance, and notch signaling pathway in rat hippocampi that had been subjected to striatal 6-OHDA infusion. STRING analysis confirmed a notable upregulation of eight hub genes (Notch3, Gng4, Itga3, Grin2d, Hgf, Fgf11, Htr3a, and Col6a2), along with a significant downregulation of two hub genes (Itga11 and Plp1), as validated by reverse transcription-quantitative polymerase chain reaction. This study provides a comprehensive transcriptomic profile of the hippocampi in a hemiparkinsonian rat model, thereby offering insights into the signaling pathways underlying hippocampal dysfunction.
Introduction
Dopamine (DA) is a key neurotransmitter in the brain. Problems in the central dopaminergic (DAergic) system are closely linked to neurodegenerative diseases and mental disorders, especially Parkinson’s disease (PD) and schizophrenia, respectively (Ang et al. Citation2021; Speranza et al. Citation2021; Wada et al. Citation2021). The main neurochemical imbalance in PD is the diminution of DA, which precedes alterations in other neurotransmitters (Halliday et al. Citation2014; El Mahdy et al. Citation2023). A deficiency in DA in the striatal circuit leads to hippocampal dysfunction, which affects cognitive and emotional regulation through neuroplasticity (Parker et al. Citation2013; Speranza et al. Citation2021).
Emerging evidence from previous studies underscores that alterations in gene expressions in hippocampal neurons are implicated in various neurodegenerative disorders (Mu and Gage Citation2011; Villar-Conde et al. Citation2021), through influencing cognitive capacities and behavioral anomalies in patients. Notably, as knowledge of the neuropsychiatric facets of PD has deepened (Weerasinghe-Mudiyanselage et al. Citation2023), it has been discerned that the hippocampus impacts the onset of the disease via the DA system and other transmitter pathways (Berretta et al. Citation1990). Additionally, data from numerous animal model studies support this perspective (Lisman and Grace Citation2005; Costa et al. Citation2012), thereby demonstrating that the interplay between DA transmission and hippocampal neuroplasticity assumes a pivotal role in memory and emotional behavior (Ghiglieri et al. Citation2011; Kim et al. Citation2022). However, it is imperative to acknowledge the high degree of heterogeneity among hippocampal neurons (Zhang et al. Citation2021); thus, the precise mechanisms underpinning cognitive and emotional impairment in PD remain partly elusive (Wang et al. Citation2019; Weerasinghe-Mudiyanselage et al. Citation2023).
RNA sequencing (RNA-seq) has emerged as a formidable tool in investigating neurodegenerative disorders and discerning biomarkers (Barrett et al. Citation2009; Kang et al. Citation2011). For example, Alieva et al. (Citation2017) reported substantial distinctions in gene expression levels between the striatum and substantia nigra in PD using RNA-seq. Moni et al. (Citation2019) compared differentially expressed genes (DEGs) in the brain and blood of patients with PD and identified co-expressed DEGs, which allowed the disease progression to be monitored. Infante et al. (Citation2015) illuminated that the leucine-rich repeat kinase 2 (LRRK2) G2019S mutation within the brain may diminish neuroprotective capacity, ultimately, culminating in the onset of PD pathology. While PD has been the subject of extensive scrutiny, no study has yet delineated the pivotal pathways involving major DEGs linking the hippocampus and PD pathogenesis.
This study endeavors to validate behavioral aberrations and to employ RNA-seq to analyze the hippocampal transcriptomic profile in rats subjected to striatal 6-hydroxydopamine (6-OHDA) lesions. The aim was to decipher the molecular mechanisms through which disruption of the DAergic system impacts hippocampal function and to identify novel candidate genes related to neuropsychiatric symptoms in a PD animal model. Subsequently, we identified DEGs in the hippocampus and conducted an enrichment analysis to elucidate their biological functions and associated pathways. This comprehensive bioinformatics assessment encompassed Gene Ontology (GO) analysis, Kyoto Encyclopedia of Genes and Genomes (KEGG), and investigation through the protein–protein interaction (PPI) networks.
Materials and methods
Animals and surgical procedure
Twenty male Sprague–Dawley rats (Charles River Laboratories, Wilmington, MA, USA) were used in this study. All animal care and experimental protocols adhered to the guidelines set forth by Chonnam National University (17 June 2021, CNU IACUC-YB-2021-71; 1 June 2023, CNU IACUC-YB-2023-70) and the NIH Guide for the Care and Use of Laboratory Animals. Measures were taken to minimize both the number of animals used and any associated suffering.
The rats were securely positioned in a stereotaxic apparatus (SR-6; NARISHIGE, Tokyo, Japan) with their heads level. The coordinates for the surgical procedure were established as follows: anteroposterior +1.3, + 0.4, −0.4, −1.3 mm from the bregma; mediolateral −2.6, −3.0, −4.2, −4.5 mm from the midline; dorsoventral −5.0 from the skull. Subsequently, each rat (n = 10) received an infusion of 6-OHDA solution (3.5 mg/mL, Sigma-Aldrich, St. Louis, MO, USA) into the right striatum via an infusion pump. This was facilitated using an 8 µL saline solution containing 0.02% (w/v) ascorbic acid (Wako, Osaka, Japan) through a 10.5 μL microinjection cannula, administered at a consistent flow rate of 1 μL/min (2 μL was dispensed at each specified coordinate). Sham-operated control rats (n = 10) underwent an identical procedure, with one crucial distinction: instead of infusing 6-OHDA solution, 8 μL of a vehicle solution comprising 0.9% saline containing 0.02% (w/v) ascorbic acid was introduced into the striatum.
Apomorphine-induced rotation test
Four weeks following the striatal 6-OHDA infusion, each rat received an intraperitoneal administration of apomorphine hydrochloride (1 mg/kg; Wako). Thereafter, we meticulously recorded the count of contralateral rotations (indicative of left-handed rotations) each rat performed over a period of 30 min (n = 10 per group). This was conducted to affirm the successful establishment of a hemiparkinsonian rat model, characterized by unilateral lesions in the nigrostriatal system (Kim et al. Citation2022).
Novelty-suppressed feeding test
The novelty-suppressed feeding test was employed to evaluate anxiety- and depression-like behaviors (Blasco-Serra et al. Citation2017). For this test, the rats (n = 7 per group) were subjected to a three-phase food deprivation regimen for three days prior to the introduction of a highly appealing food. This regimen included an initial overnight deprivation of 20% of their standard food, followed by a second deprivation of 20%, and concluded with a third and more substantial deprivation of 80%. To enhance palatability, standard pellets were sweetened through immersion in a 50% sucrose solution, ensuring the introduction of exceptionally enticing food without introducing anxiogenic factors or non-standard items. The circular open field utilized for this test measured 80 cm in diameter and 30 cm in height, thereby providing the rats with an exposed and potentially anxiety-inducing environment. In each trial, the latency in locating the food pellet was defined as the duration between the rat being placed in the open field and the moment the rat discovered and grasped the food pellet with its forepaws. A maximum time frame of 10 min was set for locating the food; any rat exceeding this limit had its latency recorded as 10 min and was subsequently provided with the food. Additionally, we assessed the latency of consuming the food pellet positioned on the white platform at the center of the open field for a period of 10 min using the SmartScan system (Panlab, Barcelona, Spain).
Immunohistochemistry
For the immunohistochemistry procedures, we adhered to established protocols as described in previous studies (Hong et al. Citation2023; Weerasinghe-Mudiyanselage et al. Citation2024). Brains (n = 3 per group) were fixed with 4% paraformaldehyde in phosphate-buffered saline (PBS) and sectioned coronally into 4 µm slices. To inhibit endogenous peroxidase activity, the paraffin-embedded sections were treated with 0.3% hydrogen peroxide solution for 20 min. Following this, the sections were blocked using 5% normal goat serum (NGS; Vector ABC Elite Kit, Vector Laboratories, Burlingame, CA, USA) in PBS containing 0.1% Tween 20 (PBS-T; pH 7.4) for 1 h at room temperature (RT; approximately 22°C ± 2°C). The sections were then incubated with rabbit anti-tyrosine hydroxylase (TH) antibody (dilution ratio of 1:500; Millipore, Burlington, MA, USA) overnight at 4°C. Afterward, the sections were exposed to biotinylated goat anti-rabbit IgG (Vector ABC Elite Kit) for 1 h at RT, followed by incubation with an avidin–biotin-peroxidase complex (Vector ABC Elite Kit) for an additional hour. The peroxidase reaction was visualized using a diaminobenzidine substrate (DAB kit; Vector Laboratories).
The substantia nigra sections, located approximately 5.08 mm caudally from the bregma, were chosen for cell counting in each rat. TH + immunopositive cells in the substantia nigra were quantified. Additionally, images were converted to grayscale to assess TH + immunoreactivity in the striatum (approximately 0.26 mm caudally from the bregma). The ImageJ software (NIH, Bethesda, MD, USA) was employed to calculate the mean gray value (256 gray levels) for each selected area. Relative changes in TH + immunoreactivity intensity levels were expressed relative to their optical densities (ODs), with the mean intensity of the control set to 1. The number and intensity of immunopositive cells per group were averaged and presented as the mean (M) ± standard error of the mean (SEM).
Buried-food seeking test
Before the test, the rats underwent a 15 h overnight fast. Subsequently, they were placed individually in a cleaned home cage where a standard food pellet was buried beneath 4 cm of bedding. The time taken by each rat to consume the food pellet at the center of the open field was recorded over a 10 min period.
Open field test
The experimental setup comprised an acrylic chamber (W × D × H: 60 × 60 × 30 cm). To initiate the trial, the rats were gently positioned on the right side of the open field. A comprehensive analysis of the movements of each rat movement was conducted using SmartScan technology (Panlab). Specifically, the movement time and distance spent in the central area (constituting 25% of the chamber) were calculated as a percentage relative to the total movement time and distance, respectively.
RNA-Seq
Hippocampi were extracted from decapitated rats (n = 3 per group). Total RNA was isolated following the protocols of the RNeasy® Mini Kit (Qiagen, Hilden, Germany). Total RNA concentrations were quantified using Quant-IT RiboGreen (Invitrogen, Carlsbad, CA, USA). The integrity of the extracted RNA samples was assessed using the TapeStation RNA ScreenTape (Agilent Technologies, Palo Alto, CA, USA). Only high-quality RNA preparations, with an RNA integrity number exceeding 7.0, were employed for subsequent library construction. Each sample, containing 1 μg of total RNA, underwent individual library construction utilizing the Illumina TruSeq Stranded mRNA Sample Prep Kit (RS-122-2101, Illumina, Inc., San Diego, CA, USA). The initial step involved purifying poly-A-bearing mRNA molecules using poly-T-attached magnetic beads. Subsequently, an elevated temperature was administered to fragment the mRNA into smaller pieces, employing divalent cations. SuperScript II reverse transcriptase (Invitrogen) and random primers facilitated the conversion of cleaved RNA fragments into first-strand cDNA. The second cDNA strand was synthesized using DNA polymerase I, RNase H, and dUTP. Next, these cDNA fragments underwent an end-repair process, a single ‘A’ base insertion, and adapter ligation. Finally, the cDNA libraries were constructed following purification and PCR enrichment. Library quantification was carried out using KAPA Library Quantification kits tailored for Illumina Sequencing platforms, following the qPCR Quantification Protocol Guide (KK4854, Kapa Biosystems, Wilmington, MA, USA), while library quality was assessed using the TapeStation D1000 ScreenTape (Agilent Technologies). Subsequently, indexed libraries were dispatched for paired-end sequencing by Illumina NovaSeq systems (Illumina, Inc.), and sequencing was completed by Macrogen Inc. (Seoul, Republic of Korea).
Identification of DEGs and enrichment analysis
Bowtie 2 software (Langmead and Salzberg Citation2012) was employed to align the trimmed reads with the indexed genome. Subsequently, differential expression in the RNA-seq data was analyzed by DESeq2 (Love et al. Citation2014) using the R software (version 4.2.2) environment (R Core Team Citation2013). DEGs were identified using the DESeq2 Wald test (Love et al. Citation2014), and p-values were subjected to adjustment through the Benjamini–Hochberg procedure for false discovery rate (FDR) control (Benjamini and Hochberg Citation1995). DEGs were characterized as genes that exhibited an absolute fold change greater than 1.5 and adjusted p-values less than 0.05.
For further functional characterization, we performed GO analysis of the biological process (BP), cellular component (CC), and molecular function (MF) categories, along with Kyoto Encyclopedia of Genes and Genomes (KEGG) pathway enrichment analysis (accessed on 10 October 2023) using ShinyGO version 0.77 (Ge et al. Citation2020). An interactive plot was generated to illustrate the interactions among the top 10 enriched pathways. Connections between two pathways (nodes) were established if a minimum of 20% of their genes were shared. Nodes with deeper shades indicated significantly more enriched gene sets, larger nodes denoted larger gene sets, and thicker edges signified greater gene overlap. Significantly altered pathways and genes were determined using a significance threshold of p < 0.05 and q < 0.01.
PPI analysis
To explore the interactions among DEGs, a PPI network was constructed with a confidence value of 0.7, utilizing the Search Tool for the Retrieval of Interacting Genes/proteins (STRING) database (Szklarczyk et al. Citation2021). Subsequently, hub genes were identified through PPI analysis, using the CytoHubba plugin (Chin et al. Citation2014) within the Cytoscape software platform (Shannon et al. Citation1971). CytoHubba provides various methods for evaluating network topology (Chin et al. Citation2014), encompassing both global and local ranking approaches. In the global ranking method, nodes are assessed in relation to the entire network, whereas nodes are evaluated based on their immediate neighbors in the local ranking method. Hub genes were determined by cross-referencing the top 40 ranked genes identified through two global methods (betweenness and closeness) and three local methods (degree, maximum neighborhood component (MNC), and maximal clique centrality (MCC)). The hub genes were determined by intersecting the top 40 genes calculated by the five methods.
RNA extraction, cDNA synthesis, and reverse transcription-quantitative polymerase chain reaction
The procedures for RNA extraction, cDNA synthesis, and reverse transcription-quantitative polymerase chain reaction (RT-qPCR) (n = 4 per group) adhered to the methods established in a prior study (Hong et al. Citation2023). In brief, cDNA synthesis was performed using the SuperiorScript III cDNA synthesis kit (Enzynomics, Daejeon, Republic of Korea). Subsequently, the cDNA was appropriately diluted with RNase-free water to achieve a final concentration of 8 ng/µL, and the samples were securely stored at −80°C. For RT-qPCR, we utilized the TOPrealTM SYBR Green qPCR PreMix (Enzynomics) and conducted the assay on the CFX Opus 96 Real-Time PCR System (Bio-Rad, Hercules, CA, USA). The primers employed for RT-qPCR are detailed in . The annealing temperature for the reaction was set at 58 °C, and the built-in software generated the amplification curves and calculated the threshold cycle values. To ensure robust normalization, β-actin was used as the reference gene for all data analyses. Results were calculated using the 2−ΔΔCT method and are presented as mean relative values in comparison to the sham group.
Table 1. Summary of RNA-seq and RT-qPCR validation results for hub genes of DEGs.
Statistical analysis
To assess distinctions between the sham-operated control group and the 6-OHDA-lesioned group, the RT-qPCR results underwent analysis through unpaired Student t-tests. GraphPad software (version 9.3.1, GraphPad Software, San Diego, CA, USA) was employed for all statistical computations. The presented data are expressed as the mean (M) ± standard error of the mean (SEM). A significance level of P < 0.05 was applied to determine statistical significance across all analyses.
Results
Unilateral striatal 6-OHDA infusion impairs ipsilateral DAergic signaling in rats
We initially validated the attenuation of ipsilateral nigrostriatal dopaminergic signaling in the hemiparkinsonian rat model following unilateral striatal 6-OHDA infusion. Four weeks post-6-OHDA infusion, and following systemic apomorphine administration, the rats displayed distinct contralateral circling behaviors. Following apomorphine treatment, rats (n = 10 per group) demonstrating more than seven rotations per minute were considered to have been effectively induced with ipsilateral dopamine depletion ((A); t(18) = 25.97; P < 0.001).
Figure 1. Ipsilateral impairments of DAergic signaling in unilateral 6-OHDA-lesioned hemiparkinsonian rat models. (A) Apomorphine rotation test (n = 10 rats/group). (B) Representative photomicrographs and bar graphs (n = 3 rats/group) showing immunoreactivity of TH + cell bodies in the SN (scale bar = 400 μm). (C) Representative photomicrographs and bar graphs (n = 3 rats/group) showing TH + immunoreactive fiber density in the STR (scale bar = 1000 μm). Data are expressed as the means ± SEs. ***P < 0.001. 6-OHDA, 6-hydroxydopamine-lesioned group; DA, dopamine; Sham, sham-operated controls; STR, striatum; SN, substantia nigra; TH, tyrosine hydroxylase.
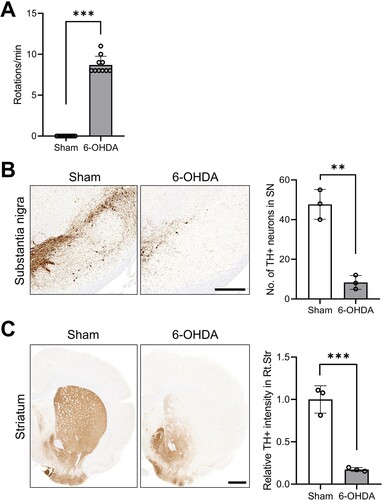
Immunohistochemical analyses showed a significant reduction in TH-positive immunoreactive cells and fibers in both the ipsilateral substantia nigra ((B); t(4) = 8.752; P < 0.001) and striatum ((C); t(4) = 8.738; P < 0.001) after unilateral 6-OHDA treatment ((B)), consistent with a prior study (Kim et al. Citation2022; Lee et al. Citation2023).
Unilateral striatal 6-OHDA infusion impairs hippocampus-related behaviors in rats
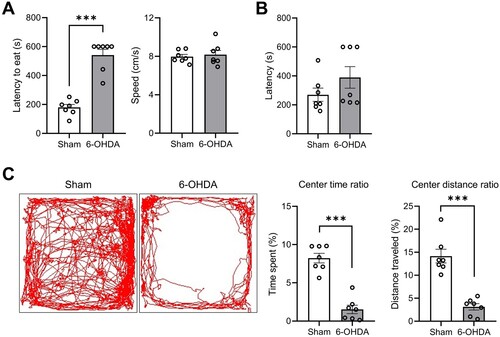
Seven weeks post-striatal 6-OHDA infusion, we utilized the novelty-suppressed feeding test as a metric to assess anxiety- and depression-like behavior. The latency in approaching the food was recorded, with longer latencies indicative of anxiety and depression. The 6-OHDA-lesioned group exhibited significantly prolonged latencies ((A), left panel; t(12) = 8.150; P < 0.0001). However, no significant differences were noted in walking speeds between the sham-operated control and 6-OHDA-lesioned groups ((A), right panel; t(12) = 0.4189; P = 0.6827). To further ensure that variations in olfactory function did not influence our results, we conducted a buried-food seeking test, which yielded no discernible differences ((B); t(12) = 1.369, P = 0.1961). In the open field test, the time spent in the center of the arena was used as a key parameter to indicate anxiety. The movement time spent ratio (t(12) = 7.996; P < 0.0001) and distance traveled ratio (t(12) = 6.701; P < 0.0001) in the central area were significantly decreased in the 6-OHDA-lesioned group ((C), right panels). Thus, the hemiparkinsonian rat model employed in this study demonstrated anxiety- and depression-like behaviors as evidenced by the novelty-suppressed feeding test and open field test results.
Figure 2. Hippocmapus-related behavioral impairments in unilateral striatal 6-OHDA-lesioned rat models. (A) Latency and speed of eating in the novelty-suppressed feeding test. (B) Latency of discovery in the buried food-seeking test. (C) The percentage of time spent (left panel) and distance traveled (right panel) in the center area within the open field test (OFT). Data are expressed as the means ± SEs (n = 7 rats/group). ***P < 0.001. 6-OHDA, 6-hydroxydopamine-lesioned group; Sham, sham-operated controls.
Quality control of RNA-Seq and identification of DEGs
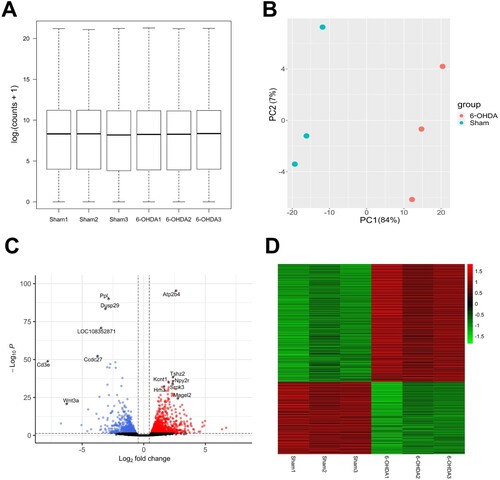
To examine the data distributions, we conducted principal component (PC) and density distribution analyses. The density distribution analysis indicated consistent counts in the hippocampi of the sham-operated control and 6-OHDA-lesioned rats ((A)). PC analysis was used to effectively distinguish between the transcriptomes in the hippocampi of both groups. In six samples, 84% and 7% of the variance was explained by PC1 and PC2, respectively. The data points corresponding to the 6-OHDA-lesioned rats (depicted as red dots in (B)) are positioned on the right, while those representing the sham-operated controls (shown as blue dots in (B)) are presented on the left. This suggests that PC1 captures the expression level changes in response to striatal 6-OHDA infusion. Thus, RNA-seq analysis identified 1018 DEGs in the hippocampi of 6-OHDA-lesioned rats, compared to the sham-operated controls, with 631 showing upregulation and 387 displaying downregulation ((C and D)).
Figure 3. Quality assessment of RNA-seq data and the identification of DEGs in the hippocampi of sham versus 6-OHDA-lesioned rats. (A) Boxplots with normalized counts per sample are shown in the hippocampi of sham and 6-OHDA-induced rats. The X-axis represents samples, while the Y-axis represents log2 (counts + 1). (B) The PCA plot displayed the first two principal components of each sample. A distinct sample corresponds to each dot. Colors indicate whether the sample is derived from a 6-OHDA-induced rat (red) or from a sham rat (blue) (C) The volcano plot illustrates DEGs between sham and 6-OHDA-lesioned rats. Red and blue dots indicate significantly upregulated and downregulated genes, respectively. Black dots indicate genes without significant changes in 6-OHDA lesioned rats compared to shams. (D) The heatmap depicts DEGs between sham and 6-OHDA lesioned rats. Red and green colors represent upregulation and downregulation, respectively. Sham, sham-operated controls; 6-OHDA, 6-hydroxydopamine-lesioned group; PC, principal component.
Functional analysis of DEGs in the hippocampi of striatal 6-OHDA-lesioned rats
GO analysis unveiled enriched terms associated with the BPs in the hippocampi of the 6-OHDA-lesioned rats, which included the adenylate cyclase-modulating G protein-coupled receptor signaling, synaptic signaling, axon development, trans-synaptic signaling, chemical synaptic transmission, and nervous system development pathways ((A)). Moreover, (B) illustrates the interplay between the enriched terms. Further examination of GOCCs revealed enrichment in areas including the integral components of the synaptic membranes, postsynaptic membranes, synaptic membrane, and receptor complex ((A)). The network map illustrates the relationships among these enriched CC pathways ((B)). In the category of GOMFs, receptor and channel-related pathways, such as neurotransmitter receptor activity, G protein-coupled peptide receptor activity, gated channel activity, and ion channel activity, were enriched in the hippocampi of the 6-OHDA-lesioned rats ((A)), while the network map provides a visual representation of these relationships ((B)). The detailed report on the GO analysis in the hippocampi of the 6-OHDA-lesioned rats is provided in and Supplementary Table 1.
Figure 4. GOBP analysis of DEGs in the hippocampi. (A) Dot plot of enriched genes and GOBP terms (top 10) in the 6-OHDA-lesioned hippocampi (fold-change > 1.5 and adjusted P < 0.05). (B) Interaction plot showing the relationships between the enriched terms.
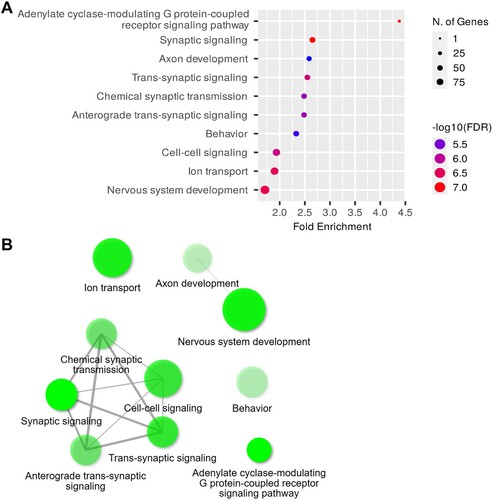
Figure 5. GOCC analysis of DEGs in the hippocampi. (A) Dot plot of enriched genes and GOCC terms (top 10) in the 6-OHDA-lesioned hippocampi (fold-change > 1.5 and adjusted P < 0.05). (B) Interaction plot showing the relationships between the enriched terms.
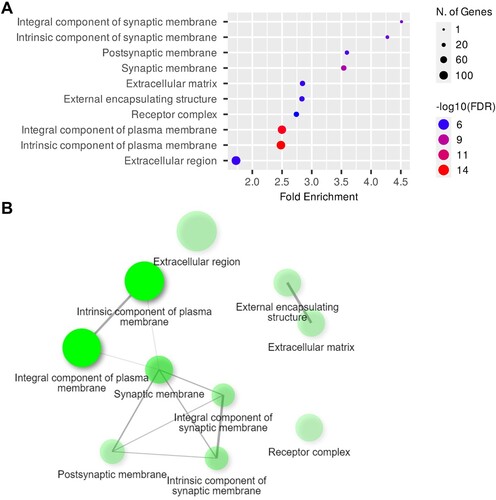
Figure 6. GOMF analysis of DEGs in the hippocampi. (A) Dot plot of enriched genes and GOMF terms (top 10) in the 6-OHDA-lesioned hippocampi (fold-change > 1.5 and adjusted P < 0.05). (B) Interaction plot showing the relationships between the enriched terms.
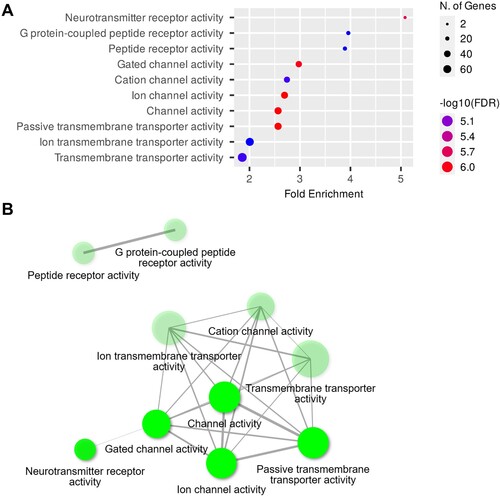
Table 2. GO term enrichment analysis of DEGs in ipsilateral hippocampi of striatal 6-OHDA-lesioned rats under GOBP, GOCC, and GOMF.
Additionally, the KEGG pathway enrichment analysis of the DEGs was performed in both the hippocampi of the sham-operated control and 6-OHDA-lesioned rats. The analysis revealed the top five significantly enriched KEGG pathways, which included neuroactive ligand–receptor interactions (Supplementary Figure S1), calcium signaling (Supplementary Figure S2), cAMP signaling (Supplementary Figure S3), axon guidance (Supplementary Figure S4), and notch signaling pathways (Supplementary Figure S5). These findings strongly implicate neurotransmission-related pathways (, , and Supplementary Table 2), thereby providing a foundation for the further elucidation of biological functions of candidate genes in the hippocampi of 6-OHDA-lesioned rats.
Figure 7. KEGG pathway analysis of DEGs in the hippocampi. The bar graphs illustrate the top 10 enriched KEGG pathways.
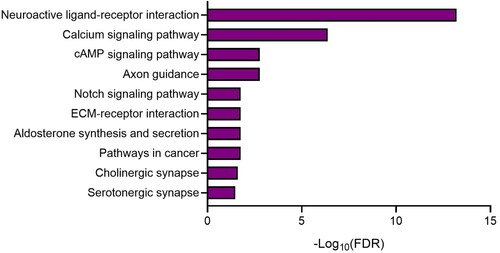
Table 3. KEGG pathway analysis of DEGs in ipsilateral hippocampi of striatal 6-OHDA-lesioned rats.
RT-qPCR validation of DEGs in the hippocampi of striatal 6-OHDA-lesioned rats
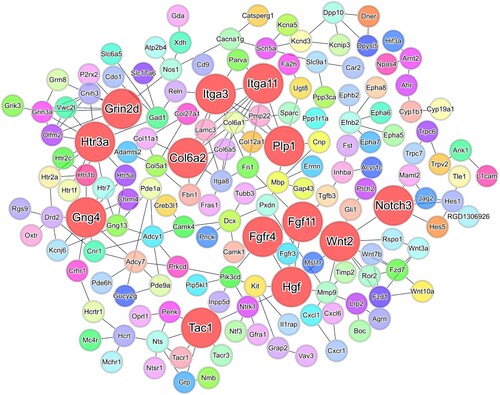
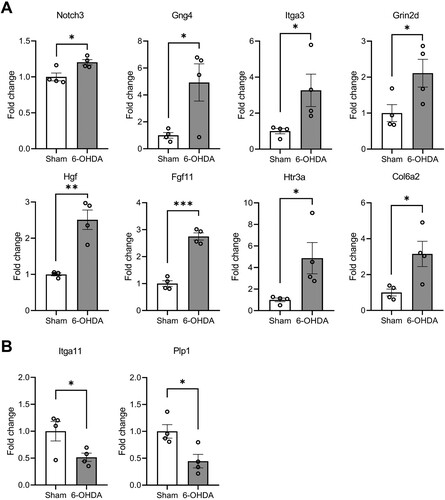
Both RNA-seq and RT-qPCR were employed to provide a comparative analysis of the gene expression, focusing on hub genes with notable biological significance. In the hippocampi of the 6-OHDA-lesioned rats, PPI network analysis by STRING identified 13 hub genes among the DEGs (Supplementary Figure S6). To validate our findings, RT-qPCR was employed to confirm the expression levels of the hub genes. Among the 10 validated genes, Notch receptor 3 (Notch3), G protein subunit gamma 4 (Gng4), integrin subunit alpha 3 (Itga3), glutamate ionotropic receptor NMDA type subunit 2D (Grin2d), hepatocyte growth factor (Hgf), fibroblast growth factor 11 (Fgf11), 5-hydroxytryptamine receptor 3a (Htr3a), and collagen type VI alpha 2 chain (Col6a2) were all upregulated, whereas integrin subunit alpha 11 (Itga11) and proteolipid protein 1 (Plp1) were both downregulated ().
Figure 8. PPI network for DEGs in the hippocampi. PPI network based on the STRING database shows interactions between shared DEGs in hippocampi of 6-OHDA-lesioned rats (confidence value of 0.7). In the PPI network, nodes represent genes; larger and red-colored nodes indicate hub genes (Notch3, Gng4, Itga3, Grin2d, Hgf, Fgf11, Htr3a, Itga11, Plp1, and Col6a2). Edge thickness represents the strength of support by the data. Abbreviations for the upregulated genes: Notch receptor 3 (Notch3), G protein subunit gamma 4 (Gng4), integrin subunit alpha 3 (Itga3), glutamate ionotropic receptor NMDA type subunit 2D (Grin2d), hepatocyte growth factor (Hgf), fibroblast growth factor 11 (Fgf11), 5-hydroxytryptamine receptor 3a (Htr3a), and collagen type VI alpha 2 chain (Col6a2); downregulated genes: integrin subunit alpha 11 (Itga11) and proteolipid protein 1 (Plp1).
Validation of the gene expression revealed significantly elevated levels of Notch3 (Mean (M) = 1.20, standard error of mean (SEM) = 0.04, t(6) = 3.083, P = 0.0216), Gng4 (M = 4.92, SEM = 1.38, t(6) = 2.805, P = 0.0309), Itga3 (M = 3.27, SEM = 0.90, t(6) = 2.488, P = 0.0473), Grin2d (M = 2.11, SEM = 0.39, t(6) = 2.452, P = 0.0496), Hgf (M = 2.51, SEM = 0.27, t(6) = 5.562, P = 0.0014), Fgf11 (M = 2.75, SEM = 0.13, t(6) = 10.130, P < 0.0001), Htr3a (M = 4.87, SEM = 1.45, t(6) = 2.651, P = 0.0380), and Col6a2 (M = 3.15, SEM = 0.71, t(6) = 2.943, P = 0.0259) in the hippocampi of 6-OHDA-lesioned rats ((A)). Additionally, a significant decrease was observed in the expression of Itga11 (M = 0.48, SEM = 0.09, t(6) = 2.466, P = 0.0438) and Plp1 (M = 0.45, SEM = 0.13, t(6) = 3.123, P = 0.0205) ((B)). Thus, these findings affirm the consistency between the RT-qPCR validation and RNA-seq analysis and provide further support for the potential role of selected genes in hippocampal dysfunction in striatal 6-OHDA-lesioned rats.
Figure 9. RT-qPCR validation of DEGs in the hippocampi. The bar graphs show the relative expression levels of upregulated (A) and downregulated (B) genes from RNA-seq data. Data are mean ± SEM (n = 4 per group). 6-OHDA, 6-hydroxydopamine-lesioned group; Sham, sham-operated controls. *P < 0.05; **P < 0.01.
Discussion
The hallmark pathological feature of PD is the loss of DAergic neurons in the substantia nigra, which leads to dopamine deficiency in the striatum (Weerasinghe-Mudiyanselage et al. Citation2023). Notably, Trabucchi et al. (Citation1979) reported that most patients with Parkinsonian syndrome are predominantly affected on one side. To replicate this asymmetric presentation, we utilized a unilateral striatal 6-hydroxydopamine (6-OHDA) lesioned rat model, a well-established neurotoxin-induced hemiparkinsonian model (Trabucchi et al. Citation1979; Kondo et al. Citation2004). Initially, to validate the ipsilateral loss of DAergic signaling in the nigrostriatal system, we confirmed the onset of apomorphine-induced contralateral rotation behaviors. Moreover, an imbalance in DAergic signaling within the nigrostriatal system may contribute to the development of non-motor symptoms associated with PD onset and progression (Kim et al. Citation2022; Weerasinghe-Mudiyanselage et al. Citation2023). As such, our focus in this study centered on non-motor symptoms, particularly neuropsychiatric manifestations.
The hippocampus plays a pivotal role in PD neuropsychiatric symptoms (Calabresi et al. Citation2013), while neuroplasticity in PD is intricately linked with the DAergic system (Regensburger et al. Citation2014). DA exerts influence over the long-term potentiation of the hippocampus (Zhu et al. Citation2011) and overall hippocampal function (Kutlu and Gould Citation2016). Our investigation revealed significant anxiety- and depression-like behaviors in rats with unilateral striatal 6-OHDA infusion, as assessed through the novelty-suppressed feeding and open field tests, which are behaviors suggestive of hippocampal dysfunction in this model. However, the molecular mechanisms underpinning hippocampal dysfunction in the hemiparkinsonian rat model remain inadequately characterized. Here, we used RNA-seq to conduct an in-depth analysis of gene expression profiles in the hippocampi of rats subjected to unilateral striatal 6-OHDA lesions. Compared to the sham-operated controls, we identified a total of 1018 differentially expressed genes (DEGs) in the hippocampi of rats with striatal 6-OHDA lesions, whereby 631 were upregulated and 387 were downregulated. To gain further insights, we performed GO, KEGG, and STRING analyses to elucidate the functional changes associated with these DEGs in the hippocampi of rats with striatal 6-OHDA lesions.
GO analysis revealed that the DEGs were predominantly associated with pathways related to synaptic signaling and receptor functions. Notably, GOBP terms related to pathways, such as adenylate cyclase-modulating G protein-coupled receptor signaling, synaptic signaling, trans-synaptic signaling, and chemical synaptic transmission, exhibited the most significant enhancements. In the category of GOCCs, pathways associated with synaptic membranes were prominently enriched in the hippocampi of this animal model. Furthermore, functions related to neurotransmitter receptors, channels, and transporters were notably enriched in GOMFs. Synaptic plasticity plays a vital role in regulating the strength and efficiency of synaptic transmission in the hippocampus, as well as in the reorganization of synaptic components and receptors (Schaefers and Teuchert-Noodt Citation2016). Additionally, it is involved in the consolidation and long-term storage of memories (Kim et al. Citation2022). The reinforcement of plasticity is commonly referred to as long-term potentiation, while its weakening is known as long-term depression (Avchalumov and Mandyam Citation2021). Understanding synaptic plasticity in the hippocampus is crucial for comprehending the pathogenesis of depression and other neuropsychiatric symptoms associated with PD (Bagetta et al. Citation2010). Collectively, the insights gleaned from GO functional analysis provide valuable perspectives into the potential molecular mechanisms driving neuropsychiatric symptoms in this particular PD model.
Conducting KEGG pathway analysis of the DEGs revealed several potential underlying mechanisms, such as the neuroactive ligand–receptor interaction pathway, the calcium signaling pathway, and the cAMP signaling pathway. The neuroactive ligand–receptor interaction pathway encompasses a collection of receptors located on the plasma membranes that facilitate signal transductions from the extracellular environment into the cells (Lauss et al. Citation2007). Significantly enriched activity in this pathway may be indicative of more severe brain damage or alterations in synaptic plasticity (Huang et al. Citation2019). Additionally, the calcium (Ca2+) and cAMP signaling pathways play pivotal roles in intracellular signal transduction, which is crucial for mediating the physiological functions of the DAergic receptors. These functions include voluntary movement, working memory, attention, and learning (Ding et al. Citation2022). A substantial portion of Ca2+-mediated signal transduction occurs through the Ca2+/calmodulin-dependent protein kinase pathway, which influences various physiological functions, including the regulation of neurotransmitter synthesis and synaptic plasticity (Feng et al. Citation2022). Consequently, our hippocampal KEGG functional analysis data may be indicative of underlying brain dysfunction in a hemiparkinsonian rat model.
Furthermore, we constructed a PPI network wherein 10 genes, including Wnt2, Itga11, Plp1, Notch3, Gng4, Itga3, Grin2d, Hgf, Tac1, Fgfr4, Fgf11, Htr3a, and Col6a2, emerged as hub genes. These genes exhibited the highest number of interactions with other genes, signifying their pivotal role in mediating various biological processes. In addition, both the RNA-seq and RT-qPCR analyses demonstrated significant upregulations in the expression levels of Notch3, Gng4, Itga3, Grin2d, Hgf, Fgf11, Htr3a, and Col6a2, whereas the Itga11 and Plp1 expression levels were downregulated. Among the upregulated genes, Gng4, Grin2d, and Hgf exhibited patterns suggestive of an association with depression within the context of DAergic signaling. Gng4 serves as a vital component of heterotrimeric G-protein subunits (Tomita et al. Citation2013). Thus, the interactions and combinations of G-protein alpha, beta, and gamma subunits contribute to the G-protein-mediated signaling pathway specificities (Tomita et al. Citation2013). Accumulating evidence suggests that pathways related to G-protein-coupled receptors are implicated in mood disorders, including depression (Grammatopoulos Citation2017). Additionally, the N-methyl-d-aspartate receptor (NMDAR) is implicated in various disorders, such as altered cognitive functions, which are associated with aging, cerebral ischemia, depression, and schizophrenia (Olivares et al. Citation2012). NMDAR channels are heteromers, which are composed of the key receptor subunit NMDAR1 (GRIN1) and one or more of the four NMDAR2 subunits (GRIN2A, GRIN2B, GRIN2C, and GRIN2D). Alterations in the expression of major functional genes in the hippocampus play a crucial role in depression (Howland and Wang Citation2008). Notably, Amador et al. (Citation2020) demonstrated that the glutamatergic genes were upregulated in individuals who committed suicide during a depressive episode. Furthermore, HGF was shown to be a key factor in neuronal protection, preventing neuronal death, and enhancing neuroregeneration (Russo Citation2010). Moreover, HGF was observed to be highly expressed at nerve injury sites and promoted nerve repair (Ko et al. Citation2018). Previous studies also noted elevated levels of HGF in women with postpartum depression and in patients with major depressive disorders (Kahl et al. Citation2009). Therefore, the upregulation of Gng4, Grin2d, and Hgf in the hippocampus may be associated with the induction of anxiety- and depression-like behavior in this PD model.
Among the other upregulated genes, Itga3 assumes a critical role in the differentiation of neural stem cells, maintaining a delicate equilibrium between cell proliferation, differentiation, and apoptosis, thereby influencing cell fate during these differentiation processes (Zhang et al. Citation2017). However, it is notable that Itga3 overexpression can lead to synaptic dysfunction, and subsequently impact learning and memory abilities (Mascolo et al. Citation2017). Additionally, Notch is a large transmembrane receptor that is activated through ligand binding (Trujillo-Paredes et al. Citation2016). A previous study suggested that Notch performed significant roles in the nervous system, including in the maintenance of immature neurons, controlling neurite outgrowth in differentiated neurons, and regulating synaptic plasticity and olfactory functions in the adult brain (Hain et al. Citation2018). The upregulation of both Itga3 and Notch may contribute to the dysregulation and/or compensatory recovery of synaptic plasticity, potentially associating them with hippocampal dysfunction in this PD model.
Conversely, two hub genes, Itga11 and Plp1, were downregulated in this study. ITGA11, a member of the axon guidance gene family remodeling complex, assumes a pivotal role in neural development and dendritic outgrowth (Yao et al. Citation2012). It is integral in dendritic spine turnover cell–cell adhesion and the stability of synaptic contacts, which is a process involving transmembrane glycoproteins, such as cell adhesion molecules. These molecules are believed to operate via interactions between their cytoplasmic domains alongside cytoskeletal proteins (Kalish et al. Citation2018). Plp1 is indispensable in the mammalian central nervous system owing to its role in the myelin sheath formation (Kalish et al. Citation2018). It has been identified as a neuropeptide, which is abundantly expressed in vertebrate brains, supporting synaptic function amidst neuronal dysfunction (Luders et al. Citation2017). Consequently, both genes being downregulated may contribute to the reduction in hippocampal structural plasticity (Kim et al. Citation2022), potentially impacting the manifestation of the neuropsychiatric symptoms in this PD model.
In this study, we employed a hemiparkinsonian rat model by infusing 6-OHDA into the striatum to explore hippocampal function and gene expression profiles. While our investigation offers valuable insights into the transcriptomic changes occurring during the chronic phase of 6-OHDA-induced hemiparkinsonism, certain concerns arise regarding the specificity of these changes in the hippocampal gene profile to hemiparkinsonism alone. Primarily, there is a possibility that the unilateral infusion of 6-OHDA into the striatum affects DAergic signaling within the ipsilateral hippocampus, subsequently influencing hippocampal function and gene expression patterns. Previous studies have indicated a decrease in TH expression–a marker of DAergic activity–in ipsilateral brain regions, signifying ipsilateral DA depletion within both the nigrostriatal system and the hippocampus of this rat model (Lyu et al. Citation2021; Kim et al. Citation2022, Citation2023). Additionally, it is plausible that the striatal infusion of 6-OHDA may directly affect extrastriatal brain regions, including the hippocampus, even without DAergic depletion. Earlier research has reported mitochondrial damage, reactive oxidative stress, and neuroinflammation during the acute phase of 6-OHDA-lesioning in rats (Goncalves et al. Citation2019; Sodhi et al. Citation2021). However, despite these potential confounding factors, our study revealed substantial alterations in gene expression related to neurotransmitter receptors, synaptic transmission, calcium signaling pathways, and the cAMP signaling pathway in the hippocampus of 6-OHDA-lesioned rats, indicating possible DAergic effects despite our investigation being conducted during the chronic phase. Thus, while our study offers critical insights into the molecular mechanisms contributing to neuropsychiatric symptoms in PD, it is essential to acknowledge its limitations. Future studies should further investigate the specific etiologies underlying hippocampal damage in 6-OHDA-lesioned rats to provide a more comprehensive understanding of the observed changes in gene expression profiles.
In conclusion, this study employs transcriptome sequencing techniques to provide an in-depth analysis of gene expression profiles linked to hippocampal dysfunction in a hemiparkinsonian rat model, ultimately, identifying potential candidate genes. While our findings offer novel insights into the molecular mechanisms contributing to neuropsychiatric symptoms in PD, it is imperative that further genetic and experimental studies are conducted with more advanced techniques and larger sample sizes to validate our discoveries. This collective effort provides substantial scientific and clinical implications, furnishing a comprehensive understanding of PD pathogenesis, and unveiling potential therapeutic targets.
CRediT authorship contribution statement
B.K., S.H., and C.M. designed the research. B.K., S.H., J.L., and C.M. performed the research. B.K., S.H., J.L., S.K., J-S.K., C.J., T.S., B.Y., and C.M. acquired and analyzed the data. B.K., S.H., and C.M. wrote original draft of the paper. B.K., S.H., and C.M. modified the manuscript. All authors have read and agreed to the published version of the manuscript.
Supplemental Material
Download PDF (3.1 MB)Data availability
Data will be made available on request.
Disclosure statement
No potential conflict of interest was reported by the author(s).
Additional information
Funding
References
- Alieva AK, Filatova EV, Kolacheva AA, Rudenok MM, Slominsky PA, Ugrumov MV, Shadrina MI. 2017. Transcriptome profile changes in mice with MPTP-induced early stages of Parkinson's disease. Mol Neurobiol. 54(9):6775–6784. doi:10.1007/s12035-016-0190-y.
- Amador A, Bostick CD, Olson H, Peters J, Camp CR, Krizay D, Chen W, Han W, Tang W, Kanber A, et al. 2020. Modelling and treating GRIN2A developmental and epileptic encephalopathy in mice. Brain. 143(7):2039–2057. doi:10.1093/brain/awaa147.
- Ang MJ, Lee S, Kim JC, Kim SH, Moon C. 2021. Behavioral tasks evaluating schizophrenia-like symptoms in animal models: a recent update. Curr Neuropharmacol. 19(5):641–664. doi:10.2174/1570159X18666200814175114.
- Avchalumov Y, Mandyam CD. 2021. Plasticity in the hippocampus, neurogenesis and drugs of abuse. Brain Sci. 11(3):404. doi:10.3390/brainsci11030404.
- Bagetta V, Ghiglieri V, Sgobio C, Calabresi P, Picconi B. 2010. Synaptic dysfunction in Parkinson's disease. Biochem Soc Trans. 38(2):493–497. doi:10.1042/BST0380493.
- Barrett T, Troup DB, Wilhite SE, Ledoux P, Rudnev D, Evangelista C, Kim IF, Soboleva A, Tomashevsky M, Marshall KA, et al. 2009. Ncbi GEO: archive for high-throughput functional genomic data. Nucleic Acids Res. 37(Database issue):D885–D890. doi:10.1093/nar/gkn764.
- Benjamini Y, Hochberg Y. 1995. Controlling the false discovery rate - a practical and powerful approach to multiple testing. J R Stat Soc B. 57(1):289–300. doi:10.1111/j.2517-6161.1995.tb02031.x.
- Berretta N, Berton F, Bianchi R, Capogna M, Francesconi W, Brunelli M. 1990. Effects of dopamine, D-1 and D-2 dopaminergic agonists on the excitability of hippocampal CA 1 pyramidal cells in Guinea pig. Exp Brain Res. 83:124–130. doi:10.1007/BF00232200.
- Blasco-Serra A, Gonzalez-Soler EM, Cervera-Ferri A, Teruel-Marti V, Valverde-Navarro AA. 2017. A standardization of the novelty-suppressed feeding test protocol in rats. Neurosci Lett. 658:73–78. doi:10.1016/j.neulet.2017.08.019.
- Calabresi P, Castrioto A, Di Filippo M, Picconi B. 2013. New experimental and clinical links between the hippocampus and the dopaminergic system in Parkinson's disease. Lancet Neurol. 12(8):811–821. doi:10.1016/S1474-4422(13)70118-2.
- Chin CH, Chen SH, Wu HH, Ho CW, Ko MT, Lin CY. 2014. Cytohubba: identifying hub objects and sub-networks from complex interactome. BMC Syst Biol. 8:(Suppl 4):S11. doi:10.1186/1752-0509-8-4.
- Costa C, Sgobio C, Siliquini S, Tozzi A, Tantucci M, Ghiglieri V, Di Filippo M, Pendolino V, de Iure A, Marti M, et al. 2012. Mechanisms underlying the impairment of hippocampal long-term potentiation and memory in experimental Parkinson's disease. Brain. 135(Pt 6):1884–1899. doi:10.1093/brain/aws101.
- Ding J, Ding Y, Wu J, Deng J, Yu Q, Wang J. 2022. “Jing-Ning Granules” Can alleviate attention deficit hyperactivity disorder in rats by modulating dopaminergic D2/D1-like receptor-mediated signaling pathways. Evid-Based Compl Alt. 2022:9139841.
- El Mahdy EM, Gamal M, Aboulhoda BE, Al Dreny BA, Shamaa A, Rashed L, Abdallah ANE, Shamseldeen AM. 2023. Amelioration of rotenone-induced Parkinson's disease; comparing therapeutic role of erythropoietin versus low-level laser activation of mesenchymal stem cells (an in-vivo and in-vitro study). Anim Cells Syst. 27(1):272–286. doi:10.1080/19768354.2023.2273467.
- Feng C, Li X, Sha H, Luo X, Zou G, Liang H. 2022. Comparative transcriptome analysis provides novel insights into the molecular mechanism of the silver carp (Hypophthalmichthys molitrix) brain in response to hypoxia stress. Comp Biochem Phys D. 41:100951.
- Ge SX, Jung D, Yao R. 2020. Shinygo: a graphical gene-set enrichment tool for animals and plants. Bioinformatics. 36(8):2628–2629. doi:10.1093/bioinformatics/btz931.
- Ghiglieri V, Sgobio C, Costa C, Picconi B, Calabresi P. 2011. Striatum-hippocampus balance: from physiological behavior to interneuronal pathology. Prog Neurobiol. 94(2):102–114. doi:10.1016/j.pneurobio.2011.04.005.
- Goncalves DF, Courtes AA, Hartmann DD, da Rosa PC, Oliveira DM, Soares FAA, Dalla Corte CL. 2019. 6-Hydroxydopamine induces different mitochondrial bioenergetics response in brain regions of rat. Neurotoxicology. 70:1–11. doi:10.1016/j.neuro.2018.10.005.
- Grammatopoulos DK. 2017. Regulation of G-protein coupled receptor signalling underpinning neurobiology of mood disorders and depression. Mol Cell Endocrinol. 449:82–89. doi:10.1016/j.mce.2017.02.013.
- Hain EG, Sparenberg M, Rasinska J, Klein C, Akyuz L, Steiner B. 2018. Indomethacin promotes survival of new neurons in the adult murine hippocampus accompanied by anti-inflammatory effects following MPTP-induced dopamine depletion. J Neuroinflammation. 15(1):162. doi:10.1186/s12974-018-1179-4.
- Halliday GM, Leverenz JB, Schneider JS, Adler CH. 2014. The neurobiological basis of cognitive impairment in Parkinson's disease. Mov Disord. 29(5):634–650. doi:10.1002/mds.25857.
- Hong S, Weerasinghe-Mudiyanselage PDE, Kang S, Moon C, Shin T. 2023. Retinal transcriptome profiling identifies novel candidate genes associated with visual impairment in a mouse model of multiple sclerosis. Anim Cells Syst (Seoul). 27(1):219–233. doi:10.1080/19768354.2023.2264354.
- Howland JG, Wang YT. 2008. Synaptic plasticity in learning and memory: stress effects in the hippocampus. Prog Brain Res. 169:145–158. doi:10.1016/S0079-6123(07)00008-8.
- Huang GH, Cao XY, Li YY, Zhou CC, Li L, Wang K, Li H, Yu P, Jin Y, Gao L. 2019. Gene expression profile of the hippocampus of rats subjected to traumatic brain injury. J Cell Biochem. 120(9):15776–15789. doi:10.1002/jcb.28848.
- Infante J, Prieto C, Sierra M, Sanchez-Juan P, Gonzalez-Aramburu I, Sanchez-Quintana C, Berciano J, Combarros O, Sainz J. 2015. Identification of candidate genes for Parkinson's disease through blood transcriptome analysis in LRRK2-G2019S carriers, idiopathic cases, and controls. Neurobiol Aging. 36(2):1105–1109. doi:10.1016/j.neurobiolaging.2014.10.039.
- Kahl KG, Bens S, Ziegler K, Rudolf S, Kordon A, Dibbelt L, Schweiger U. 2009. Angiogenic factors in patients with current major depressive disorder comorbid with borderline personality disorder. Psychoneuroendocrinology. 34(3):353–357. doi:10.1016/j.psyneuen.2008.09.016.
- Kalish BT, Cheadle L, Hrvatin S, Nagy MA, Rivera S, Crow M, Gillis J, Kirchner R, Greenberg ME. 2018. Single-cell transcriptomics of the developing lateral geniculate nucleus reveals insights into circuit assembly and refinement. Proc Natl Acad Sci USA. 115(5):E1051–E1060. doi:10.1073/pnas.1717871115.
- Kang HJ, Kawasawa YI, Cheng F, Zhu Y, Xu X, Li M, Sousa AM, Pletikos M, Meyer KA, Sedmak G, et al. 2011. Spatio-temporal transcriptome of the human brain. Nature. 478(7370):483–489. doi:10.1038/nature10523.
- Kim B, Kim JS, Youn B, Moon C. 2023. Dopamine depletion alters neuroplasticity-related signaling in the rat hippocampus. Anim Cells Syst (Seoul). 27(1):436–446. doi:10.1080/19768354.2023.2294308.
- Kim B, Weerasinghe-Mudiyanselage PDE, Ang MJ, Lee J, Kang S, Kim JC, Kim SH, Kim JS, Jung C, Shin T, et al. 2022. Changes in the neuronal architecture of the hippocampus in a 6-hydroxydopamine-lesioned Rat model of Parkinson disease. Int Neurourol J. 26(Suppl 2):S94–105. doi:10.5213/inj.2244252.126.
- Ko KR, Lee J, Lee D, Nho B, Kim S. 2018. Hepatocyte growth factor (HGF) promotes peripheral nerve regeneration by activating repair Schwann cells. Sci Rep. 8(1):8316. doi:10.1038/s41598-018-26704-x.
- Kondo J, Kitamura Y, Inden M, Taniguchi T. 2004. Hemiparkinsonian rat models: different sensitivity of dopaminergic neurotoxins. Int Congr Ser. 1260:281–285. doi:10.1016/S0531-5131(03)01573-5.
- Kutlu MG, Gould TJ. 2016. Effects of drugs of abuse on hippocampal plasticity and hippocampus-dependent learning and memory: contributions to development and maintenance of addiction. Learn Mem. 23(10):515–533. doi:10.1101/lm.042192.116.
- Langmead B, Salzberg SL. 2012. Fast gapped-read alignment with Bowtie 2. Nat Methods. 9(4):357–359. doi:10.1038/nmeth.1923.
- Lauss M, Kriegner A, Vierlinger K, Noehammer C. 2007. Characterization of the drugged human genome. Pharmacogenomics. 8(8):1063–1073. doi:10.2217/14622416.8.8.1063.
- Lee J, Weerasinghe-Mudiyanselage PDE, Kim B, Kang S, Kim JS, Moon C. 2023. Impact of diesel particulate matter on the olfactory bulb of mice: insights from behavioral, histological, and molecular assessments. Mol Cell Toxicol. In press. doi:10.1007/s13273-023-00414-6.
- Lisman JE, Grace AA. 2005. The hippocampal-VTA loop: controlling the entry of information into long-term memory. Neuron. 46(5):703–713. doi:10.1016/j.neuron.2005.05.002.
- Love MI, Huber W, Anders S. 2014. Moderated estimation of fold change and dispersion for RNA-seq data with DESeq2. Genome Biol. 15(12):550. doi:10.1186/s13059-014-0550-8.
- Luders KA, Patzig J, Simons M, Nave KA, Werner HB. 2017. Genetic dissection of oligodendroglial and neuronal Plp1 function in a novel mouse model of spastic paraplegia type 2. Glia. 65(11):1762–1776. doi:10.1002/glia.23193.
- Lyu Y, Huang Y, Shi G, Lei X, Li K, Zhou R, Bai L, Qin C. 2021. Transcriptome profiling of five brain regions in a 6-hydroxydopamine rat model of Parkinson's disease. CNS Neurosci Ther. 27(11):1289–1299. doi:10.1111/cns.13702.
- Mascolo A, Sessa M, Scavone C, De Angelis A, Vitale C, Berrino L, Rossi F, Rosano G, Capuano A. 2017. New and old roles of the peripheral and brain renin-angiotensin-aldosterone system (RAAS): focus on cardiovascular and neurological diseases. Int J Cardiol. 227:734–742. doi:10.1016/j.ijcard.2016.10.069.
- Moni MA, Rana HK, Islam MB, Ahmed MB, Xu H, Hasan MAM, Lei Y, Quinn JMW. 2019. A computational approach to identify blood cell-expressed Parkinson's disease biomarkers that are coordinately expressed in brain tissue. Comput Biol Med. 113:103385. doi:10.1016/j.compbiomed.2019.103385.
- Mu Y, Gage FH. 2011. Adult hippocampal neurogenesis and its role in Alzheimer's disease. Mol Neurodegener. 6(1):85. doi:10.1186/1750-1326-6-85.
- Olivares D, Deshpande VK, Shi Y, Lahiri DK, Greig NH, Rogers JT, Huang X. 2012. N-methyl D-aspartate (NMDA) receptor antagonists and memantine treatment for Alzheimer's disease, vascular dementia and Parkinson's disease. Curr Alzheimer Res. 9(6):746–758. doi:10.2174/156720512801322564.
- Parker KL, Lamichhane D, Caetano MS, Narayanan NS. 2013. Executive dysfunction in Parkinson's disease and timing deficits. Front Integr Neurosci. 7:75. doi:10.3389/fnint.2013.00075.
- R Core Team. 2013. R: a language and environment for statistical computing.
- Regensburger M, Prots I, Winner B. 2014. Adult hippocampal neurogenesis in Parkinson's disease: impact on neuronal survival and plasticity. Neural Plast. 2014:454696. doi:10.1155/2014/454696.
- Russo AJ. 2010. Decreased serum hepatocyte growth factor (HGF) in individuals with depression correlates with severity of disease. Biomark Insights. 5:63–67. doi:10.4137/BMI.S5183.
- Schaefers AT, Teuchert-Noodt G. 2016. Developmental neuroplasticity and the origin of neurodegenerative diseases. World J Biol Psychiatry. 17(8):587–599.
- Shannon P, Markiel A, Ozier O, Baliga NS, Wang JT, Ramage D, Amin N, Schwikowski B, Ideker T. 1971. Cytoscape: a software environment for integrated models. Genome Res. 13(22):426.
- Sodhi RK, Bansal Y, Singh R, Saroj P, Bhandari R, Kumar B, Kuhad A. 2021. IDO-1 inhibition protects against neuroinflammation, oxidative stress and mitochondrial dysfunction in 6-OHDA induced murine model of Parkinson's disease. Neurotoxicology. 84:184–197. doi:10.1016/j.neuro.2021.03.009.
- Speranza L, di Porzio U, Viggiano D, de Donato A, Volpicelli F. 2021. Dopamine: the neuromodulator of long-term synaptic plasticity, reward and movement control. Cells. 10(4):735. doi:10.3390/cells10040735.
- Szklarczyk D, Gable AL, Nastou KC, Lyon D, Kirsch R, Pyysalo S, Doncheva NT, Legeay M, Fang T, Bork P, et al. 2021. The STRING database in 2021: customizable protein–protein networks, and functional characterization of user-uploaded gene/measurement sets. Nucleic Acids Res. 49(D1):D605–D612. doi:10.1093/nar/gkaa1074.
- Tomita H, Ziegler ME, Kim HB, Evans SJ, Choudary PV, Li JZ, Meng F, Dai M, Myers RM, Neal CR, et al. 2013. G protein-linked signaling pathways in bipolar and major depressive disorders. Front Genet. 4:297. doi:10.3389/fgene.2013.00297.
- Trabucchi M, Albizzati MG, Frattola L, Scarlato G. 1979. Hemiparkinsonism. A human model for studying dopaminergic supersensitivity. Arch Neurol. 36(4):246–248. doi:10.1001/archneur.1979.00500400100020.
- Trujillo-Paredes N, Valencia C, Guerrero-Flores G, Arzate DM, Baizabal JM, Guerra-Crespo M, Fuentes-Hernandez A, Zea-Armenta I, Covarrubias L. 2016. Regulation of differentiation flux by Notch signalling influences the number of dopaminergic neurons in the adult brain. Biol Open. 5(3):336–347. doi:10.1242/bio.013383.
- Villar-Conde S, Astillero-Lopez V, Gonzalez-Rodriguez M, Villanueva-Anguita P, Saiz-Sanchez D, Martinez-Marcos A, Flores-Cuadrado A, Ubeda-Banon I. 2021. The human hippocampus in Parkinson's disease: an integrative stereological and proteomic study. J Parkinsons Dis. 11(3):1345–1365. doi:10.3233/JPD-202465.
- Wada M, Ang MJ, Weerasinghe-Mudiyanselage PDE, Kim SH, Kim JC, Shin T, Moon C. 2021. Behavioral characterization in MPTP/p mouse model of Parkinson's disease. J Integr Neurosci. 20(2):307–320. doi:10.31083/j.jin2002030.
- Wang N, Zhang L, Yang H, Luo X, Fan G. 2019. Do multiple system atrophy and Parkinson’s disease show distinct patterns of volumetric alterations across hippocampal subfields? An exploratory study. Eur Radiol. 29:4948–4956. doi:10.1007/s00330-019-06043-9.
- Weerasinghe-Mudiyanselage PDE, Kang S, Kim JS, Kim SH, Wang H, Shin T, Moon C. 2024. Changes in structural plasticity of hippocampal neurons in an animal model for multiple sclerosis. Zool Res. 45(2):398–414. doi:10.24272/j.issn.2095-8137.2023.309.
- Weerasinghe-Mudiyanselage PDE, Kang S, Kim JS, Moon C. 2023. Therapeutic approaches to non-motor symptoms of Parkinson's disease: a current update on preclinical evidence. Curr Neuropharmacol. 21(3):560–577. doi:10.2174/1570159X20666221005090126.
- Yao DB, Li MY, Shen DD, Ding F, Lu SB, Zhao Q, Gu XS. 2012. Gene expression profiling of the rat sciatic nerve in early Wallerian degeneration after injury. Neural Regen Res. 7(17):1285–1292.
- Zhang D, Yang S, Toledo EM, Gyllborg D, Salto C, Carlos Villaescusa J, Arenas E. 2017. Niche-derived laminin-511 promotes midbrain dopaminergic neuron survival and differentiation through YAP. Sci Signal. 10(493):eaal4165. doi:10.1126/scisignal.aal4165.
- Zhang H, Li J, Ren J, Sun S, Ma S, Zhang W, Yu Y, Cai Y, Yan K, Li W, et al. 2021. Single-nucleus transcriptomic landscape of primate hippocampal aging. Protein Cell. 12(9):695–716. doi:10.1007/s13238-021-00852-9.
- Zhu G, Chen Y, Huang Y, Li Q, Behnisch T. 2011. MPTP-meditated hippocampal dopamine deprivation modulates synaptic transmission and activity-dependent synaptic plasticity. Toxicol Appl Pharmacol. 254(3):332–341. doi:10.1016/j.taap.2011.05.007.