
ABSTRACT
The present study aimed to identify the NAT2 haplotypes, linkage disequilibrium, and novel NAT2 genetic variants among Jordanian population. We isolated the genomic DNA from 68 healthy, Arab, unrelated Jordanian volunteers to amplify the protein-coding region of NAT2 gene by polymerase chain reaction (PCR). Then, the amplified PCR products were sequenced using Applied Biosystems Model (ABI3730x1). It is found that the allele frequencies of known NAT2 genetic variants 191G>A, 282C>T, 341T>C, 481C>T, 590G>A, and 803A>G were 0.7, 26.5, 48.5, 35.3, 30.9, and 32.4%, respectively. The NAT2 allele frequencies were generally similar to those of white Europeans but different from those of Asian and African populations. The most common NAT2 haplotype was NAT2*5B with a frequency of 29.3%. According to the NAT2 haplotype frequencies, 72% (95% confidence interval 61.4–82.7%) of the volunteers were slow encoding NAT2 haplotype acetylators. The NAT2*5 represented variants 341T>C and 481C>T were in strong but not complete linkage disequilibrium (D′ = 0.8, r2 = 0.63). In addition, this study found a novel nonsynonymous NAT2 436G>A genetic variant with low frequency (0.7%). However, this novel variant was predicted to be tolerated and not harmful to the NAT2 protein, using in silico prediction tools. It is concluded that the frequency of slow encoding NAT2 haplotype was high among Jordanian volunteers, which may have effects on drug responses and susceptibility to some diseases, such as cancers.
1. Introduction
Human N-acetyltransferase 2 (NAT2) is a phase II drug-metabolizing enzyme, which is responsible for the acetylation of some drugs such as antituberculosis isoniazid and antimicrobial sulfonamides [Citation1,Citation2].
Acetylation of the drugs in humans is polymorphic. Humans can be divided, according to acetylation phenotype, into slow, intermediate, and fast acetylators [Citation3]. Slow acetylators have a higher plasma drug concentration than rapid acetylators, which may be associated with drug toxicity [Citation4]. This interindividual variation in drugs acetylation capacity is due to several patient factors, such as health status and genetic polymorphisms on the NAT2 gene [Citation5].
Genetic variations on the NAT2 gene may significantly influence the acetylating phenotype, thus affecting the drug’s efficacy, toxicity, and susceptibility to some diseases. Many studies have reported the association of genetic variants on NAT2 gene and cancers [Citation6]. In addition, NAT2 polymorphisms have been linked to developing autoimmune diseases and sulphasalazine-induced systemic lupus erythematosus [Citation7].
The NAT2 gene is located on chromosome 8, at p22. This gene is an intron-less protein-coding exon of 870-bp open reading DNA sequence encoding 290 amino acids [Citation8–Citation10]. The NAT2 protein receives its entire translated polypeptide sequence from exon 2 [Citation8].
In Jordan, the main NAT2 genetic alleles, NAT2*4, *5, *6, and *7, were genotyped using the polymerase chain reaction-restriction fragment length polymorphism (PCR-RFLP) technique, and it was found that the frequencies of these variants were different from those in Saudis and Egyptians but closer to those of the Iranian population [Citation11]. However, other NAT2 genetic alleles have not been investigated, and no study has screened the novel genetic variants, on the NAT2 gene, among the Jordanian population. Therefore, the current study aimed to identify the structure of the NAT2 gene in Jordanians, which may have an influence on the interethnic and interindividual variations in drug efficacy, toxicity, and susceptibility to the diseases.
2. Materials and methods
2.1. Chemical compounds
The PCR primers were designed and purchased from Integrated DNA Technologies (Iowa, USA). The Taq polymerase, Taq polymerase buffer, dNTPs, nuclease-free water, DNA ladder, and MgCl2 were obtained from Promega (Madison, WI, USA). Agarose gel and the gel electrophoresis buffer Tris-Borate-EDTA (TBE) were purchased from Bio-basic (Markham, Canada). The Redsafe dye was purchased from Intron Biotechnology (Gyeonggi, South Korea).
2.2. Samples collection
A total of 68 healthy unrelated Jordanian volunteers of both genders with a mean age of 27 ± 5 years agreed to participate in this study. The ethical committee at AlZaytoonah University of Jordan approved the study (reference number 18/04-2016), and written informed consent was obtained from each participant in accordance with the declaration of Helsinki [Citation12]. From each volunteer, 2 ml of venous blood was collected in EDTA tubes. The volunteers were healthy, as judged by a physical examination, with no chronic or serious diseases.
The sample size was determined according to the allele frequency of the major known NAT2 genetic variants with the power of the test (1 − β = 0.8).
2.3. DNA extraction
DNA was extracted using the Wizard® Genomic DNA purification kit. The genomic DNA was isolated from the blood leukocytes. The extracted DNA concentration was measured using the Nanodrop instrument Quawell DNA/Protein Analyzer (Sunnyvale, CA, USA), and the samples were diluted in nuclease-free water to a final concentration of 100 ng/μl for the PCR reaction.
2.4. Amplification of NAT2 gene
The NAT2 gene was amplified by PCR using a Bio-Rad T100TM (California, UK) thermal cycler. Two DNA fragments of NAT2 gene that represent the complete sequence of exon 2 of NAT2 gene were amplified using specific DNA primers (). The PCR conditions were as follows: 100 ng of the extracted genomic DNA was amplified in a 50 μl reaction volume containing 0.5 mM MgCl2, green Taq polymerase buffer, 0.2 mM dNTPs, 10 pmoles of each of forward and reverse primers (), and 1 unit of Taq DNA polymerase. After an initial denaturation at 94°C for 5 min, 30 cycles were performed consisting of denaturation step at 94°C for 1 min, an annealing step at 55°C for 1 min, and an elongation step at 72°C for 1 min, completed with a final cycle of elongation at 72°C for 7 min.
Table 1. Primer names, sequences, and annealing temperatures used in PCR amplification of the NAT2 gene.
2.5. Gel electrophoresis
The PCR products were separated on 2% agarose gel by applying an electrical current of 125 A for 30 min. The gel was stained by the Redsafe dye (Intron, South Korea). The size of the PCR product was compared with a standard-size 100 bp DNA loading ladder (Promega). The DNA bands were visualized by a benchtop UV transilluminator (Bio Doc-ITTM, UK).
2.6. DNA sequencing
The PCR products were purified and then sent to GENEWIZ company (San Diego, USA) for sequencing of the functional exon 2 in the NAT2 gene using the same PCR forward primer. The novel genetic variant found in this study was confirmed by resequencing of the PCR product using the reverse primer. Sequence analysis was performed using the Applied Biosystems Model (ABI3730x1), which is based on the dye terminator method [Citation13]. The chromatograms of the DNA sequences were visualized using DNA Based v3.5.4 software (Heracle BioSoft, Romania). The alignment of DNA sequences was determined using Multialign software [Citation14]. The NAT2 amino acid sequence of the different species was obtained from GenBank databases [Citation15].
2.7. Linkage disequilibrium and haplotype distribution
The linkage disequilibrium (LD) analysis, estimation of haplotype diversity, and Hardy–Weinberg equilibrium test were carried out using Haploview 4.2 population genetic analysis software. Five NAT2 variants with minor allele frequencies >5%, 282C>T, 341T>C, 481C>T, 590G>A, and 803 A>G, were applied to Haploview software [Citation16]. The LD for each pair of genetic variants was measured using |Dʹ| and correlation coefficient (r2) as described previously [Citation17,Citation18].
2.8. In silico prediction of NAT2 protein stability change and molecular modeling
The current study applied three different software programs, PolyPhen 2.0, SIFT, and Mutpred, in order to predict the effect of amino acid substitution, caused by the novel NAT2 436G>C nonsynonymous genetic variant on NAT2 protein’s stability and function [Citation19,Citation20]. These software programs used numerical scores representing the probability that nonsynonymous substitution is damaging. PolyPhen-2, Mutpred, and SIFT scores use the same range, 0.0–1.0, but with opposite meanings. A variant with PolyPhen-2 and Mutpred score of 0.0 is predicted to be benign, whereas it is not tolerated in SIFT software.
For molecular modeling of NAT2 protein, visualized (VMD) software was used as described previously [Citation21]. The human NAT2 structure was obtained from the Worldwide Protein Data Bank [Citation22].
2.9. Statistical analysis
The NAT2 allele frequencies were tested for Hardy–Weinberg equilibrium using the chi-square (χ2) test. Comparison of NAT2 alleles among Jordanians with NAT2 allele frequencies of other ethnic groups was done using the χ2 test by applying the SPSS statistics program (IBM Analytics, USA). The level p < 0.05 was considered as the cut-off value for significance.
3. Results
Two DNA sequences representing exon 2 within NAT2 gene were amplified using the PCR technique. shows the gel electrophoresis of the two amplified DNA fragments on 2% agarose gel. The sizes of the amplified fragments were 540 and 610 bp.
After DNA sequencing of the amplified NAT2 gene for 68 volunteers, the present study found six major known SNPs: 191G>A, 282C>T, 341T>C, 481C>T, 590 G>A, and 803 A>G. The frequencies of these major NAT2 SNPs are listed in . This study found that 341T>C was the most frequent genetic variant (48.5%, 95% CI = 40.1–56.9) among healthy Jordanian volunteers.
Table 2. Distribution of NAT2 genetic variants among the healthy Jordanian population (n = 68).
represents NAT2 genotypes among the Jordanian volunteers. All of the NAT2 genotypes were within the Hardy–Weinberg equation. This study found that heterozygote NAT2*5 341T>C (44%) and NAT2*11 481C>T (47.1%) genotypes were the most frequent heterozygote NAT2 genotypes. The homozygote NAT2*5 341T>C (26.4%) genotype was the most common homozygote NAT2 genotype among the Jordanian volunteers in this study.
Table 3. Distribution of NAT2 genotype among the healthy Jordanian population (n = 68).
There is an interethnic variation in the frequencies of NAT2 genetic variants [Citation5]. The present study compared the NAT2 allele frequencies among Jordanians, found in this study, with the frequencies reported among the major ethnic groups in HapMap data [Citation23], Egyptian [Citation24] and Saudi Arabian [Citation25]. This study found that Chinese Asians had a significant difference (χ2, p < 0.05) in all NAT2 allele frequencies, in comparison with Jordanians (). Sub-Saharan Africans had more significant NAT2*13 282C>T (52.2%) and less significant NAT2*5 341T>C (25%) and NAT2*11 481C>T (15%) frequencies, in comparison with Jordanians. The frequency of NAT2 alleles was similar, with no significant difference, to NAT2 allele frequencies reported in Northern and Western Europeans, although, the 191G>A variant, which is found only in Africans but not in Caucasians, was detected among the Jordanian volunteers (0.7%). The frequency of 341T>C and 590G>A variants was not statistically different between Jordanians and what was reported among the Middle Eastern Egyptian and Saudi populations ().
Table 4. Comparison of NAT2 genetic allele frequencies among the Jordanian population with other major ethnic populations.
The haplotypes of the NAT2 gene among Jordanian volunteers were analyzed using Haploview software. It was shown in the current study that the NAT2*5B slow acetylator haplotype (29.3%) was the most common frequent NAT2 haplotype (). In addition, the slow acetylator NAT2*6A (23.5%) and fast acetylator NAT2*4 (22.7%) haplotype were highly frequent among the Jordanian volunteers. The lowest frequent NAT2 haplotype among Jordanians, found in this study, was for the NAT2*5K haplotype (1%).
Table 5. NAT2 haplotype among the healthy unrelated Jordanian population (n = 68).
It is reported that the acetylation phenotype is strongly affected by NAT2 genetic variants, and human acetylation capacity can be divided into fast and slow acetylators according to the NAT2 genetic variations [Citation10,Citation26]. Therefore, the present study predicted the acetylation phenotype among the Jordanian volunteers according to the results of the NAT2 haplotype (). Accordingly, the present study found that 28% of the volunteers were fast, while 72% were slow encoding acetylators.
Table 6. Predicted acetylation phenotype among the healthy unrelated Jordanian population (n = 68).
The LD of NAT2 SNPs was also analyzed using Haploview software. As shown in , NAT2 282C>T was in complete LD (D′ = 1) with 341T>C and 481C>T genetic variations. The NAT2 803A>G was also in complete LD (D′ = 1) with 590 G>A and 341T>C genetic variations. Furthermore, NAT2 481C>T and 590G>A were in complete LD (D′ = 1, r2 = 0.76). The NAT2 341T>C and 481C>T were in strong LD, as represented by a red-colored square on , but not in complete LD (D′ = 0.8, r2 = 0.63).
Figure 1. Gel electrophoresis of the PCR products of NAT2 gene. The NAT2 gene sequence was amplified by two PCR reactions represented by the first fragment (A) and second fragment (B).
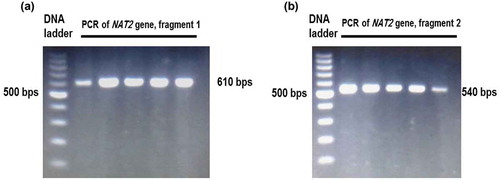
Figure 2. Linkage disequilibrium (LD) of NAT2 genetic variants found among Jordanian volunteers. The LD was carried out using Haploview software. The red squares represent a strong LD, and the white square represents a weak LD. The blue square indicates that there is no LD. Only genetic variants with a frequency higher than 5% were used for identification of LD.
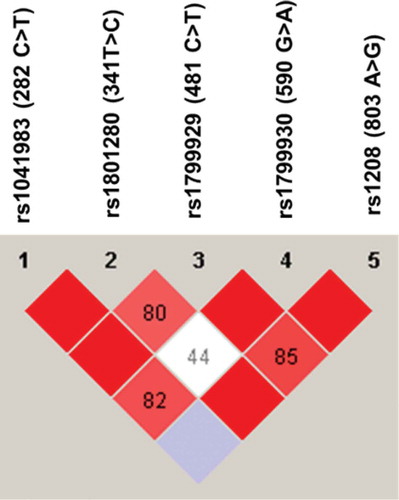
Figure 3. Chromatogram of DNA sequencing of the novel NAT2 436G>A genetic variant. The NAT2 436G>A was identified in only one Jordanian volunteer with a heterozygote genotype.
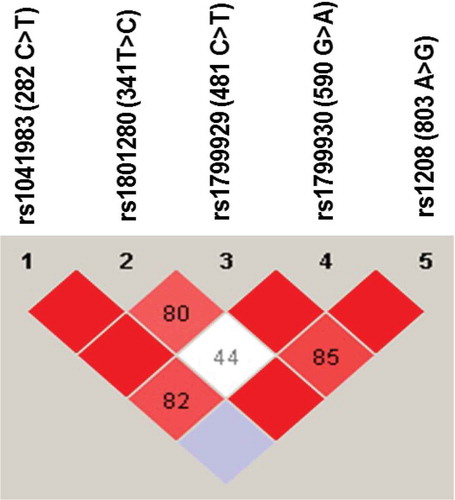
Figure 4. Alignment of NAT2 polypeptide sequences for different species. The alignment was carried out using Multialign software (Corpet, F. 1998). The NAT2 amino acid sequences of the different species were obtained from the PubMed amino acid sequence bank. Further information is provided in the Materials and methods section.
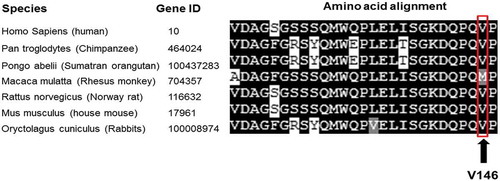
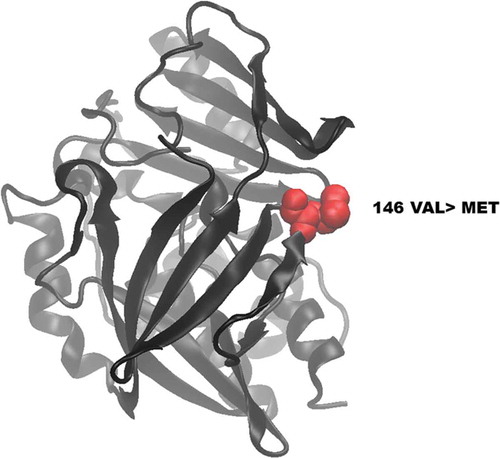
Figure 5. Visualization of wild-type and mutated NAT2 proteins. (A) shows the location of the novel mutated residue VAL146MET in the predicted model structure of NAT2 protein.
The present study found a novel genetic variant in Jordanians that was a substitution of guanine to adenine at nucleotide number 436 on the open reading frame of the NAT2 gene. The current study detected the novel 436G>A variant in only one Jordanian volunteer who carried this variant in heterozygote genotype (). To avoid any sequencing errors, this novel variant was confirmed by resequencing the sample using the reverse primer.
For further analysis of the novel 436G>A variant, we found that it is a nonsynonymous genetic variant that substitutes valine to the methionine amino acid at position 146 of the NAT2 protein sequence.
shows the alignment of the NAT2 amino acid sequence from different species: human, chimpanzee, Sumatran orangutan, rhesus monkey, Norway rat, house mouse, and rabbit. It is shown that the amino acid valine (V) at amino acid position 146 was conserved among all the NAT2 amino acid sequences, except in the NAT2 protein of monkeys.
The effect of a 436G>A novel genetic variant on NAT2 structure and function was predicted using in silico methods. Mutpred, SIFT, and Polyphen2 software programs were used for in silico prediction of the effect of 436G>A variant on NAT2 protein stability. This study found that Mutpred, SIFT and Polyphen2 software programs predicted that 436G>A was not harmful to NAT2 protein function and structure (). The Mutpred software gave a low score (0.54), SIFT predicted that the effect of the novel variant is tolerated (0.11), and Polyphen2 predicted that the effect of 436G>A is benign (0.04) on NAT2 protein.
Table 7. In silico prediction of the effect of novel NAT2 genetic variant by using Polyphen2, SIFT, and MutPred software programs.
The protein structure of wild-type and mutated (V146M) NAT2 was visualized using VMD software. There were no differences in polypeptide folding and structure between the mutant () and the wild-type NAT2 protein reported in the worldwide protein Data Bank [Citation22].
4. Discussion
Genetic variations in NAT2 gene play a major role in the hepatic acetylation capacity, which may have effects on drug metabolism and susceptibility to certain diseases. In this study, the protein-coding exon of NAT2 gene was completely sequenced among a sample of Arab Jordanian volunteers. To the best of our knowledge, it is the first study in Jordan to have identified the NAT2 haplotype and the LD of NAT2 SNPs. In addition, the present study could identify the novel NAT2 genetic variant (436G>A) among Jordanians with in silico prediction. The findings of this study may increase our understanding of the interindividual and interethnic variations in the acetylation capacity, which may affect drug response, toxicity, and susceptibility to diseases.
The size of the sample was relatively small, and the statistical power of the test (β = 80%) indicated that the sample size of 68 volunteers was sufficient to study the high frequency of NAT2 variants among Caucasian populations. In addition, several studies have investigated the genetic variants among other populations, such as Koreans [Citation27], and have used a sample size of 48, smaller than that in this study. Therefore, the sample size of the current study was statistically sufficient to investigate NAT2 variants among the Jordanian population.
In this study, the NAT2 gene was genotyped by the DNA-sequencing technique. Previous studies on NAT2 gene among Jordanians genotyped major NAT2 genetic polymorphisms using the PCR-RFLP method [Citation11,Citation28]. It has been reported that DNA sequencing is the golden method for genotyping [Citation29], while the PCR-RFLP technique has large errors with a higher probability of false-positive results [Citation30]. Some studies have found that the PCR-RFLP technique is less accurate than other genotyping assays, such as direct DNA sequencing and pyrosequencing [Citation31–Citation33]. These may indicate that the results of NAT2 genotyping obtained from this study were more accurate than the previous reports on NAT2 genotyping among Jordanians.
The NAT2*5 allele is represented mainly by the presence of the 341T>C variant. Many studies have analyzed the 481C>T genetic variant as a representative variant of NAT2*5 allele [Citation11,Citation34]. These studies, based on the 341T>C and 481C>T variants, are in complete LD. The current study found that 341T>C and 481C>T variants were not in complete LD among Jordanian volunteers. Some volunteers were found to carry only the 481C>T but not the 341T>C variant on the NAT2 gene, which indicates that those volunteers were considered genetically as fast acetylators. Therefore, detection of 481C>T variant as a representative SNP of NAT2*5 allele among Jordanians may give a false-slow encoding NAT2 genotype and can overestimate the prevalence of slow acetylator phenotypes among Jordanians [Citation35]. Therefore, genotyping the slow allele NAT2*5 using the 481C>T variant among Jordanian population is not recommended.
In comparison with previous reports on NAT2 allele frequencies in Jordan, the frequencies of 481C>T and 590 G>A were similar to those in the report by Jarrar et al. [Citation11]. However, Jarrar et al. detected the 857A>G variant among Jordanians with a low frequency of 1%. The present study could not find the 857A>G variant among the studied Jordanian sample. This may be due to the larger sample size used by Jarrar et al. [Citation11] (n = 150) than that used in the current study (n = 68).
Jordanians are considered a mixture of different ethnic populations, with a majority of Arabs. The present study collected the blood samples from only Arab volunteers and did not include volunteers from minor ethnic groups, such as Kurds and Circassians. Comparison of NAT2 allele frequencies with other ethnic groups showed that Jordanian NAT2 allele frequencies were in line with those of Europeans and different from the NAT2 allele frequencies in Chinese Asians and Africans. These results are in line with those reported previously [Citation11], in which the NAT2 allele frequencies were similar to those of the European and Middle Eastern populations but different from the Asian and African populations. However, the 191G>A variant, which was reported only among Africans and Middle Eastern Turkish [Citation36] but was absent among European Caucasians, was also found among Jordanian volunteers. Some studies found that Arabs have some genetic variants found in African but not in Caucasian populations [Citation37]. This may indicate a genetic admixture between Caucasian Arabs in the Arabic peninsula and their African neighbors that makes the distribution of genetic polymorphisms among Arabs unique in comparison with other Caucasian populations, such as white Europeans.
The NAT2*5B and NAT2*6A haplotypes were reported to be the most common haplotypes among different Caucasian populations [Citation38]. The present study found that NAT2*5B and NAT2*6A haplotypes were the most common slow haplotypes among Jordanians with frequencies of 29.3% and 23.5%, respectively. However, the frequency of the NAT2*5B haplotype among Jordanians (27%) was significantly lower (×2, p < 0.05) than the NAT2*5B frequency among white Europeans (41.1%) [Citation38].
Depending on the NAT2 haplotype among Jordanians, it was found in this study that 72% of the volunteers had the NAT2 slow acetylation encoding haplotype. This high frequency of NAT2 slow encoding genotype was also reported previously among Jordanians, which could explain the high proportion of slow acetylation phenotype found in Jordanians [Citation39].
The NAT2 191G>A, 341T>C, and 590G>A clinically decrease the metabolism of isoniazid, sulphasalazine, and hydralazine associated with drug toxicity, such as hepatic, neuro-toxicity, and systemic lupus erythmatosus [Citation2,Citation7,Citation8,Citation10]. As Jordanian populations have a high frequency of slow-encoding NAT2 haplotype, the risk of toxicity induced by drugs metabolized by the NAT2 enzyme may be high among Jordanians. Therefore, physicians should consider genotyping NAT2 191G>A, 341T>C, and 590G>A in treatment with drugs metabolized by NAT2.
The present study found and confirmed the presence of the novel NAT2436G>A genetic variant among the volunteers. The frequency of this novel variant was very low (0.7%). The novel 436G>A variant is a nonsynonymous variant that causes a substitution of the valine peptide at position 146, in the amino acid sequence, with methionine. The alignment of the human NAT2 protein sequence with the NAT2 protein of other species showed that V146 is conserved in most of the species, which might indicate that V146 plays a role in the structural stability and function of NAT2. In addition, it is reprted that substitution of Q145, which is close to the novel V146M substitution, changed the formation of hydrogen bonds in the NAT2 enzyme [Citation40]. However, in silico prediction in all the software programs (Polyphen2, Mutpred, and SIFT) used predicted that V146M is tolerable and probably is not harmful to NAT2 protein.
Collectively, these in silico data did not encourage us to proceed further through the functional in vitro and in vivo functional genetic analysis. Although in silico tools predict the probability of a harmful effect in genetic variations in protein function and structure, it is reported that in silico software may show inaccurate prediction in comparison with in vitro and clinical data [Citation41].
5. Conclusions
In conclusion, the present study identified the haplotype and LD of NAT2 genetic polymorphisms and found the novel NAT2 genetic variant 436G>A with in silico prediction among Jordanian volunteers. The findings of this study may increase our understanding of the interindividual and ethnic variation in the acetylation of drugs and toxic compounds.
Disclosure statement
No potential conflict of interest was reported by the authors.
Additional information
Funding
References
- Chen M, Xia B, Chen B, et al. N-acetyltransferase 2 slow acetylator genotype associated with adverse effects of sulfasalazine in the treatment of inflammatory bowel disease. Can J Gastroenterol Hepatol. 2007;21:1–9.
- Yuliwulandari R, Susilowati RW, Wicaksono BD, et al. NAT2 variants are associated with drug-induced liver injury caused by anti-tuberculosis drugs in Indonesian patients with tuberculosis. J Hum Genet. 2016;61:533–537.
- Fuselli S, Gilman R, Chanock S, et al. Analysis of nucleotide diversity of NAT2 coding region reveals homogeneity across Native American populations and high intra-population diversity. Pharmacogenomics J. 2007;7:144–152.
- Shenfield GM. Genetic polymorphisms, drug metabolism and drug concentrations. Clin Biochem Rev. 2004;25:203.
- Garcia-Martin E. Interethnic and intraethnic variability of NAT2 single nucleotide polymorphisms. Curr Drug Metab. 2008;9:487–497.
- Gil J, Lechner M. Increased frequency of wild-type arylamine-N-acetyltransferase allele NAT2* 4 homozygotes in Portuguese patients with colorectal cancer. Carcinogenesis. 1998;19:37–41.
- Gunnarsson I, Kanerud L, Pettersson E, et al. Predisposing factors in sulphasalazine-induced systemic lupus erythematosus. Rheumatology. 1997;36:1089–1094.
- Hein DW, Doll MA, Fretland AJ, et al. Molecular genetics and epidemiology of the NAT1 and NAT2 acetylation polymorphisms. Cancer Epidemiol Biomarkers Prev. 2000;9:29–42.
- Teixeira RLF, Silva FP, Silveira AR, et al. Sequence analysis of NAT2 gene in Brazilians: identification of undescribed single nucleotide polymorphisms and molecular modeling of the N-acetyltransferase 2 protein structure. Mutat Res Fund Mol Mech Mut. 2010;683:43–49.
- Zabost A, Brzezińska S, Kozińska M, et al. Correlation of N-acetyltransferase 2 genotype with isoniazid acetylation in Polish tuberculosis patients. Biomed Res. 2013;853602. DOI:10.1155/2013/853602
- Jarrar Y, Ismail S, Irshaid Y. N-acetyltransferase-2 (NAT2) genotype frequency among Jordanian volunteers. Int J Clin Pharmacol Ther. 2010;48:688–694.
- World Medical Association. World Medical Association Declaration of Helsinki: ethical principles for medical research involving human subjects. JAMA. 2013;310:2191.
- Nurpeisov V, Hurwitz SJ, Sharma PL. Fluorescent dye terminator sequencing methods for quantitative determination of replication fitness of human immunodeficiency virus type 1 containing the codon 74 and 184 mutations in reverse transcriptase. J Clin Microbiol. 2003;41:3306–3311.
- Corpet F. Multiple sequence alignment with hierarchical clustering. Nucleic Acids Res. 1988;16:10881–10890.
- Benson DA, Cavanaugh M, Clark K, et al. GenBank. Nucleic Acids Res. 2013;41(D1):36–42.
- Barrett JC, Fry B, Maller J, et al. Haploview: analysis and visualization of LD and haplotype maps. Bioinformatics. 2005;21:263–265.
- Lee S-J, Kim W-Y, Choi J-Y, et al. Identification of CYP19A1 single-nucleotide polymorphisms and their haplotype distributions in a Korean population. Am J Hum Genet. 2010;55:189–193.
- Lee SS, Jeong H-E, Yi J-M, et al. Identification and functional assessment of BCRP polymorphisms in a Korean population. Drug Metab Dispos. 2007;35:623–632.
- Kumar P, Henikoff S, Ng PC. Predicting the effects of coding non-synonymous variants on protein function using the SIFT algorithm. Nat Protoc. 2009;4:1073–1081.
- Adzhubei IA, Schmidt S, Peshkin L, et al. A method and server for predicting damaging missense mutations. Nat Methods. 2010;7:248–249.
- Humphrey W, Dalke A, Schulten K. VMD: visual molecular dynamics. J Mol Graph Model. 1996;14:33–38.
- Berman HM, Westbrook J, Feng Z, et al. The protein data bank. Nucleic Acids Res. 2000;28:235–242.
- Thorisson GA, Smith AV, Krishnan L, et al. The international HapMap project web site. Genome Res. 2005;15:1592–1593.
- Hamdy SI, Hiratsuka M, Narahara K, et al. Genotype and allele frequencies of TPMT, NAT2, GST, SULT1A1 and MDR‐1 in the Egyptian population. Br J Clin Pharmacol. 2003;55:560–569.
- Bu R, Gutierrez M, Al-Rasheed M, et al. Variable drug metabolism genes in Arab population. Pharmacogenomics J. 2004;4:260–266.
- Iohom G, Fitzgerald D, Cunningham A. Principles of pharmacogenetics—implications for the anaesthetist. Br J Anaesth. 2004;93:440–450.
- Cho S-A, Rohn-Glowacki KJ, Jarrar YB, et al. Analysis of genetic polymorphism and biochemical characterization of a functionally decreased variant in prostacyclin synthase gene (CYP8A1) in humans. Arch Biochem Biophys. 2015;569:10–18.
- Irshaid YM, Abujbara MA, Ajlouni KM, et al. N-acetyltransferase-2 genotypes among Jordanian patients with diabetes mellitus. Int J Clin Pharmacol Ther. 2013;51:593–599.
- Kristensen VN, Kelefiotis D, Kristensen T, et al. High-throughput methods for detection of genetic variation. Biotechniques. 2001;30:318–333.
- Didone A, Nardinelli L, Marchiani M, et al. Comparative study of different methodologies to detect the JAK2 V617F mutation in chronic BCR-ABL1 negative myeloproliferative neoplasms. Pract Lab Med. 2016;4:30–37.
- Tanahashi T, Kita M, Kodama T, et al. Comparison of PCR-restriction fragment length polymorphism analysis and PCR-direct sequencing methods for differentiating Helicobacter pylori ureB gene variants. J Clin Microbiol. 2000;38:165–169.
- Hubáček JA, Pikhart H, Peasey A, et al. Nobody is perfect: comparison of the accuracy of PCR-RFLP and KASP™ method for genotyping. ADH1B and FTO polymorphisms as examples. Folia Biol (Praha). 2015;61:156–160.
- Aquilante CL, Lobmeyer MT, Langaee TY, et al. Comparison of cytochrome P450 2C9 genotyping methods and implications for the clinical laboratory. Pharmacotherapy. 2004;24:720–726.
- Ma MK, Woo MH, Mcleod HL. Genetic basis of drug metabolism. Am J Health Syst Pharm. 2002;59:2061–2069.
- Hein DW, Doll MA. Accuracy of various human NAT2 SNP genotyping panels to infer rapid, intermediate and slow acetylator phenotypes. Pharmacogenomics. 2012;13:31–41.
- Matejcic M, Vogelsang M, Wang Y, et al. NAT1 and NAT2 genetic polymorphisms and environmental exposure as risk factors for oesophageal squamous cell carcinoma: a case-control study. BMC Cancer. 2015;15:150.
- Zihlif M, Imraish A, Irshaid YM. Frequency of certain single-nucleotide polymorphisms and duplication of CYP2D6 in the Jordanian population. Genet Test Mol Biomarkers. 2012;16:1201–1205.
- Gross M, Kruisselbrink T, Anderson K, et al. Distribution and concordance of N-acetyltransferase genotype and phenotype in an American population. Cancer Epidemiol Biomarkers Prev. 1999;8:683–692.
- Irshaid Y, al‐Hadidi H, Abuirjeie M, et al. N‐acetylation phenotyping using dapsone in a Jordanian population. Br J Clin Pharmacol. 1991;32:289–293.
- Rajasekaran M, Abirami S, Chen C. Effects of single nucleotide polymorphisms on human N-acetyltransferase 2 structure and dynamics by molecular dynamics simulation. PLoS One. 2011;6:e25801.
- Jarrar YB, Lee S-J. Molecular functionality of CYP2C9 polymorphisms and their influence on drug therapy. Drug Metabol Drug Interact. 2014;29:211–220.