
ABSTRACT
To develop a machine learning (ML) model for the prediction of the idiopathic macular hole (MH) status at 9 months after vitrectomy and inverted flap internal limiting membrane (ILM) peeling surgery. This single center was conducted at Department A, Institute Hedi Raies of Ophthalmology, Tunis, Tunisia. The study included 114 patients. In total, 120 eyes underwent optical coherence tomography (OCT) and inverted flap ILM peeling for surgery. Then 510 B scan of macular OCT was acquired 9 months after surgery. MH diameter, basal MH diameter (b), nasal and temporal arm lengths and macular hole angle were measured. Indices including hole form factor, MH index, diameter hole index (DHI) and tractional hole, MH area index and MH volume index were calculated. Receiver operating characteristic (ROC) curves and cut‑off values were derived for each indices predicting closure or not of the MH. The area under the receiver operating characteristic curve (AUC) and kappa value were calculated to evaluate performance of the medical decision support system (MDSS) in predicting the MH closure. From the ROC curve analysis, it was derived that MH indices like MH diameter, diameter hole index (DHI), MH index, and hole formation factor were capable of successfully predicting MH closure while basal diameter, DHI and MH area index predicted none closure MH. The MDSS achieved an AUC of 0.984 with a kappa value of 0.934. Based on the preoperative OCT parameters, our ML model achieved remarkable accuracy in predicting MH outcomes after pars plana vitrectomy and inverted flap ILM peeling. Therefore, MDSS may help optimize surgical planning for full thickness macular hole patients in the future.
1. Introduction
Full thickness macular hole (FTMH) is described as a disruption of normal anatomical structure with a full-thickness defect of the foveal retina [Citation1]. It is a serious disease that is responsible for central vision loss. It is a pathology of elderly patients waged under 65 years and affects mostly women [Citation2]. The prevalence of macular hole (MH) ranged from 0.2% to 0.8% [Citation3]. The advent of optical coherence tomography and especially the spectral domain mode (OCT SD) has revolutionized its diagnosis and management. Nowadays, diagnosis is based on OCT SD [Citation4]. Nevertheless, despite surgical improvement over the last decade, the prognosis and surgical outcomes remain uncertain. For that, some investigators start to focus on preoperative OCT to predict MH closure. Ip was the first to analyze preoperative OCT with MH [Citation5]. Since then, many papers have been published defining different measurements and preoperative indices, helping to predict the closure and then anatomical and functional prognosis of the MH [Citation6–8]. Machine learning (ML) is a wide-ranging branch of computer science concerned with building smart machines capable of performing tasks that typically require human intelligence. One approach of the ML is the Medical Decision Support System (MDSS). It is a computer application whose purpose is to provide clinicians with timely information describing a patient’s clinical situation and the knowledge appropriate to that situation, properly filtered and presented to improve the quality of care and health of patients [Citation9,Citation10].
In this paper, we describe the different steps for creation of an automated software to measure and calculate different preoperative tomographic indices and aim to develop an MDSS model of predicting MH closure after vitreoretinal surgery.
2. Methods
This study was carried out under the principles of the Declaration of Helsinki and was approved by the Ethics Committee of the Hedi Raies Institute of Ophthalmology.
2.1. Collecting data
Eyes followed up at 9 months after surgery for MH were retrospectively included in this study. Inclusion criterion was age more than 18 years old. Non-inclusion criteria were eyes with an MH caused by known etiologies such as trauma, macular edema, epiretinal membrane, high myopia, retinal detachment or retinoschisis. Patients with period of follow-up under 9 months and poor quality of tomographic images were excluded from the study. All the eyes received a complete ophthalmologic examinations and SD-OCT scanning (Spectralis; Heidelberg Engineering®, Heidelberg, Germany) before and after surgery.
The training data set, consisting of 450 macular SD-OCT scans from 98 subjects (100 eyes), was used for deriving the best algorithmic and parameter settings by cross-validation. The testing data set, containing another 60 macular SD-OCT scans from 18 subjects (20 eyes) collected, was used for testing the performance on novel images. We used the Spectral Domain Spectralis™ OCT (Heidelberg Engineering®, Heidelberg, Germany) for all our patients. This device has an axial resolution of 5–7 microns, a transverse resolution of 10 microns and an acquisition speed of 40,000 scans per second.
2.2. Proposed method for the creation of a decision support system in OCT
presents the phases of the workflow to extract the parameters of the input OCT image. These phases are explained below:
Figure 1. Different phases of the workflow.
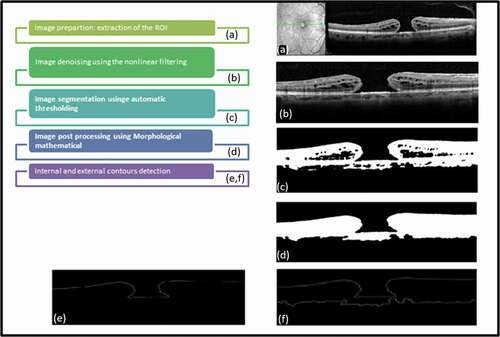
Image preparation: We start by extracting the region of interest by considering only the area around the macular region. To do this, we automatically select the region around the macula to reduce the execution time of the algorithms.
Image denoising using the nonlinear filtering: OCT Images are susceptible to the speckle noise that decrease contrast and their detail structural information, thus imposing significant limitations on the diagnostic of the OCT images, especially the computing of quantitative indices. Various preprocessing techniques for improvement images quality are possible. Here, we use the median filter to reduce the intensity variations within each region of the image while keeping the transitions between the homogeneous regions and preserving the significant elements of the image. The median filter is one of the simplest and most effective nonlinear filters.
Image segmentation using OTSU thresholding: To delineate the external layer, we use an automatic region-based segmentation method. Image segmentation is a key task in computer vision and pattern recognition. The quality of segmentation affects the understanding of images. It is the basis for more computer-aided diagnosis system. It consists of delineating all the .00 objects in an image and then to extract the object of interest from it. Traditionally, image segmentation methods include mainly region-based segmentation and edge-based segmentation methods. In practical applications, many algorithms have important limitations to delineate the regions in medical images, which is due to the weak contrast, and the blurred contours. Generally, the threshold method based on grayscale histogram has good performances on the medical image segmentation, especially the OTSU, which is a global adaptive binarization threshold image segmentation algorithm, initially created by Japanese scholars OTSU in 1979. This algorithm divides the image into two or more regions according to its grayscale characteristics using as the threshold selection rule the maximum interclass variance between the clusters. Obviously, more than the variance between clusters is maximized, more than the probability of misclassification is minimized, thus ensuring good image segmentation.
Image postprocessing using morphological mathematical: To remove holes and small isolated regions, we propose to use mathematical morphology technique that is essentially a nonlinear theory that allows to analyze objects in images according to their shapes, sizes, neighborhoods, textures and sizes. It is based on set theory, trellis theory, closed topology and probability theory. Here we retain the alternating sequential filters (ASF) that have a more symmetrical behavior by an alternating composition of openings and closings operations and then filter both bright and dark structures. ASFs are widely used for achieving a simplification of a scene and for the removal of noisy structures.
External contours detection: To detect the contours of the macular regions, we use derivative methods that are high-pass filters, and they are very efficient on binary images since the contours are well defined. Then, we apply a labeling to retain only the external contours.
2.3. Measurements with MDSS ()
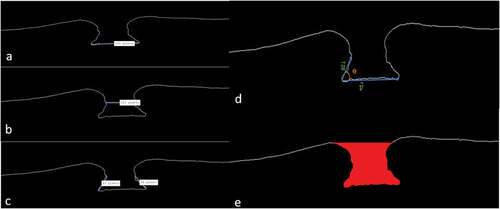
After the image processing, the MDSS proceeds to measure different quantitative parameters. resumes the different measurements, which are the basal diameter, the MH diameter and the right and left arm. From these measurements, the following indices were derived:
Figure 2. Different measurements: (a) basal diameter; (b) macular hole diameter; (c) right and left arm; (d) angle diameter; (e) macular hole volume.
Quantitative parameters:
Hole forming factor (HFF) = (nasal arm length + temporal arm length)/maximum basal diameter.
Macular hole index (MHI) = height/ maximum basal diameter.
Diameter hole index (DHI) = minimum inner hole diameter/maximum basal diameter.
Tractional hole index (THI) = height/minimum inner hole diameter.
Qualitative parameters:
MH angle: First, the angles formed by the intersection of the right or left arm line with the maximum basal diameter are calculated. Two angles are then defined for each hole: a left angle and a right angle. The average of the two angles defines the angle of the macular hole.
MH area index (MHAI) macular area/total area.
Macular hole volume (MHV): Was described as a space under the imaginary line defined by the minimum extent of the hole. Since this space is a truncated cone, MHV was calculated with the following formula for a truncated cone: MHV = π/3 h(r2+ Rr + R2) (r is half the minimum diameter, R is the basal diameter and h is the height of the hole).
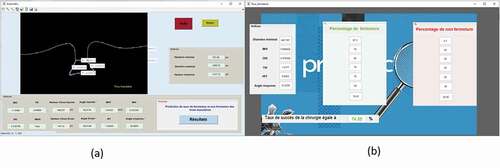
2.3.1. Graphical interface ()
To facilitate the handling of our algorithm developed in this work and to be able to compare the results obtained, we have developed a simple and accessible graphical interface ().
Figure 3. Medical decision support system (MDSS) interface.
2.4. Statistical analysis
Data collected were analyzed with IBM SPSS 20.0 for Windows. Demographic data, pre‑ and postoperative visual acuities and MH indices were analyzed using the Mann–Whitney U test; comparing two groups closure/no closure of the MH. For categorical variables, difference between the two groups were analyzed using the chi‑square test. A receiver operating characteristic (ROC) curve analysis was carried out to evaluate the predictive ability of the different MHindices for the two groups. The areas under the ROC curve (AUC) were calculated to judge the efficiency of each indices on comparison with the different model of closures. The cutoff values from the ROC curve were obtained for highest possible sensitivity and specificity for the different indices.
The performance of the MDSS was assessed by comparing the results obtained from the software and the clinician using the kappa value and the AUC value of the ROC curve.
3. Results
3.1. Demographic data
The mean age of our population was 65.97 ± 4.7 years old with feminine predominance (68%). The symptoms duration was 7 ± 2.04 months. The mean preoperative BCVA was 1.6 log mar.
Surgical outcomes: Final anatomical and visual outcomes were assessed at 9 months after the primary MH surgery. MH closure was achieved in 84 eyes. The remainder eyes showed a none closure of the MH. Mean postoperative visual acuity was 0.52 log mar.
3.2. Tomographic data
The mean basal diameter was 1436.06 ± 200.246 µm; the mean diameter was 692.59 ± 147.207 µm; the mean MH height was 1216.43 ± 306.77 μm; the mean nasal arm length was 955.5 ± 360.5 μ; the mean temporal arm length was 917.4 ± 330.2 μ; and the mean MH angle was 65.66 ± 6.6°. The mean MH area was 1. 029 mm2. The derived MH indices are summarized in .
Table 1. Different preoperative tomographic indices
3.3. Prediction system
To decide closure/not closure of the MH, the MDSS is referred to the ROC curve analysis for each indices (). From the ROC curve analysis, it was derived that MH indices like MH diameter, DHI, MHI, and HFF were capable of successfully predicting MH closure while basal diameter, DHI and MHAI predicted none closure MH.
Table 2. Receiver operating curve analysis using the different macular hole indices
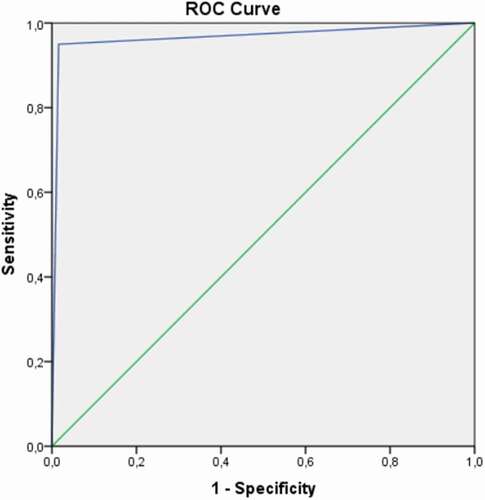
3.4. MDSS performance
For the validation of the MDSS, we compared its performance with the results obtained by an expert. The ROC curve identifying the performance of the MDSS is shown in ; the AUC of the MDSS performance was 0.967 (95% CI; 0.941–0.993).
Figure 4. ROC curve for medical decision support system (MDSS) to predict the macular hole closure.
4. Discussion
This study was undertaken to develop an MDSS model of predicting MH closure after vitreoretinal surgery. For this, we measured the different macular diameter, height and angle. Different indices were extracted from quantitative parameters to predict the closure of idiopathic MH after surgery.
The measurement and the final decision were automated and an MDSS was created to predict the prognosis of MH before surgery and help surgeons as well as patients to make the decision.
Our study was, to our knowledge, done after a large reviewing of the literature, the first study using ML as a scientific tool to predict preoperatively the anatomic prognosis of the MH.
As is known, the development of FTMH is leading by anterior and tangential vitreoretinal traction of the fovea. Vitrectomy and internal limiting membrane peeling is the common surgical procedure with up to 99% anatomical success [Citation11–13]. Nerveless, the MH remains open in same cases and a second surgery is often needed, with more medical cost and less effective results. An automated predictive system for MH prognosis after surgery will help to decide the surgical indication and technique and reduce the patient’s preoperative anxiety.
Artificial intelligence (AI) is nowadays a turnover in image classification. Proving its expert performance in image interpretation has allowed a large spread in medicine [Citation14,Citation15]. On ophthalmology, it plays an important role in preventive medicine and telemedicine, especially in diabetes and diabetic retinopathy. AI and fundus images are becoming more and more a common practice. The involvement of AI in the interpretation of OCT is still limited. It is widely used in age-related macular degeneration and macular edema. The involvement of AI in MH and VMTS in general remains very limited if not nonexistent [Citation16]. In fact, OCT, one of the most commonly used technologies in ophthalmology, is a method used for high-resolution retinal imaging, providing excellent training material for AI. De Fauw et al. [Citation17], Lu et al. [Citation16] and Lee et al. [Citation16] used AI models based on OCT images and have demonstrated excellent performance in diagnosing retinal diseases, including diabetic retinopathy, macular oedema, retinal detachment and choroidal neovascularization in age-related macular degeneration.
The advent and technological advances in SD OCT and MHs have made it possible to establish, nowadays, objective and exact predictive factors of the probability of closure MH visual acuity gain. The first study to use OCT to analyze MHs preoperatively was published by Ip et al. in 2002 [Citation5]. Since then, various studies have been published describing the role of MH measurements and derived indices such as HFF, MHI, DHI and THI in the preoperative prediction of anatomical closure and visual gain after MH repair surgery [Citation6,Citation18,Citation19].
In a recent analytical study, published in 2020 by Ramesh Venkatesh et al. [Citation20], a significant correlation between the different tomographic indices and their predictive character in the anatomical success of wide MH surgery was sought. The ROC curves for each tomographic index (HHF, MHI, THI) as well as the macular area index (MAI) were studied and correlated with the surgical success rate. They concluded that MAI, calculated using the ROC curve and the basal diameter of the MH, could be considered the only index statistically predictive of closure of large idiopathic MHs. In fact, an MAI value < 0.323 could predict successful closure with a sensitivity of 85% and a specificity of 83% (ROC curve) [Citation20].
In the same sense, Liu et al. [Citation21], in a prospective study, tried to define another tomographic index predictive of both closure rate and recovery of the IS/OS line: the MH closure index (MHCI). They tried to investigate the predictive value of this index by applying the ROC curve. Indeed, the MHCI includes the basal diameter of the MH, the retinal thickness on both sides, as well as the curve lengths of the detached photoreceptors. Through the analysis of the ROC curves and the ROC/MHCI correlations, they found that the AUC indicates that the MHCI could be used as an effective predictor of the anatomical results. Indeed, cutoff values of 0.7 and 1.0 were obtained for the MHCI from the ROC curve analysis. Thus, MHCI demonstrated a better predictive effect than other parameters in both correlation and ROC analysis [Citation21,Citation22].
5. Conclusion
In our study, we were interested in creating a software to predict the prognosis of MH after surgery through the measurement of preoperative tomographic parameters. The MDSS, considered as one of the ML approaches, was the basis of our working methodology. Our results can be the support of a large database of MH and OCT and a novel deep learning-based system that can implement automated measurement of preoperative tomographic indices from OCT images with robust performance.
Disclosure statement
No potential conflict of interest was reported by the author(s).
Additional information
Funding
References
- Bikbova G, Oshitari T, Baba T, et al. Pathogenesis and management of macular hole: review of current advances.J Ophthalmol. 2019 May;2(2019):3467381.
- Kelly NE. Vitreous surgery for idiopathic macular holes. Results of a pilot study. Arch Ophthalmol. 1991;109(5):654–6.
- Zhang P, Zhou M, Wu Y, et al. Choroidal thickness in unilateral idiopathic macular hole: a cross-sectional study and meta-analysis. Retina. 2017;37(1):60–69.
- Duker JS, Kaiser PK, Binder S, et al. The international vitreomacular traction study group classification of vitreomacular adhesion, traction, and macular hole. Ophthalmology. 2013;120(12):2611‑9.
- Ip MS. Anatomical outcomes of surgery for idiopathic macular hole as determined by optical coherence tomography. Arch Ophthalmol. 2002;120(1):29‑35.
- Ruiz-Moreno JM, Staicu C, Piñero DP, et al. Optical coherence tomography predictive factors for macular hole surgery outcome. Br J Ophthalmol. 2008;92(5):640‑4.
- Wakely L, Rahman R, Stephenson J. A comparison of several methods of macular hole measurement using optical coherence tomography, and their value in predicting anatomical and visual outcomes. Br J Ophthalmol. 2012;96(7):1003‑7.
- Chhablani J, Khodani M, Hussein A, et al. Role of macular hole angle in macular hole closure. Br J Ophthalmol. 2015;99(12):1634‑8.
- Aboudi N, Guetari R, Khlifa N. Multi-objectives optimisation of features selection for the classification of thyroid nodules in ultrasound images. IET Image Process. 2020;14(9):1901.
- Khachnaoui H, Guetari R, Khlifa N. A review on deep learning in thyroid ultrasound computer-assisted diagnosis systems. 2018 IEEE International Conference on Image Processing, Applications and Systems (IPAS), 291–297.
- Michalewska Z, Michalewski J, Adelman RA, et al. Inverted internal limiting membrane flap technique for large macular holes. Ophthalmology. 2010;117:2018–2025.
- Abbey AM, Van Laere L, Shah AR, et al. Recurrent macular holes in the era of small-gauge vitrectomy: a review of incidence, risk factors, and outcomes. Retina. 2017;37:921–924.
- Morizane Y, Shiraga F, Kimura S, et al. Autologous transplantation of the internal limiting membrane for refractory macular holes. Am J Ophthalmol. 2014;157(861–9.e1).
- Lu W, Tong Y, Yue Y, et al. deep learning-based automated classification of multi-categorical abnormalities from optical coherence tomography images. Transl Vis Sci Technol. 2018 Dec 28;7(6):41.
- Lee CS, Baughman DM, Lee AY. Deep learning is effective for the classification of OCT images of normal versus age-related macular degeneration. Ophthalmol Retina. 2017;1:322–327.
- Ting DSW, Peng L, Varadarajan AV, et al. Deep learning in ophthalmology: the technical and clinical considerations. Prog Retin Eye Res. 2019;72:100759.
- De Fauw J, Ledsam JR, Romera-Paredes B, et al. Clinically applicable deep learning for diagnosis and referral in retinal disease. Nat Med. 2018;24:1342–1350.
- Kusuhara S, Teraoka Escano MF, Fujii S, et al. Prediction of postoperative visual outcome based on hole configuration by optical coherence tomography in eyes with idiopathic macular holes. Am J Ophthalmol. 2004;138:709‑16.
- Ullrich S. Macular hole size as a prognostic factor in macular hole surgery. Br J Ophthalmol. 2002;86(4):390‑3.
- Venkatesh R, Mohan A, Sinha S, et al. Newer indices for predicting macular hole closure in idiopathic macular holes: a retrospective, comparative study. Indian J Ophthalmol. 2019 Nov;67(11):1857–1862.
- Liu P, Sun Y, Dong C, et al. A new method to predict anatomical outcome after idiopathic macular hole surgery. Graefes Arch Clin Exp Ophthalmol. 2016 Apr;254(4):683–688.
- Schmidt-Erfurth U, Sadeghipour A, Gerendas BS, et al. Artificial intelligence in retina. Prog Retin Eye Res. 2018;67:1–29.