
ABSTRACT
In spite of much progress in the development of gasoline direct injection (GDI) engines, choosing an appropriate piston top contour to obtain desirable combustion efficiency is still an arduous process for engineers. This study investigates the combined effects of piston bowl geometry and a charge motion control valve (CMCV) on tumble flow and combustion features in GDI engines. Based on the model validation, the processes of intake, spray, mixture formation and combustion at different engine speeds are simulated and analyzed for different piston shapes for the two cases of opening and closing the CMCV. The results show that the bowl on the top of piston is beneficial for the formation and development of tumble flow. The flat top piston with the CMCV closed is able to achieve acceptable combustion pressure. However, with the increase of engine speed and load, the advantages of the flat top pistons gradually disappear; the dual offset bowl piston has a minimum tumble ratio and turbulence kinetic energy (TKE) at the end of the compression stroke because of the projection in the middle of the piston top surface which leads to a lower pressure rise rate and a reduced flame propagation speed at high load. The closed CMCV contributes to a faster evaporation rate and a more uniform mixture at lower speeds. It is not recommended for use at high speeds due to lower intake air mass and reduced combustion pressure. The research provides an effective way for engineers to choose an appropriate piston top contour combined with a CMCV to obtain desirable combustion efficiency.
Nomenclature
| BTDC | = | Before top-dead center |
| CAD | = | Crank angle degree |
| CFD | = | Computational fluid dynamics |
| CMCV | = | Charge motion control valve |
| ECFM | = | Extended coherent flame model |
| EGR | = | Exhaust gas recirculation |
| EVO | = | Exhaust valve opening |
| FSI | = | Fuel stratified injection |
| GDI | = | Gasoline direct injection |
| IVC | = | Intake valve closing |
| IVO | = | Intake valve opening |
| LDA | = | Laser Doppler anemometry |
| LDV | = | Laser Doppler velocimetry |
| PIV | = | Particle image velocimetry |
| SOI | = | Start of injection |
| TKE | = | Turbulence kinetic energy |
1. Introduction
Over the last decade, significant progress has been made in the development of gasoline direct injection (GDI) engines, especially in combination with stratified-charge, downsizing and turbocharging due to their noteworthy potential to increase the efficiency of automotive applications while improving performance (Alkidas, Citation2007; Zhao, Harrington, & Lai, Citation2002; Zhao, Lai, & Harrington, Citation1999). In GDI engines with a variable intake system, a highly transient flow is accompanied by various states of the charge motion control valve (CMCV), which make it one of the most complex parts used in combustion chamber design. Therefore, proper understanding of the effect of the piston shape on the tumble movement and thus how it affects the combustion process is required in order to reduce exhaust emissions and maintain outstanding performance.
Tumble is a large-scale rotating flow developed during the late intake process with its rotation axis perpendicular to the cylinder axis (Baby & Floch, Citation1997). Tumble flow is more easily generated in the pent-roof combustion chamber of modern spark ignition engines. Generating tumble and turbulence by placing a CMCV to control the air flow into the cylinder is a common practice in modern GDI engines (Bari & Saad, Citation2013; Y. He, Selamet, Reese, Vick, & Amer, Citation2007; Kidokoro et al., Citation2003; Scaringe & Cheng, Citation2007). The CMCV is usually placed in the intake manifold; during the intake stroke, the set of vanes guide the intake air before it is drawn into the cylinder. The CMCV produces a directed high-speed flow into the cylinder from the upper part of the intake port and greatly enhances the in-cylinder tumble intensity. The organized tumble charge motion promotes the evaporation of the droplets and consequently breaks up into small-scale turbulence during the compression stroke. This turbulence can increase the burning rate during the flame propagation process and lower the cycle-to-cycle combustion variations (Scaringe & Cheng, Citation2007). The traditional role of the CMCV is to improve the low-speed burning rate, which provides better combustion stability and extends the lean burn range of exhaust gas recirculation (EGR; Kidokoro et al., Citation2003). Under cold start conditions, the CMCV is also helpful due to significantly delaying the ignition timing in order to increase the exhaust temperature, which leads to a rapid catalyst light-off (Kishi, Kikuchi, Suzuki, & Hayashi, Citation1999; Nishizawa, Momoshima, Koga, & Tsuchida, Citation2000). More attention has been paid to tumble in recent years and extensive work has been carried out to understand the in-cylinder tumbling flow structure development process and its influencing factors in internal combustion engines (Adomeit, Jakob, Pischinger, Brunn, & Ewald, Citation2011; Han, Qin, Lin, Li, & Zhang, Citation2014; C. M. He & Xu, Citation2014; Zhang, Zhang, Wang, & Jia, Citation2014).
Variation in the shape of the piston top surface is known to result in different engine performance (Raj, Raj, Mallikarjuna, & Ganesan, Citation2013). On the one hand, the piston configuration plays a crucial role in the flow-field distribution in the cylinder. On the other hand, the spray formation is largely guided by the shape of the piston top surface. Numerical simulations and research experiments have been applied to probe into the effects of the piston top contour on the flow structure and combustion features of GDI engines (Harshavardhan & Mallikarjuna, Citation2015a; Raj et al., Citation2013). Faure et al. (Citation1998) carried out research on the in-cylinder tumbling flow structure in a motored GDI engine using the techniques of particle image velocimetry (PIV) and laser Doppler anemometry (LDA). The results showed that the tumble flow motion strongly depends on the shape of the piston bowl and the cylinder head design, and the tumble motion is maintained until the end of the compression stroke, which is helpful in carrying the charge to the spark plug in late injection mode. Baby & Floch (Citation1997) used laser Doppler velocimetry (LDV) to study the effect of different bowl shapes on turbulence, cycle-by-cycle flow variations and tumble distortion. Studies have shown that the angular momentum levels are much lower for the curved piston shapes compared with the flat ones. The results also indicate that for the piston with a bowl located under the exhaust valves, the tumble motion is better preserved at the end of compression. Raj et al. (Citation2013) applied experimental and theoretical methods viz. PIV and computational fluid dynamics (CFD) to study the in-cylinder air motion in a diesel engine and reported that a center bowl on a flat piston is found to be the best combination of tumble ratio and energy efficiency. Vaz, Amorim, Ribeiro, Huebner, and Valle (Citation2014) investigated the impact of the piston shape on the tumble coefficient and squish by simulating the air flow inside a single-cylinder research engine. They found that a flat piston maintains the tumble through the cycle until the compression phase because of the absence of barriers. The salience in the piston crown under the intake or the exhaust valves influences the eddy and the turbulent energy distribution at the end of the compression stroke. A CFD analysis was carried out by Harshavardhan and Mallikarjuna (Citation2015b) to analyze the in-cylinder air flows and air–fuel interaction created by different piston shapes. It was found that a flat piston with a center bowl results in a higher tumble ratio, greater turbulence kinetic energy (TKE), a better mixture stratification and a higher evaporation rate as compared to the performance of a flat piston with no center bowl. X. Y. Wang, Zhao, Xie, and He (Citation2014) used 3D CFD simulations to study the effect of piston bowl shapes and direct injection strategies on the in-cylinder conditions. They found that the shallow bowl piston shape could improve the local velocities and TKE around the spark plugs compared with a deep piston bowl, and that the evaporation ratios of the bowl piston are comparable with those of the original flat piston. The effect of four piston shapes on GDI engine performance under catalyst heating mode was investigated by Zheng, Liu, Tian, and Zhang (Citation2015) using simulation methods. The numerical results indicate that a piston with a flat top surface and pit is beneficial for improving the in-cylinder turbulence intensity, and helps to form a combustible mixture around the spark plug. A piston with a smoother top surface results in higher TKE at the time of ignition, and is thus beneficial to accelerate combustion.
It is worth noting that the combined effects of piston bowl geometry and the CMCV on tumble in GDI spark ignition engines is not yet well understood. This paper focuses on the simulation of GDI engine performance at different speeds under high-load conditions. The research on the interaction of the tumble and the piston top shape was carried out using a 3D CFD software package. The processes of intake, spray, mixture formation and combustion were simulated and analyzed using different piston designs under the two conditions of the CMCV being open and being closed. Some important data in the cylinder such as the tumble intensity and the TKE during the intake process were recorded and the effects on fuel distribution and combustion of varying the tumble flow and piston design were evaluated.
2. Engine with variable tumble intake system
A four-cylinder spark ignition engine was used in this study, operated with a geometric compression ratio of 9.6:1, with an 86 mm bore and 86 mm stroke. The engine had a pent-roof head and a side-mounted six-hole high-pressure fuel injector, and the orifice diameter is 0.167 mm. The extended-electrode spark plug was located in the center of the combustion chamber. During the test, the quantity of injection fuel was set to 34.8 mg/cycle at the speed of 1500 r/min, and 62.4 mg/cycle at the speed of 2000 r/min. The injection times were defined as −300 crank angle degrees (CAD) and 300 CAD before top-dead center (BTDC) at two speeds (the intake TDC is defined as −360 CAD and the compression TDC is 0 CAD). No EGR rate was adopted, and the total fuel-to-air equivalence ratio was 0.9–1.02 with different piston designs under the two conditions when the CMCV was either open or closed. The detailed specifications and conditions are presented in Table . The engine was equipped with a dustpan-shaped CMCV which was employed to generate various levels of tumble ratio (Figure ). The CMCV was installed at the end of intake manifold and controlled by an integrated vacuum device. The flat tumble plate was mounted in the cylinder head in front of the intake valves. When the CMCV was closed (Figure (b)), the cross-section was reduced and the tumble intensity increased. When the CMCV was open (Figure (c)), the inlet flow area was enlarged, improving the air mass flux in the intake ports. In order to understand the effect of piston bowl geometry on the in-cylinder air flow, four piston configurations were selected for CFD analysis. The detailed geometry of the four piston bowls selected – a bowl piston (A), a flat piston (B), a flat piston with a center bowl (C) and a piston with dual offset bowls (D) – are shown in Figure . For Piston A, the large shallow bowl facilitates the smooth airflow skim on the piston top surface, Piston B has a flat top surface, Piston C features a shallow bowl smaller than the bowl of Piston A in the center of a flat top surface, Piston D has dual offset bowls on its top surface. The four types of piston top surface are chosen based on practical applications. Piston D has been used in a Volkswagen fuel stratified injection (FSI) engine and was later improved to Pistons A and C (Audi Citation2.Citation0 T FSI engine, Citation2004).
Figure 1. Tumble control schematic diagram of the variable tumble intake port.
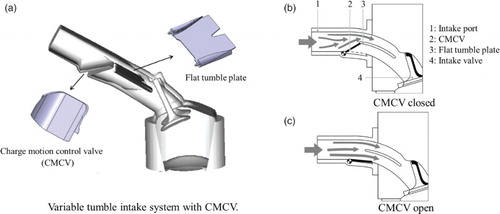
Figure 2. The four piston shapes used in this study: Bowl (Piston A), Flat (Piston B), Flat with bowl in center (Piston C), and Dual offset bowls (Piston D).
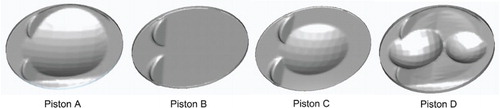
Table 1. GDI engine specifications and conditions.
3. Numerical models
3.1. Engine models
The multi-dimensional simulations were carried out using the FIRE CFD code during the process of intake valve opening (IVO) to exhaust valve opening (EVO). The intake valve was open at −360 CAD and closed at −170 CAD. The research was performed with the assumptions that there is a stable condition and that the temperature of the piston head and cylinder wall are constant.
For the study on the grid independence, Figure shows the comparison of the cylinder pressure curve simulation results by using different numbers of cells. It can be seen that there are no significant differences on the pressure curve using the three meshes with 269,901 cells, 396,844 cells and 583,880 cells. Thus, the intermediate mesh with 396,844 computational cells at the intake bottom dead center (BDC) was used because of its relatively high accuracy level and relatively low computational time. The cell size for the computational mesh is shown in Table . The minimum mesh size of the CMCV is 0.25 mm due to the complicated structure. The total number of grid and time steps in the calculation process are shown in Figure . The grid number when the CMCV is closed is slightly greater than that when the CMCV is open, and the section of intake port is not included after the closing of intake valves. The time step varies during the calculation process, and a smaller step with 0.1 to 0.5 CAD was used for the spray and combustion procedure. The computational mesh of the CFD model is shown in Figure . The temperature applied to the intake port wall was 330 K, and the temperature applied to the chamber, piston and liner surface was 450 K. The pressure applied to the intake port was set as a constant (Table ).
Figure 3. Cylinder pressure curve simulation results for different numbers of cells.
Figure 4. Total number of grids and time steps in the calculation process.
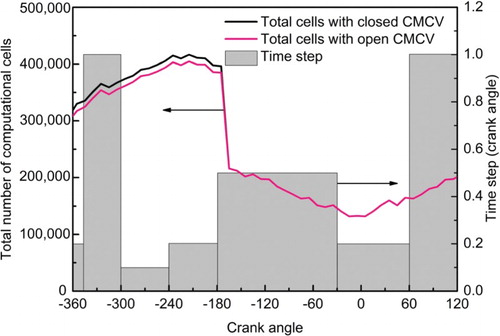
Figure 5. Computational mesh of GDI engine with CMCV at BDC (for Piston C): (a) intake port mesh with CMCV and (b) computational mesh and cut plane.
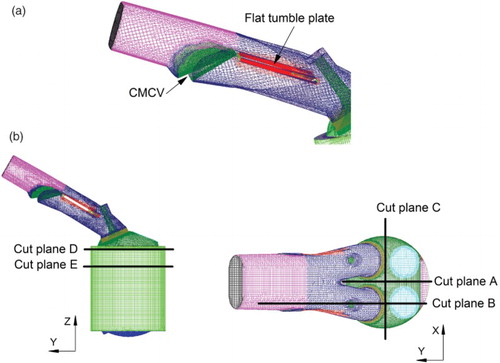
Table 2. The cell size for the computational mesh for different pistons.
An appropriate turbulence model is critical for certain problems in order to obtain physically plausible simulation results. F. Wang, Reitz, Pera, Wang, and Wang (Citation2013) compared the velocity field calculated by the k- turbulence model with experimental data from PIV measurements. The mean radial velocities along a horizontal line at the BDC obtained by the turbulence model matched the experimental data well. However, the k-
turbulence model gave slightly higher predictions for the mean vertical velocity. The in-cylinder flows and turbulence effects were calculated by using the four-equation turbulence model, the k-
-f model, which has recently been developed by Hanjalic, Popovac, and Hadziabdic (Citation2004). The authors propose a version of an eddy viscosity model based on Durbin’s elliptic relaxation concept. The aim is to improve the numerical stability of the model by solving a transport equation for the velocity scale ratio
instead of the velocity scale
.
The liquid droplet break-up is predicted by using the wave model (Liu & Reitz, Citation1993). The spray-collision model proposed by O’Rourke (Citation1989) was added into the FIRE code, and the spray–wall interaction model developed by Senda and Kobayashi (Citation1994) was used. The droplet heat-up and evaporation process was simulated using the model developed by Dukowicz (Citation1980). In this study, the extended coherent flame model (ECFM) was chosen as the combustion model (ICE Physics & Chemistry, Citation2010), in which the flame initialization time is calculated from the function of the chemical time and the mass fractions of the reactive gases. The ECFM model is fully coupled to the spray model and is suitable for stratified combustion modeling, including nitrogen oxides (NO) formation and EGR effects. The stretch factor of the ECFM model was set to 1.6. An increase in the stretch factor leads to an intensification of the production of the flame surface density and hence a shorter and faster combustion phase. The spherical ignition model is used in this paper. In this model, a spherical flame kernel is released at the spark position. The flame kernel radius and spark duration are set to 3 mm and 0.0003 s according to the values recommended by FIRE. The flame surface density was kept constant in all ignition cells within the flame kernel radius over the spark duration. This value influences the ignition delay and was set to 250 1/s according to the experimental data.
3.2. Model validation
Validation of the turbulence model was conducted using an optical variable tumble intake port steady flow rig. A PIV system was used to study the change of the in-cylinder airflow. The flow-field distribution features on the axis plane (cut plane A) of the cylinder were analyzed because of the fact that the in-cylinder fluid structure is mainly a tumble motion. The simulation conditions are consistent with the experimental setup, which is illustrated in detail in Fan, Zhang, Yin, and Zheng (Citation2013). The overview over the computational domain is shown in Figure (a). A total pressure boundary condition of PA = 1.0 bar is adopted at the inlet. The valve lift is 6 mm with the CMCV closed. In order to avoid an impact of the outlet boundary on the flow upstream, the pressure boundary condition with a static pressure of PB = 0.98 bar was applied downstream of the outlet. The distance between the outlet region and the cylinder head was 3 BE, where BE is the bore diameter. Figure (b) to 6(d) shows the comparison of ensemble-averaged images in a vertical cross-section for the PIV experiment and the simulation result for different turbulence models. The ensemble-averaged PIV field was obtained using 250 images as the best compromise between data storage space and a satisfactory convergence (Pera & Angelberger, Citation2011).
Figure 6. Ensemble-averaged PIV images and the simulation results (with the CMCV closed at cut plane A) for (a) the computational domain, (b) PIV images, (c) k- results and (d) k-
-f results.
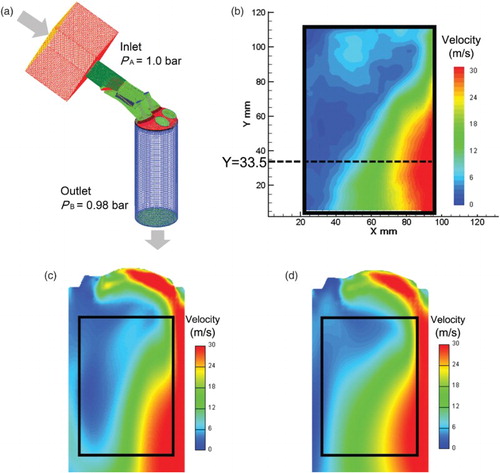
It can be seen that the velocity is comparatively larger at the left side of the cylinder for the k- model. The correlation coefficient was introduced to complement the validation of the turbulence model at different points within the test plane. The correlation coefficient of the PIV data with the k-
-f result is 0.983, and the correlation coefficient of the PIV with k-
is 0.959. This shows that the k-
-f result has a better fit with the PIV experimental values. The correlation coefficient is defined as
(1)
where, x and y are the speed values of the corresponding points from the PIV and Reynolds-averaged Navier–Stokes (RANS) results, and
and
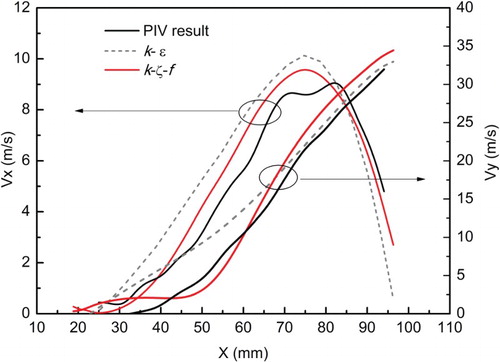
are the average values of the two arrays. The velocity components in different directions are compared for the PIV and RANS results in the middle of the cylinder (Figure ). The vertical direction velocity component (Vz) of the k-
model is in good agreement with the PIV in the right-hand side of the cylinder. However, for the k-
model, the velocity component is relatively large in the Y and Z directions in the left-hand side of the cylinder. The velocity value of the k-
-f model is closer to the PIV result.
Figure 7. Velocity component for the PIV results and different simulation models (Z = 33.5).
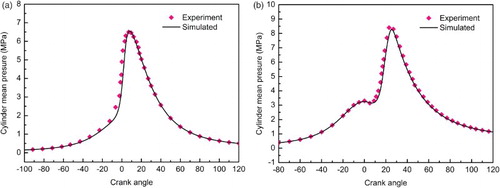
The spray model was verified via a constant volume vessel of 150 mm diameter and 150 mm height, which allowed the full development of the spray process. The simulation conditions are consistent with previously published tests (Cheng, Zhang, Xie, & Zhu, Citation2014). The injection pressure is 10 MPa, the ambient pressure in the constant volume vessel is 0.1 MPa, the ambient air temperature is 293 K and the fuel injection pulse width is 3 ms. The high-speed photographs and graphics in Figure compare the simulated liquid fuel spray structures and penetrations with the experiment results. The color scale represents the speed of the spray droplets. The accuracy of the boundary conditions has a significant impact on the simulated results, including the mass flow, temperature and physical properties of the fuel. These factors could cause consistency variation between the experimental and calculated results. The calculated spray structures and the experimental result have an acceptable similarity, and the spray penetrations correspond well with those obtained from the experiments, which confirm the validity of the spray model. Validation of the combustion model was conducted on a GDI engine at 1500 r/min and 2000 r/min. The experimental and numerical cases were carried out with Piston C (Figure (c)). The operation conditions are presented in Table and the CMCV remained closed (Figure (b)). Figure shows a comparison of the simulated cylinder pressure curves with those of the experiment results. It can be seen that the simulated cylinder pressure curves are in good agreement with the experimental results at two speeds, which is a necessary precondition for GDI engine development and optimization.
Figure 8. Spray experiment measurements and simulations (injection pressure = 10 MPa) for: (a) comparison of spray formal and (b) comparison of spray penetration.
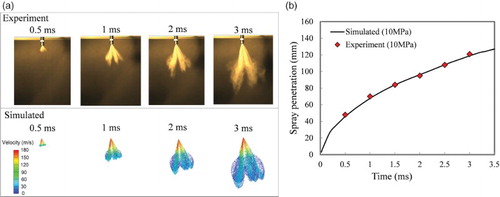
Figure 9. Experimental and simulated cylinder pressure curves at: (a) 1500 r/min and (b) 2000 r/min.
4. Results and discussion
4.1. Effect of the piston shape on the tumble and TKE values
For a quantitative comparison of the tumble flow for different piston designs, the tumble angular velocity (Mattarelli, Borghi, Balestrazzi, & Fontanesi, Citation2004) and the tumble ratio
(J. N. Kim, Kim, Yoon, & Sa, Citation2008) are used as the measure of the tumble intensities under different operating conditions. The tumble angular velocity is defined as
(2)
where n is the number of cells in the calculation area, mi is the mass within each cell, x0 and y0 are the cylinder axis coordinates, xi, yi, and zi are the Cartesian coordinates of the local cell centroid, and ui, vi and wi are the speed of each individual grid cell scalar. In order to express the tumble angular velocity conveniently at different speeds, the tumble ratio is defined as the ratio between the tumble angular velocity and the engine angular velocity:
(3)
where NTx is the tumble ratio rotating around the x-axis and N is the engine angular velocity. The average TKE is given by
(4)
where uix, uiy and uiz are the fluctuating velocity components in the x, y and z directions, respectively.
Figure compares the tumble ratio for various piston shapes when the CMCV is open and closed. The rise in the tumble ratio during the early part of the intake process is followed by a significant decline. During the latter part of the compression process, the tumble ratio increases to another peak as the piston rises. The tumble intensity significantly increases when the CMCV is closed. The tumble intensity decreases after start of injection (SOI), which is more evident when the CMCV is open (Figure (a)). The main reason for this is that the further enhancement of tumble intensity is hindered due to the contact of fuel injection with the tumble flow. At speeds of 2000 r/min and 5500 r/min (Figure (b) and 10(c)), the tumble ratio still rises for a certain level after SOI, which indicates that the impact of the fuel injection on the tumble flow decreases. The main reason is that the same tumble ratio in the high-speed condition corresponds to a greater tumble intensity, and tumble plays a dominant role in its interaction with the fuel injection.
Figure 10. Tumble ratio for the four piston designs with both CMCV states at (a) 1500 r/min, (b) 2000 r/min and (c) 5500 r/min.
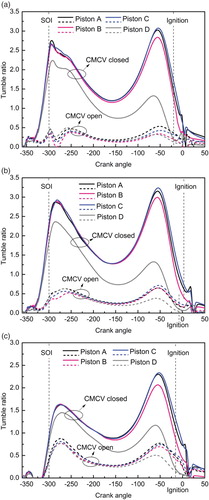
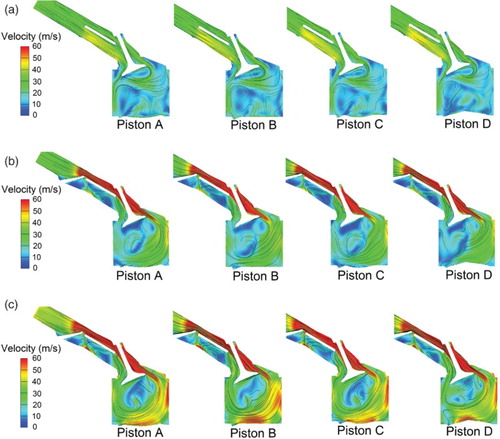
Figure compares the maximum tumble ratio in the compression stroke for various piston shapes. It can be seen that the tumble intensity in-cylinder is greatly enhanced when the CMCV is closed, being in the order of 3–6 times the ratio when the CMCV is open. The maximum tumble ratios of Pistons A and C are slightly higher than that of Piston B when the CMCV is closed, indicating that having a pit in the piston is helpful for increasing the strength of the tumble flow. Compared with Piston A, Piston C has the highest tumble ratio, which means that the flat piston with a shallow center bowl generates the maximum tumble strength. When the CMCV is open, the maximum tumble ratio decreases significantly, and Pistons A and C still show a greater tumble ratio because of the bowl on the piston top. The tumble ratio of Piston D is the minimum, which is only half of that of the other designs when the CMCV is closed. Figure shows the in-cylinder velocity vector plots with different pistons at −265 CAD (35 CAD after SOI). It can be seen that the intake air flows in from the upper side of the baffle when the CMCV is closed, forming a clockwise tumble in the cylinder that contributes to the increase of the tumble intensity. The bowl on the piston top plays a guiding role for the air movement, which is beneficial for the formation and development of the clockwise tumble. The design of Piston D is not conducive to the development of tumble because of the projection in the middle of the piston top surface, which is the reason that the piston with dual offset bowls has the minimum tumble ratio.
Figure 11. Maximum tumble ratio in the compression stroke for the four piston designs.
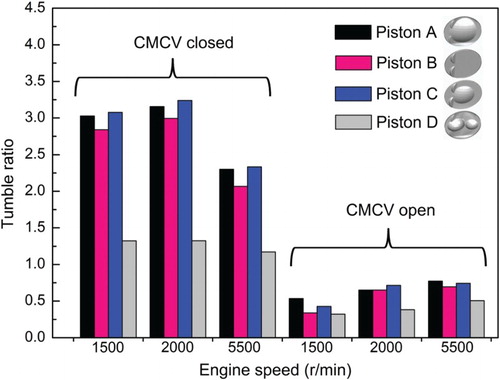
Figure 12. In-cylinder velocity vector plots for the four piston designs (−265 CAD at cut plane B) at: (a) 1500 r/min with the CMCV open, (b) 1500 r/min with the CMCV closed and (c) 2000 r/min with the CMCV closed.
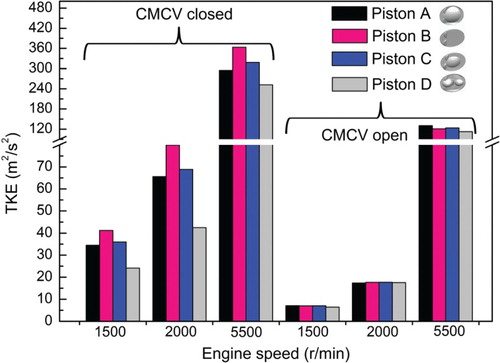
TKE is defined as the average kinetic energy per unit mass associated with eddies in turbulent flow (White, Citation2011). Higher in-cylinder TKE would effectively break up larger fuel droplets and mix with air to provide improved combustion with less carbon deposits inside the cylinder (Bari & Saad, Citation2013). K. Kim, Chung, Lee, and Lee (Citation2008) found that the swirl control valve can effectively increase the in-cylinder TKE by using flame visualization and analyses of images. Figure shows a comparison of the TKE for various piston shapes when the CMCV is open and closed. It can be seen that the TKE can also be significantly improved with when the CMCV is closed. There are two peaks in the TKE curve – one during the intake process and the other during the compression process. With the CMCV closed, Pistons B and D have a higher TKE during the intake process and during the early period of the compression stroke; however, the increase of TKE for Piston D is at minimum during the later period of the compression process. Pistons A, B and C are more conducive to maintaining the TKE with the CMCV closed, because the TKE peak during the compression stroke is higher than that during intake process when the CMCV is closed. However, the situation is reversed with Piston D, which gets the maximum TKE in the intake stroke. Figure shows a comparison of the maximum TKE in the compression stroke for various piston shapes. When the CMCV is closed, the TKE at the end of the comparison stroke is significantly improved, in the order of 2–6 times the values when the CMCV is open. Piston B has the highest TKE when the CMCV is closed, indicating that a flat top piston design helps to improve the TKE when there is a strong tumble. The TKE of Piston C is slightly higher than that of Piston A, and the TKE of Piston D is the lowest when the CMCV is closed. The differences in TKE are not obvious when the CMCV is open. At 5500 r/min, the TKE in-cylinder increases significantly due to the higher speed. When the CMCV is open, the TKE at 5500 r/min is more than that when it is closed for 2000 r/min.
Figure 13. TKE for the four piston designs with both CMCV states at: (a) 1500 r/min, (b) 2000 r/min and (c) 5500 r/min.
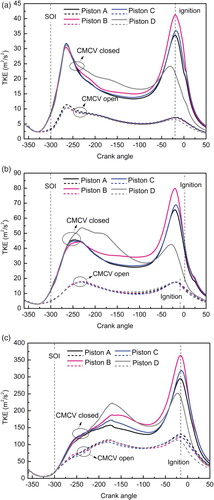
Figure 14. Maximum TKE in the compression stroke for the four piston designs.
4.2. Effect of the piston shape on the fuel evaporation and mixing process
The fuel evaporation and mixing process is dominated by the interaction between the fuel spray and the in-cylinder flow motion. A good distribution of fuel droplets and sufficiently rapid droplet evaporation is essential to obtain a good mixture quality (Zhao et al., Citation1999). Feng, Long, and Feng (Citation2013) investigated the match of conical spray with swirl-chamber schemes with the aid of a 3D CFD software package. The measurement and simulation results indicate that modification schemes with a more homogeneous fuel–air mixture have the potential to further improve the fuel economy of the engine. In order to evaluate the effects of tumble flows and piston design on the fuel distribution, the fuel uniformity index γ is defined as follows:
(5)
where
and
are defined as the local and average fuel–air equivalence ratios, respectively. When γ = 1, the fuel distribution is totally homogeneous, and when γ approaches zero, the fuel is completely unmixed with other gases. The fuel–air equivalence ratio is defined as
(6)
where f is the fuel mass concentration of mixture and (A/F)st is the stoichiometric air–fuel ratio. The fuel liquid average value on the piston and liner surface is defined as
(7)
where n is the number of cells on the surface of the calculation area, mfi is the liquid fuel mass in the cells and Si is the cell area projected onto the surface.
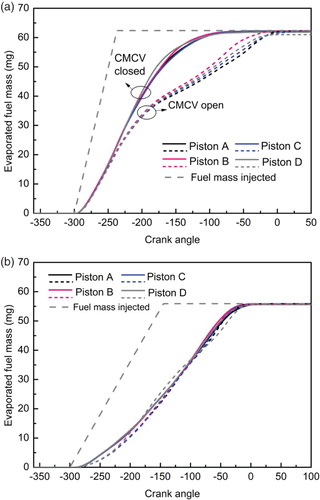
Figure gives the fuel evaporation curve for different piston shapes at 1500 r/min. The fuel was assumed to be iso-octane (RON 90) and was injected during the intake stroke (−300 CAD BTDC, at approximately 2.92 ms). When the CMCV is open (Figure (a)), Piston D has a higher evaporation rate during the early period of the mixing process and Piston B has a higher evaporation rate during the later period of the mixing process. When the CMCV is closed (Figure (b)), Pistons B and D have a faster evaporation rate, which may be due to the higher TKE for these pistons during the intake process and the early period of the compression process, as detailed in the previous section. The higher amount of TKE during the intake process and the early period of the compression process effectively breaks up larger fuel droplets and mixes them with air. It should be noted that there is a certain gap between the mass of the injected fuel curve and the evaporation curve around the TDC for Pistons A and C when the CMCV is closed (Figure (b)). The main reason for this is that part of the fuel mixture returns into the intake manifold, while the intake manifold mesh zone is not considered in the calculation after IVC. Figure shows the distribution of the fuel–air equivalence ratio at −210 CAD (90 CAD after SOI) for different piston designs. It can be seen that a portion of fuel mixture flows into the intake manifold, and the equivalence ratio in the intake manifold is greater for Pistons A and C. Figure shows the evaporation curve for different pistons at 2000 r/min and 5500 rpm. It is apparent that the evaporation rate significantly improves when the CMCV is closed at 2000 r/min. The reason is that closing the CMCV increases the tumble intensity and TKE, both of which lead to the faster evaporation rate. For the speed of 5500 rpm, due to the high amounts of TKE, the CMCV and piston shape have little effect on the fuel evaporation rate.
Figure 15. Evaporation curve for the four piston designs at 1500 r/min with: (a) the CMCV open and (b) the CMCV closed.
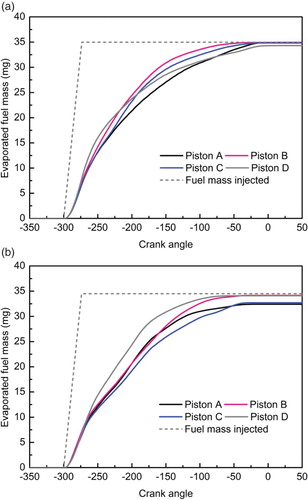
Figure 16. Distribution of the fuel–air equivalence ratio for the four piston designs (−210 CAD at cut planes B, C and E).
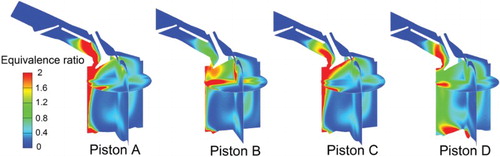
Figure 17. Evaporation curve for the four piston designs at: (a) 2000 r/min and (b) 5500 r/min.
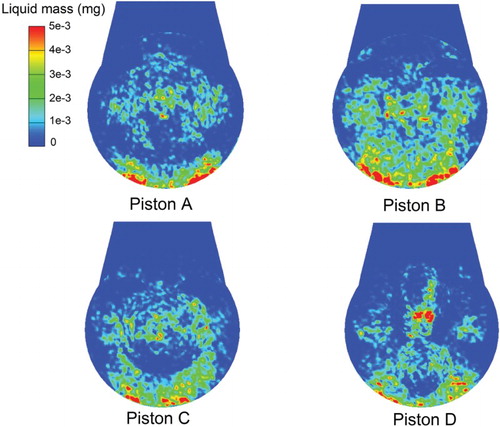
The liquid fuel sedimentation and deposit in different pistons is critical to the combustion process. The comparison of the liquid fuel average value on the piston and cylinder wall for different designs is shown in Figure . It can be seen that the mass of liquid fuel deposit increases significantly after SOI and then gradually decreases. The design of the piston top contour has an impact on the amount of liquid fuel deposit. At 1500 r/min with the CMCV closed, the increase in the fuel deposit rate is fastest for Piston B, while the rate for Piston C is slower than that for Piston A. The amount of liquid fuel deposit for Piston D is lower than for the other designs at different crank angles. Figure shows a comparison of the liquid fuel mass deposit on different piston surfaces at −265 CAD. Piston B has the maximum amount of liquid fuel deposit. Although Piston D has a complex surface shape, the amount of fuel deposited on the piston top is no more than other designs. This may be because the direct fuel injection onto the piston top is avoid due to a delayed SOI, and the fuel droplets flow over the pit position of the piston with the influence of enhanced tumble and piston protrusion. This can clearly be seen from Piston C in Figure .
Figure 18. Liquid fuel average value on the piston and cylinder wall for the four piston designs (at 1500 r/min with the CMCV closed).
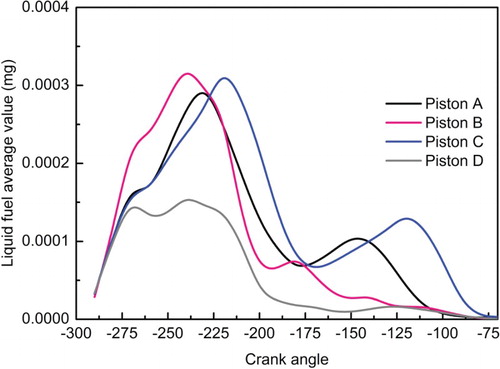
Figure 19. Liquid fuel mass deposit on the four piston design surfaces (−265 CAD at 1500 r/min with the CMCV closed).
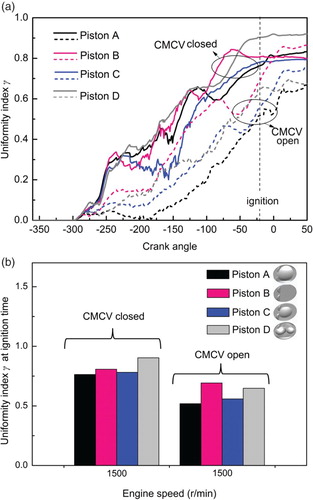
Uniform mixing in the engine is a key parameter that affects the ignition reliability and thermal efficiency. Figure shows the history curve of fuel distribution uniformity and the uniformity value at ignition time for different piston designs at 1500 r/min. As can be seen in Figure (a), the uniformity of the fuel mixture gradually increases after SOI, indicating a gradually uniform mixture. The fuel and air mix quickly with the CMCV closed, which contributes to a more uniform mixture at the time of ignition (Figure (b)). Pistons B and D get a more uniform mixture because of the higher TKE and faster evaporation rates during the intake process and the early compression process. It may be concluded that the TKE has a greater impact on fuel evaporation than tumble for Piston D, especially the higher amount of TKE during the intake process. The fast evaporation rate in Piston D during the intake process contributes to the best uniformity.
Figure 20. History curve of fuel distribution uniformity and the uniformity value at ignition time for the four piston designs at 1500 r/min: (a) history curve of fuel distribution uniformity and (b) uniformity value at ignition time.
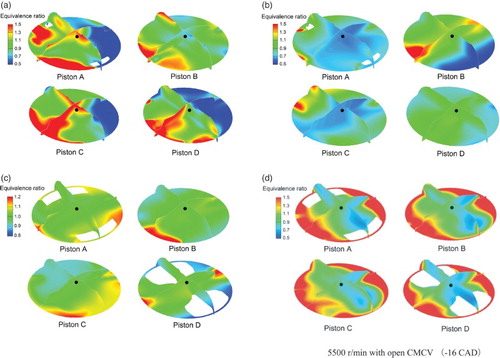
At 2000 r/min, the promotion of fuel evaporation and fuel uniformity is more obvious with the CMCV closed, and the effect of the piston design on the fuel uniformity history curve is not obvious compared with 1500 r/min (Figure ). The uniformity value at ignition time shows little difference for different pistons with the CMCV closed. When the CMCV is open, Pistons B and D get a more uniform mixture at 2000 r/min and 1500 r/min. At 5500 r/min, the effect on the fuel uniformity of closing the CMCV is not as obvious as with the lower speeds due to the high amount of TKE (Figure ). Figure shows the distribution of the fuel–air equivalence ratio at ignition timing for different speeds. At 1500 r/min with the CMCV open, the distribution of the equivalence ratio for different piston designs is significantly inhomogeneous. It can be seen that at the piston top there is a large red area where the equivalence ratio is greater than 1.5. This may be because of the evaporation of residual fuel on the piston top surface. This phenomenon is significantly improved when the CMCV is closed due to the increased fuel evaporation rate being caused by the elevated tumble intensity on the piston top surface. At a speed of 2000 r/min, the uniformity of the fuel–air mixture is further improved when the CMCV is closed; the equivalence ratio at the spark plugs is around 1 for the different piston designs and the maximum fuel–air equivalence ratio is less than 1.2. At 5500 r/min, the uniformity of mixture is no better than at the lower speed due to the reduced mixing time.
Figure 21. History curve of fuel distribution uniformity and the uniformity value at ignition time for the four piston designs at 2000 r/min: (a) history curve of fuel distribution uniformity and (b) uniformity value at ignition time.
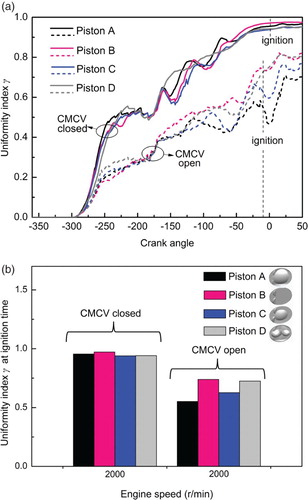
Figure 22. History curve of fuel distribution uniformity and the uniformity value at ignition time for the four piston designs at 5500 r/min: (a) history curve of fuel distribution uniformity and (b) uniformity value at ignition time.
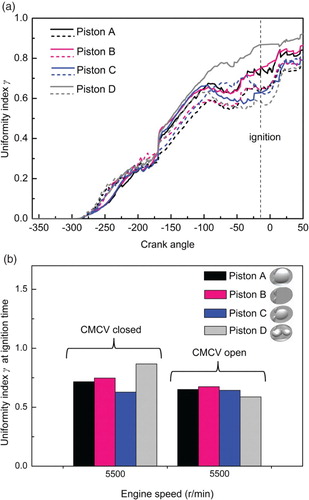
Figure 23. Distribution of the fuel–air equivalence ratio at ignition timing for different speeds (at cut planes A, C and D) at: (a) 1500 r/min with the CMCV open (−20 CAD), (b) 1500 r/min with the CMCV closed (−20 CAD), (c) 2000 r/min with the CMCV closed (2 CAD) and (d) 5500 r/min with the CMCV open (−16 CAD).
4.3. Effect of the piston shape on the combustion process
Figure shows the mean cylinder pressure curve for different piston designs at 1500 r/min. Figure shows the accumulated heat release curve at 1500 r/min. The ignition timing at 1500 r/min is −20 CAD. It can be seen that the heat release rate is significantly increased when the CMCV is closed, which contributes to a higher combustion pressure. Piston B has a higher pressure-rise rate and greater combustion pressure compared with the other piston designs at 1500 r/min, whether the CMCV is open or closed. This may be because there is a higher amount of TKE and better fuel distribution uniformity during the ignition timing for Piston B. When the CMCV is open (Figure (a) and Figure ), Piston D has a minimum cylinder pressure and the lowest combustion speed. This may be because the equivalence ratio at the location of the spark plug for Piston D is lower than that of Pistons A and C (Figure (a)), while, the TKE of Piston D is lowest during ignition time compared with the other designs, as mentioned above. The mean cylinder pressure of Pistons A and C is lower when the CMCV is closed, (Figure (b)), probably due to the lower equivalence ratio at the location of the spark plug (Figure (b)). Furthermore, another reason is that the portion of total fuel is decreased because of some of the fuel mixture flows going into the intake manifold, which is more apparent for Pistons A and C (Figure ).
Figure 24. Mean cylinder pressure curve for the four piston designs at 1500 r/min with (a) the CMCV open and (b) the CMCV closed.
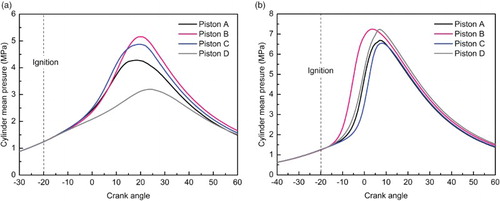
Figure 25. Accumulated heat release curve for the four piston designs at 1500 r/min.
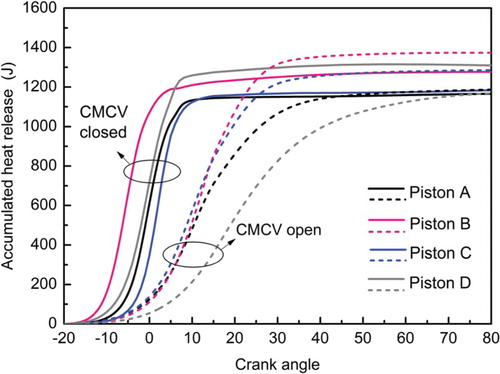
Figure shows the mean cylinder pressure curve for different piston designs at 2000 r/min. The ignition timing at 2000 r/min is −10 CAD when the CMCV is open. When the CMCV is closed, the ignition time is set to 2 CAD in order to avoid an excessive pressure rise rate. Pistons B and C have a higher mean cylinder pressure than Pistons A and D at 2000 r/min when the CMCV is open. Piston A has the lowest combustion pressure because the fuel distribution uniformity is lower than with the other piston designs (Figure (b)). When the CMCV is closed, the difference in the pressure curve for Pistons A, B and C is small, and the cylinder pressure of Piston D is lowest because of the minimum TKE value during the compression process. At the speed of 5500 r/min, Piston D results in a lower combustion pressure (Figure ). This may be because of the distribution of the equivalence ratio during ignition timing. The equivalence ratio at the spark plug place is lowest for Piston D (Figure (d)), which results in a decline in combustion speed. It should be noted that the combustion pressure when the CMCV is closed is obviously lower than that with the CMCV open, as the amount of intake air is restricted at high speed. As can be seen in Figure , the intake air mass is significantly reduced for 5500 r/min when the CMCV is closed.
Figure 26. Mean cylinder pressure curves for the four piston designs at 2000 r/min with (a) the CMCV open and (b) the CMCV closed.
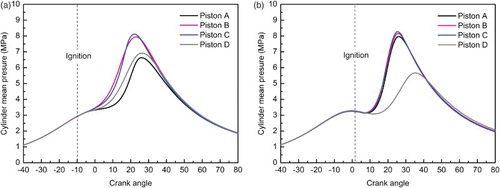
Figure 27. Mean cylinder pressure curves for the four piston designs at 5500 r/min with (a) the CMCV open and (b) the CMCV closed.
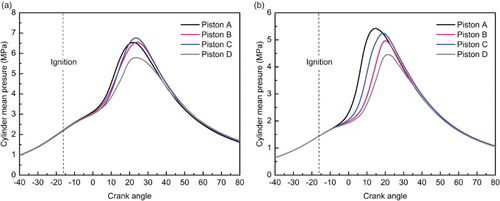
Figure 28. Intake air mass for the four piston designs with both CMCV states.
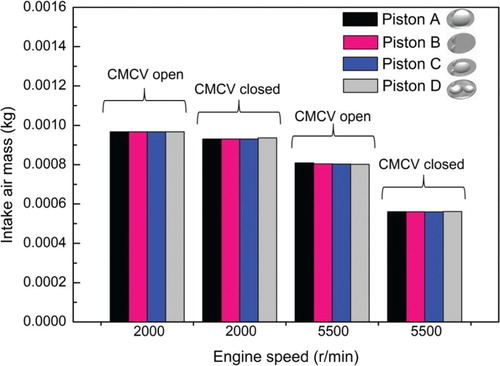
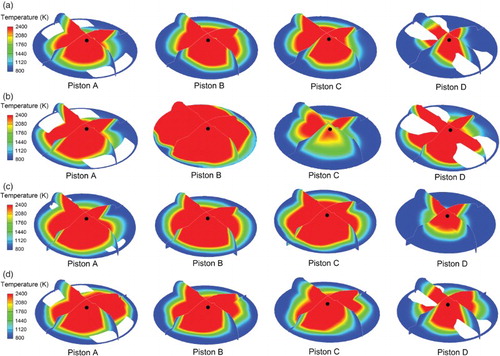
Figure shows comparisons of the temperature distribution for different piston designs at different speeds. The flame propagation of Piston D is slowest at 1500 r/min when the CMCV is open, and Piston B results in the maximum burning rate at 1500 r/min when the CMCV is closed. At the speeds of 2000 r/min and 5500 r/min, the difference in temperature distribution for Pistons A, B and C is not obvious, while Piston D has the slowest burning speed.
Figure 29. Comparisons of the temperature distribution for the four piston designs (at cut planes A, C and D) at: (a) 1500 r/min with the CMCV open (50 CAD after ignition), (b) 1500 r/min with the CMCV closed (40 CAD after ignition), (c) 2000 r/min with the CMCV closed (40 CAD after ignition) and (d) 5500 r/min with the CMCV open (30 CAD after ignition).
5. Conclusion
To better understand the combined effects of piston bowl geometry and CMCVs on the tumble flow and combustion features in GDI engines, this study applied 3D CFD to simulate the intake flow, spray, mixture formation and combustion process of a GDI engine with different piston designs for the cases of the CMCV being open and being closed. Based on the model validation, some important in-cylinder data for the tumble intensity and TKE during the intake process and compression process were obtained. The effects of variable tumble flows and piston designs on fuel distribution and combustion were evaluated at different engine speeds. With numerical simulation, the following conclusions can be drawn:
The tumble intensity in-cylinder is greatly enhanced when the CMCV closed; the tumble ratio is 3–6 times greater than when the CMCV is open. The intake air flows in from the upper side of the baffle when the CMCV is closed, forming a clockwise tumble in the cylinder that contributes to an increase in tumble intensity. Compared with a flat piston, the bowls on the top of Pistons A and C play a guiding role for the air movement, which is beneficial for the formation and development of clockwise tumble. The piston with the dual offset bowls has the minimum tumble ratio because of the projection in the middle of the piston top surface.
When the CMCV is closed, the TKE at the end of the comparison stroke is significantly improved, and is 2–6 times greater than when the CMCV is open. The flat top piston design has the highest TKE at the end of comparison stroke, and the TKE of the piston with the dual offset bowls is lowest during the comparison stroke. The differences in TKE for the four piston designs are not obvious when the CMCV is open.
At 1500 r/min when the CMCV is closed, Pistons B and D have a faster evaporation rate and a more uniform mixture at the time of ignition. In addition, a portion of fuel mixture flows into intake manifold during the fuel–air mixing process, which is more apparent for Pistons A and C. At 2000 r/min, the promotion of fuel evaporation and fuel uniformity is more obvious when the CMCV is closed, and the effect of piston design on the fuel uniformity history curve is not obvious compared to 1500 r/min when the CMCV is closed. When the CMCV is open, Pistons B and D result in a more uniform mixture at 2000 r/min and 1500 r/min.
At the speed of 5500 r/min, the TKE in the cylinder increases significantly due to the higher speed. The CMCV and piston shape have little effect on the fuel evaporation rate. Closing the CMCV is not recommended because it will result in a lower intake air mass and is not conducive to the promotion of combustion pressure.
The simulation results show that Piston B with the CMCV closed can achieve acceptable combustion pressure when the injection timing is fixed during the early stage of the intake process. However, with the increase of engine speed and load, and the advantages of the flat top pistons gradually disappear. Using a single-bowl design (Pistons A and C) achieves the same combustion pressure. The combustion pressure of the piston with the dual offset bowls (Piston D) is significantly reduced due to the lower TKE during the ignition timing.
In future work, the researchers will focus on the effect of injection strategy and piston bowl design on the combustion process, especially when the fuel is injected in the late stage of compression stroke at low load for catalyst heating condition. By adjusting the injection timing, there will be a appropriate air-fuel mixture near the spark plug, and the effect of piston bowl design will be more obvious.
Disclosure statement
No potential conflict of interest was reported by the authors.
Additional information
Funding
References
- Adomeit, P., Jakob, M., Pischinger, S., Brunn, A., & Ewald, J. (2011). Effect of intake port design on the flow field stability of a gasoline DI engine. SAE Paper 2011-01-1284.
- Alkidas, A. C. (2007). Combustion advancements in gasoline engines. Energy Conversion and Management, 48(11), 2751–2761.
- Audi 2.0 T FSI engine. (2004). Volkswagen AG self-study programme 337.
- Baby, X., & Floch, A. (1997). Investigation of the in-cylinder tumble motion in a multi-valve engine: Effect of the piston shape. SAE Paper 971643.
- Bari, S., & Saad, I. (2013). CFD modelling of the effect of guide vane swirl and tumble device to generate better in-cylinder air flow in a CI engine fuelled by biodiesel. Computers & Fluids, 84(15), 262–269.
- Cheng, Q., Zhang, Z. D., Xie, N. L., & Zhu, X. (2014). Influence of nozzle configuration on spray characteristics of multi-hole GDI injector. Transactions of CSICE, 32(1), 45–51.
- Dukowicz, J. K. (1980). A particle-fluid numerical model for liquid sprays. Journal of Computational Physics, 35(2), 229–253.
- Fan, J. Q., Zhang, Z. D., Yin, C. B., & Zheng, W. (2013). Experimental investigation on flow field of variable tumble intake system for 4-valve GDI engine. Chinese Internal Combustion Engine Engineering, 34(5), 50–56.
- Faure, M. A., Sadler, M., Oversby, K. K., Stokes, J., Begg, S. M., Pommier, L. S., & Heikal, M. R. (1998). Application of LDA and PIV techniques to the validation of a CFD model of a direct injection gasoline engine. SAE Paper 982705.
- Feng, L. Y., Long, W. Q., & Feng, W. Q. (2013). Research on match of swirl-chamber and conical spray in indirect injection engine. Engineering Applications of Computational Fluid Mechanics, 7(2), 272–281.
- Hanjalic, K., Popovac, M., & Hadziabdic, M. (2004). A robust near-wall elliptic-relaxation eddy-viscosity turbulence model for CFD. International Journal of Heat and Fluid Flow, 25(6), 1047–1051.
- Han, S., Qin, J., Lin, M. Q., Li, Y. R., & Zhang, Y. D. (2014). Simulation study of injection strategy and tumble effect on the mixture formation and spray impingement in a gasoline direct injection engine. SAE Paper 2014-01-1129.
- Harshavardhan, B., & Mallikarjuna, J. M. (2015a). Effect of combustion chamber shape on in-cylinder flow and air-fuel interaction in a direct injection spark ignition engine – A CFD analysis. SAE Paper 2015-26-0179.
- Harshavardhan, B., & Mallikarjuna, J. M. (2015b). Effect of piston shape on in-cylinder flows and air-fuel interaction in a direct injection spark ignition engine – A CFD analysis. Energy, 81(1), 361–372.
- He, C. M., & Xu, S. C. (2014). The investigation and application of variable tumble intake system on a GDI engine. SAE Paper 2014-01-2885.
- He, Y., Selamet, A., Reese, R. A., Vick, R. K., & Amer, A. A. (2007). Impact of tumble on combustion in SI engines: Correlation between flow and engine experiments. SAE Paper 2007-01-4003.
- ICE Physics & Chemistry. (2010). AVL-FIRE user manual.
- Kidokoro, T., Hoshi, K., Hiraku, K., Satoya, K., Watanabe, T., & Fujiwara, T. (2003). Development of PZEV exhaust emission control system. SAE Paper 2003-01-0817.
- Kim, J. N., Kim, H. Y., Yoon, S. S., & Sa, S. D. (2008). Effect of intake valve swirl on fuel-gas mixing and subsequent combustion in a CAI engine. International Journal of Automotive Technology, 9(6), 649–657.
- Kim, K., Chung, J., Lee, K., & Lee, K. (2008). Investigation of the swirl effect on diffusion flame in a direct injection (DI) diesel engine using image processing technology. Energy & Fuels, 22(6), 3687–3694.
- Kishi, N., Kikuchi, S., Suzuki, N., & Hayashi, T. (1999). Technology for reducing exhaust gas emissions on zero level emission vehicles (ZLEV). SAE Paper 1999-01-0772.
- Liu, A. B., & Reitz, R. D. (1993). Modeling the effects of drop drag and break-up on fuel sprays. SAE Paper 930072.
- Mattarelli, E., Borghi, M., Balestrazzi, D., & Fontanesi, S. (2004). The influence of swirl control strategies on the intake flow in four valve HSDI diesel engines. SAE Paper 2004-01-0112.
- Nishizawa, K., Momoshima, S., Koga, M., & Tsuchida, H. (2000). Development of new technologies targeting zero eimissions for gasoline engines. SAE Paper 2000-01-0890.
- O’Rourke, P. J. (1989). Statistical properties and numerical implementation of a model for droplet dispersion in turbulent gas. Journal of Computational Physics, 83(2), 345–360.
- Pera, C., & Angelberger, C. (2011). Large eddy simulation of a motored single-cylinder engine using system simulation to define boundary conditions: Methodology and validation. SAE Paper 2011-01-0834.
- Raj, A., Raj, G. S., Mallikarjuna, M., & Ganesan, V. (2013). Energy efficient piston configuration for effective air motion – A CFD study. Applied Energy, 102, 347–354.
- Scaringe, R. J., & Cheng, W. K. (2007). Influence of intake port charge-motion-control-valve on mixture preparation in a port-fuel-injection engine. SAE Paper 2007-01-4013.
- Senda, J., & Kobayashi, M. (1994). Modeling of diesel spray impingement on a flat wall. SAE Paper 941894.
- Vaz, M. G., Amorim, F. G., Ribeiro, J. H., Huebner, R., & Valle, R. M. (2014). Numerical analysis of the piston crown geometry influence on the tumble and squish in a single cylinder engine. SAE Paper 2014-36-0300.
- Wang, F., Reitz, R., Pera, C., Wang, Z., & Wang, J. X. (2013). Application of generalized RNG turbulence model to flow in motored single-cylinder PFI engine. Engineering Applications of Computational Fluid Mechanics, 7(4), 486–495.
- Wang, X. Y., Zhao, H., Xie, H., & He, B. Q. (2014). Numerical study of the effect of piston shapes and fuel injection strategies on in-cylinder conditions in a PFI/GDI gasoline engine. SAE Paper 2014-01-2670.
- White, F. M. (2011). Fluid mechanics. New York, NY: McGraw Hill.
- Zhang, Z. J., Zhang, H. Y., Wang, T. Y., & Jia, M. (2014). Effects of tumble combined with EGR (exhaust gas recirculation) on the combustion and emissions in a spark ignition engine at part loads. Energy, 65(1), 18–24.
- Zhao, F., Harrington, D., & Lai, M. (2002). Automotive gasoline direct-injection engines. Warrendale, PA: SAE. 5-6.
- Zhao, F., Lai, M. C., & Harrington, D. L. (1999). Automotive spark-ignited direct-injection gasoline engines. Progress in Energy and Combustion Science, 25(5), 437–562.
- Zheng, Z. L., Liu, C. T., Tian, X. F., & Zhang, X. Y. (2015). Numerical study of the effect of piston top contour on GDI engine performance under catalyst heating mode. Fuel, 157(1), 64–72.