
ABSTRACT
In this work, a bidirectional impulse turbine used in a wave energy device is simulated using a CFD technique and a shape optimization performed with multiple surrogates-assisted multi-objective evolutionary algorithm. The surrogates have been generated using the validated CFD technique. The objectives for the optimization are to maximize the shaft power and to minimize the pressure drop across the turbine. The hub and the tip thickness of the rotor blade profiles are modified and considered as the design variables. The Latin hypercube sampling technique generated design points are evaluated in the CFD solver, the objective responses are used to construct multiple surrogates, and a Pareto optimal front is generated through a multi-objective optimization approach. The turbine efficiency, which is the function of pressure drop and shaft power, is relatively increased by 10.4%.
Abbreviations: BPS: best PRESS; GV: Guide vane; KRG: kriging; LE: leading edge; MOO: multi-objective optimization; OWC: oscillating water column; PRESS: predicted error sum of squares; PS: pressure side or pressure surface; RB: rotor blade; RBNN: radial basis neural network; Ref: reference; RMS: root mean square; RSA: response surface approximation; SS: suction side or suction surface; TE: trailing edge; WAS: weighted average surrogates
1. Introduction
Ocean wave generated by the action of wind over the water surface is a source of enormous renewable energy. Harnessing wave energy is difficult because of uncertainty in ocean waves, natural calamities, etc. The oscillating water column (OWC) (Figure ), a widely used device to extract the power from the waves, has a cylindrical column in which wave rises and replicates the action of piston. This pressurizes the trapped air in the cylinder, and the air drives a bidirectional turbine. The airflow is reciprocating in nature. The turbine rotates in one direction irrespective of the airflow direction (Setoguchi, Santhakumar, Maeda, Takao, & Kaneko, Citation2001). Hence, it is called a bidirectional turbine or bidirectional flow turbine. There are several types of bidirectional turbines, and impulse turbine is one among them.
Figure 1. OWC.
Usually a bidirectional turbine consists of a couple of guide-vane (GV) rows and a rotating blade row. One GV row deflects the flow toward the rotor blade (RB) inlet while the other directs the RB exit flow. An impulse turbine with GVs gives better performance than a turbine without GV (Maeda et al., Citation1999). Several works are done for optimization to modify parameters to improve the performance. The parameters include blade thickness by camber line modification (Gomes, Henriques, Gato, & Falcão, Citation2012), number of RBs and GVs (Badhurshah & Samad, Citation2015), tip clearance (Thakker & Dhanasekaran, Citation2004), RB solidity (Cui & Liu, Citation2014), blade setting angle (Liu, Cui, Kim, & Shi, Citation2016), guide vane shape (Thakker, Dhanasekaran, & Ryan, Citation2005), hub-to-tip ratio (Thakker, Khaleeq, Takao, & Setoguchi, Citation2003), etc. for the impulse turbine. Gomes et al. (Citation2012) optimized the RB thickness distribution by modifying the camber line and they generated the stacking optimized sections along the span. Badhurshah and Samad (Citation2015) optimized the number of RBs and GVs of the turbine for single objective and found that the turbine with 38 rotor blades and 24 guide vanes as the optimal design. The RB with 0.25% tip clearance performs similar to the turbine without any tip clearance (Thakker & Dhanasekaran, Citation2004).
Regarding the performance improvement of a turbomachinery blade, there are several other parameters, which were tried in other types of turbines, and the thickness is one of the important parameters. Takasaki, Takao, and Setoguchi (Citation2014) discussed the effect of blade shape on the performance of a reaction turbine, and found that the blade with linearly varying thickness from the mean radius to the tip gives a higher efficiency, but it does not overcome the weakness of stalling. Samad, Kim, Goel, Haftka, and Shyy (Citation2008) found that the adiabatic efficiency and pressure ratio of the compressor increases if stacking and thickness is modified in a compressor. Sarraf, Nouri, Ravelet, and Bakir (Citation2011) found that the nominal point is shifted toward lower flow rate for the thick blade and the aerodynamic characteristics of an axial fan are steeper and the pressure fluctuations are lower. The flow at the exit is axial for a wide range of flow coefficients for thick blades and the efficiency is lower than thin blades. The thickness of NACA00xx increases the boundary layer thickness at low incidence angle (Sarraf, Djeridi, Prothin, & Billard, Citation2010). A thicker blade has more trailing edge (TE) drag and more mixing loss (Roelke & Haas, Citation1983).
Any engineering optimization problem has multiple variables and multiple objectives along with or without design constraints. The surrogate-based techniques help reducing evaluation of multiple designs in any CFD or experimental method. Multiple surrogate models are used because a single surrogate may give a higher approximation error (Viana, Simpson, Balabanov, & Toropov, Citation2014). Wu, Chau, and Li (Citation2009) used the multiple data preprocessing techniques to improve neural network performance and they found that the neural network with moving average is optimal for flow predictions. The surrogates such as response surface approximation (RSA), weighted average surrogate (WAS), radial basis neural network (RBNN) and krigging (KRG) etc. are used approximate initial objective response data. There are several optimal solutions in multi-objective optimization (MOO). Many optimal solutions within the design space are required to find the Pareto-optimal front (PoF). A hybrid MOO consists of elitist non-dominated sorting of genetic algorithm (NSGA-II) (Goel et al., Citation2007).
Multiple surrogates modeling is implemented in many problems (Husain & Kim, Citation2010; Samad et al., Citation2008). The predicted error sum of squares (PRESS) through the k-fold cross validation strategy finds the RMS error and filters out the inaccurate surrogates (Viana, Haftka, & Steffen, Citation2009). The error is calculated as:
(1)
where, p is the number of points and
is the PRESS vector. For a given design space, a surrogate with the lowest PRESSRMS is defined as the best PRESS surrogate (BPS).
The flow behavior through a turbine annulus at the tip is different from the hub. Varying the thickness from hub-to-tip varies the RB pitch from hub-to-tip, and it influences the flow pattern. The tip region is more liable to separation. The blade shape optimization is necessary to compromise between the reduction of frictional loss and the enhancement of shaft power (Takasaki et al., Citation2014).
This article focuses CFD-based optimization through surrogate-assisted multi-objective optimization approach to optimize the thickness of the RB profile from hub-to-tip of a bidirectional impulse turbine. The simulations are done with an in-house optimization code. Design parameters are modified, solved for flow, PoF are prepared and finally flow analysis is done to compare the original and optimal designs. Detailed approach along with the reason behind the performance improvement is presented in this article.
2. Numerical model and problem description
The reference geometry and profile parameters for bidirectional impulse turbine geometry are taken from an article of Maeda et al. (Citation1999). The detailed specifications of the turbine and the blade profile are shown in Table and Figure (a). The RB has circular profile on the pressure side (PS) and elliptic profile at the suction side (SS), and the maximum blade thickness located at 50% of the chord length.
Figure 2. (a) RB and GV profile. (b) Wave operating range.
Table 1. Turbine specifications.
An unstructured grid with prism layers near the wall is constructed in the flow domain using ANSYS ICEM-CFD. Figure shows the computational domain, mesh and design variables. The computational domain was extended from inlet of GV by 8.5 times of the chord length of GV to achieve the fully developed flow (Thakker & Dhanasekaran, Citation2004). In this work, Reynolds-averaged Navier-Stokes (RANS) equations are solved. The standard k-ε turbulence model with scalable wall function is used for the turbulence closure problem. The wall functions activate the local usage of the log law in regions where the y + is sufficiently small, in conjunction with the standard wall function approach in coarser y + regions. The inlet and the outlet boundary conditions are defined in Table . The performance of the impulse turbine under steady conditions is computed by the following non-dimensional parameters (Maeda et al., Citation1999):
Figure 3. Domain, mesh and definition of design variables. (a) Computational domain. (b) Mesh. (c) Design variables.
Table 2. Mesh and boundary conditions.
Input coefficient,
(2)
Torque coefficient,
(3)
(4)
(5)
(6)
For a higher pressure drop (ΔP), the performance of the turbine is poor because of the high separation on the SS, and the operating range of the turbine is reduced (Badhurshah & Samad, Citation2015). Hence, the minimization of was chosen as an objective function (f1). The primary objective of any turbine is to produce more shaft power for a given flow coefficient or wave condition. Therefore, the shaft power was another objective function (f2) to be maximized. As the flow is bidirectional, the airflow over the turbine is approximately sinusoidal based on regular wave theory. The wave height reaches its crest and changes its direction. Hence, the velocity of the air at the crest and the trough of wave is zero (Figure (b)), and the turbine does not get any power. In this case, the turbine dissipates energy. The minimization of pressure drop will increases the operating range which will increases the power extracting capability (Badhurshah & Samad, Citation2015). Hence, the objectives f1 and f2 are justified.
The blade-profile modification from the hub-to-tip changes the flow area, and the thickness of the blade at 50% chord length is changed by modifying the major radius of the elliptic profile (Figure (c)). Hub thickness (V1) and tip thickness (V2) are the design variables. Although there are many design parameters, the authors considered only thickness and checked if it can improve the performance of the turbine. The effect of each design variable on the objective functions is evaluated by simulating some preliminary designs. Using these results, a design space was created (Table ) and the sample points were selected by the Latin hypercube sampling technique.
Table 3. Design space.
3. Optimization procedure
The CFD analysis requires long time to converge for each simulation, and evaluating many designs takes huge amount of time and computer resources. The systematic optimization methodology helps reducing the number of simulations and finds the optimal design among several alternatives. Hence, multiple-surrogate technique was used to create the initial population for MOO. RSA, KRG, RBNN and WAS were the surrogates constructed for this study. For four surrogates and two objective functions (f1 and f2), eight surrogate models were produced.
3.1. Response surface approximation (RSA)
The response surface approximation methodology (Myers & Montgomery, Citation2002) is used to evaluate the responses obtained from the CFD model by fitting a simple polynomial to it. The response surface model can be expressed as:
(7)
where,
is a unknown function depends on the controllable factors
. The symbol
represents the other sources of variability that are inherent in the system. In this article, a second-order polynomial function is used to approximate the responses and it is given as:
(8)
Where, β′s are the regression coefficient and X′s are the variable vectors.
3.2. Kriging model (KRG)
The KRG model estimates the unknown function as a combination of a constant global model g(x) and a small-scale systematic departure F(x). The F(x) creates localized deviation at some unknown point x using Gaussian correlation with variance () (Simpson, Mistree, Korte, & Mauery, Citation1998).
(9)
The covariance matrix of Z(x) is given as,
(10)
where,
is the spatial correlation function between any two sample points
and R is the correlation matrix.
3.3. Radial basis neural network (RBNN)
The RBNN uses a radial basis function as the activation function. It consists of a hidden input layer and an output layer. In this study, the Gaussian function (ψ) is used as an activation function and it is given as:
(11)
where, σ is the Gaussian width, y is the design points, and yc is the known sample point. The approximation built by radial basis function is given as:
(12)
where, ωi is the weight coefficient and ω0 is the bias term.
3.4. Weighted Average Surrogate (WAS)
WAS estimates a weighted function (yWAS), which is a weighted average of multiple surrogates.
(13)
where, ωKRG, ωRSA and ωRBNN, are the weights of the corresponding surrogates, and the sum of the weights is equal to one. The weights of the surrogates are estimated from the PRESS (Viana, Citation2011) and are calculated as:
(14)
(15)
(16)
where, Ei is the PRESS calculated error and N is the number of surrogates.
3.5. Best PRESS surrogate (BPS)
The BPS strategy finds the lowest PRESS surrogate. The BPS can be different for different problems, because quality of fit relies on the nature of data. For each surrogate, the PRESS for f1 and f2 were calculated.
3.6. MOO and clustering
MOO finds relationship among conflicting objectives and finds a set of optimal solutions. Every solution set has dominated and non-dominated solutions. It is expressed as:
(17)
Where
is a vector of M objective functions and
is the vector of N design variables. Vector
dominates over vector
when
is strictly better than
for at least one objective and it is no worse than
for all objectives. If this condition is not valid then
is not dominated by
. Between the two solutions,
is the non-dominated solution if
dominates
.
Global Pareto optimal set is obtained by using hybrid NSGA-II. Multiple surrogate models supplied the initial population and approximate Pareto optimal solutions are obtained (Deb, Citation2009). After that, k-means clustering algorithm is used to split the Pareto optimal solutions into five clusters. The detailed MOO procedure is shown in Figure .
Figure 4. Multi objective optimization procedure.
4. Results and discussion
Initially, the turbine was designed in CAD software, the flow domain was extracted for a single blade passage and periodic conditions were used. The mesh was generated several times and checked if the results matches well with the experimental results of Maeda et al. (Citation1999), and gives stable results. Based on the grid dependency test, the optimal number of elements was 1.28 million, as the efficiency of the turbine remained same between 1.2 million and 2.3 million for three different flow coefficients (Figure ).
Figure 5. Grid dependency test.
The non-dimensional parameters such as input coefficient (CA), torque coefficient (CT) and efficiency (η) were validated with experimental results (Figure ). The rotational speed of the RB was constant (600 rpm), and the inlet axial velocity was varied to get different flow coefficients. When ϕ < 1.2, there is a small degree of mismatch between the numerical and the experimental efficiencies because of the slight pressure difference occurs due to the surface finish issue. In the reference model for higher flow coefficients, the efficiency decreases and torque increases because inlet the axial velocity is high, which increases the torque. At the same time, the pressure drop and the energy loss are also high.
Figure 6. Comparison between numerical and experimental results. (a) Input coefficient. (b) Torque coefficient. (c) Efficiency.
Nine design points for the two variables (V1 and V2) were evaluated by the RANS solver at ϕ = 1.25 and PoF was obtained (Figure ). For each objective function, four surrogates were constructed and a total of eight surrogates generated the PoF via NSGA-II. The number of generations of NSGA-II was set to 250 (stopping criteria). The RSA model has the least PRESS for both the objectives (Table ) and the RSA-RSA model was used as the BPS-BPS for further discussions. The KRG model has the highest PRESS and is ignored for further analysis in this work.
Figure 7. Pareto optimal Front.
Table 4. PRESS.
The results of the cluster points from each surrogate model are presented in Table . The cluster points obtained through k-means clustering algorithm for BPS-BPS model and the corresponding CFD results are shown in Table . The points A, B, C, D and E implied the cluster points or the designs obtained after clustering. The point A shows the point at extreme end point while the point E shows the opposite end in the PoF. To get a higher f2, the values of both the variables should be increased because increase in f2reduces the flow area and accelerates the flow as shown in Figure . At the same time, the thickness increases the frictional losses and pressure drop (f1), and reduces the efficiency (f0) and operating range.
Figure 8. Streamlines at different span (ϕ = 2.75).
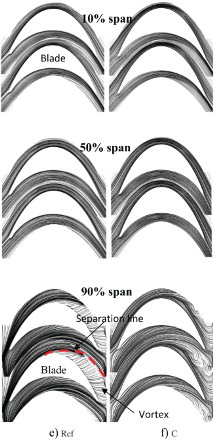
Table 5. Multi objective results of single cluster point from each surrogate.
Table 6. CFD and RSA results for cluster points.
The reference blade has a constant thickness from the hub-to-tip. The optimal design shows that a lower V1 and a higher V2 results in a better performance (Table ). A higher V2 reduces the area near the blade tip, and the flow remains attached to the blade surface as shown in Figure . The case A produces 6.85% higher shaft power and 4.23% lower pressure drop as compared to the Ref case. The case E increased the shaft power by 13.79% (Table ). The efficiency (Eq 5) of the turbine is increased by 10.38% for C.
Figure shows the pressure distribution on the SS of the blade. The pressure on the tip and at the 50% chord length is higher for the Ref for ϕ = 2.75. The exit pressure of the Ref is higher than the optimized blade (case C) results in a high pressure region from the blade mid-chord to the TE, and the boundary layer separation occurs. In the optimized blades, static pressure is decreased at the 50% chord. This leads to the increase in flow and torque at the exit. The high-pressure regions surround more area of the PS for the case C implying the flow attachment (Figure ).
Figure 9. Pressure contour for different flow coefficients on SS.
Figure 10. Pressure contour for different flow coefficients on PS.
Figure shows the streamlines, and the separation lines are marked with dotted lines. For ϕ = 1.25, the flow is attached and the streamlines are uniform over the SS except the near the tip and the hub region. In higher ϕ, the flow separates near the hub and the tip. For ϕ = 2.75 for Ref, the flow is separated at 50% chord. This can be visualized from the separation lines of detachment accompanied by a passage vortex (Figure ). The separation region, which occupies about 40% of the span from the tip near the TE, is comparatively lower in the case of optimized blade C. In A and C, the separation is delayed, and the separated area is relatively less.
Figure 11. Streamlines on SS and PS of rotor blade.
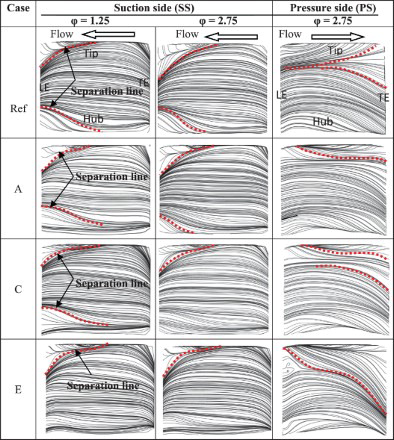
The flow near the hub is almost uniform in all the optimized cases. Uniform increase in thickness from hub-to-tip results in high frictional losses. Hence, the hub thickness is reduced and tip thickness is increased in A and C, the flow area near the tip is confined and the formation of passage vortex is reduced. Streamlines on the PS for ϕ = 2.75 is shown in Figure . The separation lines are visible on the PS of the case E as the thickness of the blade profile is uniformly increased. Hence, frictional losses on the blade E are also increased.
For ϕ = 2.75, streamlines at 90% of blade span is shown in Figure . In Ref, the passage vortex appears at 50% chord and enlarges itself as it moves toward the TE. In C, the passage vortex is reduced and shifted resulting in the higher torque in C.
A turbo line drawn from the hub to the tip on the SS midchord is shown in Figure . Figure shows the static pressure distribution along the turbo line. At the mid-chord, the designs C and E show the minimum variation in pressure distribution along the span. There is a strong span-wise pressure-gradient in C and E, this drives the boundary layer fluid and secondary flows near the end wall toward the mid span direction near the SS. At the higher flow coefficients, a lower pressure region is spotted near the hub (∼10% span), where the velocity reaches the maximum and then decrease because of the spanwise adverse pressure gradient. The velocity distribution on the SS mid-chord is shown in the Figure . The SS velocity at the mid-chord increases for C and E as compared to that of the reference case. This velocity in the end wall region is lower as compared to the mid-span region because of the higher pressure and strong secondary flows near the end wall.
Figure 12. Turbo line at the suction side of the rotor blade.
Figure 13. Span wise distribution of static pressure at mid-chord. (a) ϕ = 1.25. (b) ϕ = 2.75.
Figure 14. Span wise distribution of axial velocity at mid-chord. (a) ϕ = 1.25. (b) ϕ = 2.75.
Figure shows the performance characteristics of the reference and the optimized blades for a wide range of flow rates. The pressure drop (f1) is lower in C and A than in Ref, and it is the highest for E (Figure (a)). Figure (b) shows that the optimized cases produce higher shaft power (f2). Figure shows that the efficiency (f0) of the turbine is increased for a wide range of flow coefficient for C.
Figure 15. Effect of blade shape on the turbine performance. (a) Pressure-drop (f1) change with flow rate. (b) Shaft-power (f2) change with flow rate.
Figure 16. Efficiency change with flow coefficient.
5. Conclusions
In this article, a bidirectional impulse turbine is optimized for pressure drop minimization and shaft power maximization using CFD analysis and multiple-surrogate-based multi-objective optimization algorithm. The conclusions are:
Among the surrogates, RSA gave the least PRESS and was the BPS for both the objectives. It produced the least RMS error after evaluation by NSGA-II and CFD analysis.
A maximum pressure-drop of 3.6% and increase in shaft-power of 12.33% were obtained at the extreme end designs in the Pareto optimal front. The shaft-power enhancement was due to the low pressure at the blade exit and the flow attachment near the leading edge of the SS tip. This results in a steep velocity gradient on the pressure and SS.
The decrease in hub thickness and increase in tip thickness improves the turbine performance in terms of efficiency by compromising between the frictional loss and shaft power.
Increase in the tip thickness confines the flow area near the tip and reduces the formation of passage vortex on the suction side.
The efficiency, which is the function of both objectives, is relatively increased by 10.38% for case C. The final values of V1 and V2 are 15.4 and 17.6 mm respectively, where the reference value is 16 mm for both variables.
Symbols
| b | = | blade height (m) |
| CA | = | input coefficient |
| CT | = | torque coefficient |
| = | root mean square error | |
| f0 | = | combined objectives (η) |
| f1 | = | objective function 1(ΔP) |
| f2 | = | objective function 2(Psh) |
| lr | = | RB chord length (m) |
| n | = | span normalized |
| = | shaft power (W) | |
| Q | = | flow rate |
| rR | = | mean radius (m) |
| To | = | output torque (N-m) |
| UR | = | circumferential velocity at mean radius (m/s) |
| Va | = | mean axial velocity (m/s) |
| = | weight for a surrogate | |
| z | = | number of RBs |
| ΔP | = | pressure drop between settling chamber and atmosphere (Pa) |
| η | = | turbine efficiency |
| ω | = | angular velocity of RB (rad/s) |
| ρa | = | air density ( |
| = | PRESS vector | |
| = | controllable factor | |
| = | regression coefficient | |
| ψ | = | real valued function |
| α | = | constant (Equation 15), = 0.05 |
| γ | = | constant (Equation 15), = −1 |
| ϕ | = | flow coefficient |
| = | Gaussian function |
Disclosure statement
No potential conflict of interest was reported by the authors.
ORCID
Abdus Samad http://orcid.org/0000-0002-0343-2234
Additional information
Funding
Related Research Data
References
- Badhurshah, R., & Samad, A. (2015). Multiple surrogate based optimization of a bidirectional impulse turbine for wave energy conversion. Renewable Energy, 74, 749–760. doi: 10.1016/j.renene.2014.09.001
- Cui, Y., & Liu, Z. (2014). Effects of solidity ratio on performance of OWC impulse turbine. Advances in Mechanical Engineering, 7(1), 121373–121373. doi: 10.1155/2014/121373
- Deb, K. (2009). Multi-objective optimization using evolutionary algorithms. Chichester: John Wiley & Sons.
- Goel, T., Vaidyanathan, R., Haftka, R. T., Shyy, W., Queipo, N. V., & Tucker, K. (2007). Response surface approximation of Pareto optimal front in multi-objective optimization. Computer Methods in Applied Mechanics and Engineering, 196(4–6), 879–893. doi: 10.1016/j.cma.2006.07.010
- Gomes, R., Henriques, J., Gato, L., & Falcão, A. (2012). Multi-point aerodynamic optimization of the rotor blade sections of an axial-flow impulse air turbine for wave energy conversion. Energy, 45(1), 570–580. doi: 10.1016/j.energy.2012.07.042
- Husain, A., & Kim, K. (2010). Enhanced multi-objective optimization of a microchannel heat sink through evolutionary algorithm coupled with multiple surrogate models. Applied Thermal Engineering, 30(13), 1683–1691. doi: 10.1016/j.applthermaleng.2010.03.027
- Liu, Z., Cui, Y., Kim, K., & Shi, H. (2016). Numerical study on a modified impulse turbine for OWC wave energy conversion. Ocean Engineering, 111, 533–542. doi: 10.1016/j.oceaneng.2015.11.005
- Maeda, H., Santhakumar, S., Setoguchi, T., Takao, M., Kinoue, Y., & Kaneko, K. (1999). Performance of an impulse turbine with fixed guide vanes for wave power conversion. Renewable Energy, 17(4), 533–547. doi: 10.1016/S0960-1481(98)00771-X
- Myers, R. M., & Montgomery, D. C. (2002). Response surface methodology: Process and product optimization using designed experiments. New York, NY: John Wiley & sons.
- Roelke, R. J., & Haas, J. E. (1983). The effect of rotor blade thickness and surface finish on the performance of a small axial flow turbine. Journal of Engineering for Power, 105(2), 377. doi: 10.1115/1.3227426
- Samad, A., Kim, K., Goel, T., Haftka, R. T., & Shyy, W. (2008). Multiple surrogate modeling for axial compressor blade shape optimization. Journal of Propulsion and Power, 24(2), 301–310. doi: 10.2514/1.28999
- Sarraf, C., Djeridi, H., Prothin, S., & Billard, J. (2010). Thickness effect of NACA foils on hydrodynamic global parameters, boundary layer states and stall establishment. Journal of Fluids and Structures, 26(4), 559–578. doi: 10.1016/j.jfluidstructs.2010.02.004
- Sarraf, C., Nouri, H., Ravelet, F., & Bakir, F. (2011). Experimental study of blade thickness effects on the overall and local performances of a controlled vortex designed axial-flow fan. Experimental Thermal and Fluid Science, 35(4), 684–693. doi: 10.1016/j.expthermflusci.2011.01.002
- Setoguchi, T., Santhakumar, S., Maeda, H., Takao, M., & Kaneko, K. (2001). A review of impulse turbines for wave energy conversion. Renewable Energy, 23(2), 261–292. doi: 10.1016/s0960-1481(00)00175-0
- Simpson, T., Mistree, F., Korte, J., & Mauery, T. (1998). Comparison of response surface and kriging models for multidisciplinary design optimization. 7th AIAA/USAF/NASA/ISSMO Symposium on Multidisciplinary Analysis and Optimization. doi: 10.2514/6.1998-4755
- Takasaki, K., Takao, M., & Setoguchi, T. (2014). Effect of blade shape on the performance of wells turbine for wave energy conversion. International Journal of Mechanical, Aerospace, Industrial, Mechatronic and Manufacturing Engineering, 8(12), 133–136.
- Thakker, A., & Dhanasekaran, T. (2004). Computed effects of tip clearance on performance of impulse turbine for wave energy conversion. Renewable Energy, 29(4), 529–547. doi: 10.1016/j.renene.2003.09.007
- Thakker, A., Dhanasekaran, T., & Ryan, J. (2005). Experimental studies on effect of guide vane shape on performance of impulse turbine for wave energy conversion. Renewable Energy, 30(15), 2203–2219. doi: 10.1016/j.renene.2005.02.002
- Thakker, A., Khaleeq, H. B., Takao, M., & Setoguchi, T. (2003). Effects of hub-to-tip ratio and Reynolds number on the performance of impulse turbine for wave energy power plant. KSME International Journal, 17(11), 1767–1774. doi: 10.1007/bf02983607
- Viana, F. A. (2011). Multiple surrogates for prediction and optimization (Doctoral Thesis). University of Florida, USA.
- Viana, F. A., Haftka, R. T., & Steffen, V. (2009). Multiple surrogates: How cross-validation errors can help us to obtain the best predictor. Structural and Multidisciplinary Optimization, 39(4), 439–457. doi: 10.1007/s00158-008-0338-0
- Viana, F. A., Simpson, T. W., Balabanov, V., & Toropov, V. (2014). Special section on multidisciplinary design optimization: Metamodeling in multidisciplinary design optimization: How far have we really come? AIAA Journal, 52(4), 670–690. doi: 10.2514/1.j052375
- Wu, C., Chau, K., & Li, Y. (2009). Methods to improve neural network performance in daily flows prediction. Journal of Hydrology, 372(1–4), 80–93. doi: 10.1016/j.jhydrol.2009.03.038