
ABSTRACT
A vertically moving underwater vehicle with an air film attached to its exterior can significantly weaken the hydrodynamic disturbances caused by launch conditions. To quantify the ability of a pressure-equalizing film to improve the trajectory and attitude robustness of vehicles under an uncertain platform velocity input, the response surface model of nonintrusive polynomial chaos was built based on sample spacing constructed with a nested sparse grid-based stochastic collocation method. The results indicate the uncertainty bars of the horizontal displacement exhibit an expanding-contracting-expanding pattern with a ‘spindle’ shape as the vehicle moves. In contrast, the horizontal velocity presents an ‘hourglass’ shape. Additionally, the horizontal velocity and the pitching angular velocity of the vehicle are quite sensitive to the uncertainty of the platform velocity, and the large mean value and uncertainty of these factors will statistically worsen the trajectory and attitude of the vehicle. Implementation of an exhaust during the water-emerging process can weaken the horizontal motion and pitching rotation of a vehicle, as well as the relevant uncertainty. This is attributed to a generated pressure-equalizing region with a low uncertainty. Thus, an exhaust is urgently needed in the water-emerging process of these vehicles.
1. Introduction
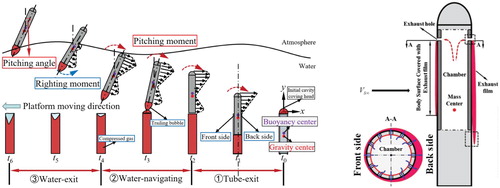
Generally, an underwater vehicle needs to be carried by a platform to be maneuverable in water. During the process of moving through a water layer after being launched (as shown in Figure ), the vehicle unavoidably suffers a series of stochastic disturbances from the motion of the launch platform (involving changes in the water depth, yaw angle, and velocity) and the launch environment (involving the ocean current and wave movement and the phase medium transition when going through the water’s surface) (Chen, Ma, Yu, & Jiang, Citation2016), leading to a self-floating trajectory and an uncontrolled water-exit attitude with poor robustness. Thus, some control measures need to be applied. The pressure-equalizing exhaust technique is one of the most effective control methods. Recently, it has been widely used in practice because of its simple structure, low design difficulty and good adaptation of the working effect to the platform motion (Bao, Quan, & Wei, Citation2014; Ma, Chen, Yu, & Liu, Citation2018; Qin, Citation2014; Zhang & Wang, Citation2015). Its basic working mechanism can be explained using Figure . Briefly, when equipping an air film upon the exterior of the vehicle by means of an exhaust, its coverage components on the exterior of the vehicle yield a small lateral resultant force to produce a pitching moment, then the goal of the trajectory and attitude improvement can be achieved.
Figure 1. Schematic of the rotation of the vehicle under launch impact conditions (left) and pressure-equalizing exhaust (right).
In recent years, research on the water-emerging process of vehicles and their control techniques has gradually increased. However, most of these works focus on deterministic results with approximate flow conditions and neglect the existence of uncertainty (Mnasri, Hafsia, Omri, & Maalel, Citation2010; Qi, Feng, Xu, Zhang, & Li, Citation2016; Shereena, Vengadesan, Idichandy, & Bhattacharyya, Citation2013). However, it seems extremely dangerous for this situation that a launch system has a good performance estimate with a large confidence interval (Levy, Citation2005). The designed trajectory of a vehicle based on deterministic simulations may fail in the presence of uncertainties. Therefore, it is necessary to evaluate the performance of the flow control technique considering the uncertainty in the input variables. Based on previous results on the mechanism of a pressure-equalizing exhaust technique on improving the hydrodynamic load and water-exit attitude of a vehicle (Ma, Chen, Yu, Song, & Mu, Citation2018), it is of interest to present the performance of this technique in terms of robustness, considering the platform velocity as a real stochastic input.
Currently, the use of an established numerical model in solving real cases has increased (Ardabili et al., Citation2018; Fotovatikhah et al., Citation2018). Here, the systematic exploration of a performance evaluation with uncertain input variables or introducing uncertainties into the design process is called the uncertainty qualification (UQ), and a series of methods have been addressed to build these numerical models for practical use. Polynomial Chaos Expansion (PCE) is one of these methods, which has the key advantages of efficiency and utility in representing and propagating large uncertainties through complex models (Najm, Citation2009). More specifically, the system response is expanded using an orthogonal polynomial form of uncertain stochastic variables, thus these stochastic characteristics are converted into the deterministic coefficients of PCE. Rodio, Abgrall, and Congedo (Citation2017), Rodio and Congedo (Citation2014) and Congedo, Goncalves, and Rodio (Citation2015) adopted a non-intrusive PCE to quantify the uncertainty and its propagation for cavitation occurring in a venturi tube with a physical inlet, and modeled the parameters’ uncertainties. After comparing the numerical solutions with error bars and experimental curves, flow field parameters presented a large sensitivity to the uncertainties of the inlet boundary conditions. Xiong, Xiong, and Xue (Citation2015) made use of the PCE method to implement the trajectory optimization under uncertainties and obtained some solutions that are not sensitive to inputs with uncertainties. Mariotti, Siconolfi, and Salvetti (Citation2017) implemented a UQ analysis about the sensitivity to the grid resolution and the weight of the explicit filter of LES for the flow around a rectangular cylinder using generalized polynomial chaos. The parameters of interest, such as the time average of the drag coefficient, the time standard deviation of the lift and the pressure coefficients were obtained. Fisher and Bhattacharya (Citation2011) developed a framework for trajectory optimization with a probabilistic uncertainty in the system parameters based on a generalized PCE. After verification using Monte Carlo simulations, the PCE-based approach was determined to be a strong candidate for solving a stochastic optimal control problem.
In the present work, a stochastic response surface model using a non-intrusive PCE method is built to investigate the performance of a pressure-equalizing film on the robustness of the trajectory and attitude of a vehicle under the uncertain input of the platform velocity. The sample space is constructed using nested sparse grid-based stochastic collocation method (NSSCM) (Luo et al., Citation2009; Patterson, Citation1968). The parameters of interest are presented as the mean values, uncertainty bars and standard deviations. The uncertainty bars given here correspond to 95% confidence interval.
2. Numerical methods and conditions
2.1. Simulation setup
Since a certain amount of unsteady calculation cases usually imply an unaffordable computational cost, here, a total of 38 cases are calculated. In addition, the calculation stability and method consistency among different cases need to be ensured, thus the standard turbulence model is adopted. Since the exhaust process involves changing the density of pre-filled air in a chamber, the energy equation here is solved with the air set as the ‘ideal-gas’. The interaction between the air and the water is worked out using the Mixture Model (see Ma, Chen, Yu, & Wang, Citation2019, for more detail).
In this paper, the governing equations of the flow field are discretized based on the finite volume method using the CFD code Fluent. The pressure-velocity coupling algorithm is set as a SIMPLE scheme. The QUICK scheme is adopted for the spatial discretization of the volume fraction equation, and the Body Force Weighted scheme is set as the pressure interpolation scheme. The unsteady motion of the vehicle with three degrees of freedom (3DOF) is achieved by means of the UDF technique. The translation and rotation of the vehicle in 3DOF motion are implemented using the dynamic layering method and local remeshing method. After a grid independence check, the grid number is 6,000,000.
2.2. Geometry model and source of uncertainty
The object of study is a projectile with a hemispherical head and a 5.5 D cylindrical body. Two slots for the exhaust are equipped at axial locations l1 ≈ 0.205L and l2 ≈ 0.227L, as shown in Figure (a). Only half of the computational domain is simulated for the reduction of the calculation amount, considering the water-emerging process of a vehicle is achieved in an axisymmetric flow field when the water is static. The relevant boundary conditions are given in Figure (b). These deterministic cases all carry the same initial vertical velocity, and the launch tube is completely filled with compressed air, which forms a trail bubble after the bottom of the vehicle leaves the tube exit. The pressure inside the chamber equals the hydrostatic pressure of the water at launch depth. When the vehicle moves, the acceleration of the fluid and the decrease of the water depth near the venting slots yield a relatively low local pressure, inducing an exhaust of the chamber through the venting slots.
Figure 2. (a) Geometry model, (b) Computational domain and boundary conditions, and (c) Computational mesh.
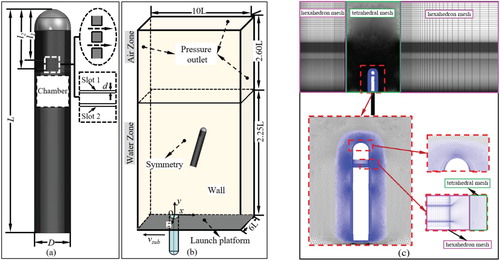
In this paper, the source of uncertainty is the launch platform velocity. Considering the feature of this launch condition, it is supposed to obey the normal distribution (N(Vsub, (0.1 Vsub)2)). Altogether 38 collocation points (19 for cases with an exhaust and 19 for cases without an exhaust) are employed through four times extension, as shown in Table .
2.3. Numerical method validation
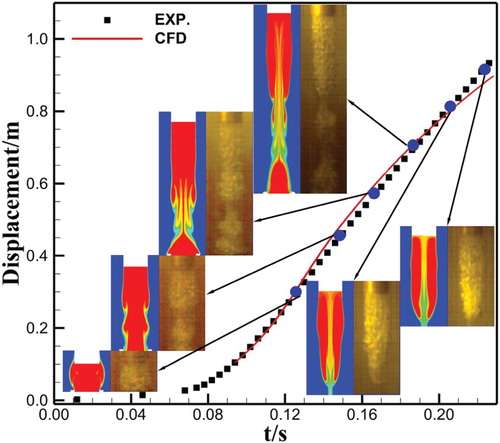
For the validation of the numerical method used, an unsteady ejection process of a projectile was simulated. The experiment was implemented using a water tank shown in Figure , which contains an air ejection system. A comparison between the experimental and numerical results is performed on the time-varying displacement of the projectile and its trailing bubbles at certain moments (as shown in Figure ). The results show that the maximum relative error of the displacement is less than 5%, and the bubbles that are attached to the bottom of the projectile agree well with one another.
Figure 3. Schematic of the water tank with a gas ejection system and horizontal moving platform.
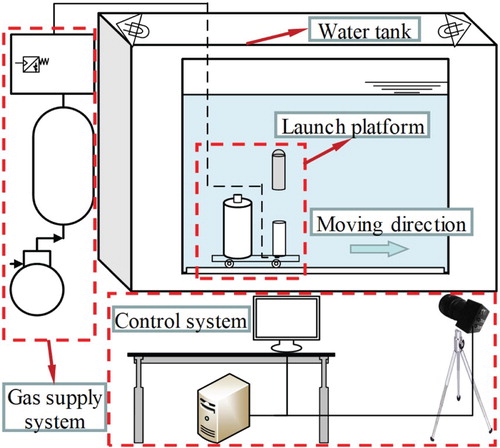
Figure 4. Experimental and numerical displacements of the vertically ejected projectile and the relevant trail bubble at a certain typical moment.
3. Uncertainty quantification approach
3.1. Nonintrusive polynomial chaos (NIPC) and orthogonal polynomials
The NIPC generally employs an orthogonal polynomial form to express the stochastic process. For the stochastic process , its response surface model to a vector
with n independent stochastic variables can be written in the following polynomial form:
(1) where
is the probability space,
is the sample space,
is a
-algebra subset of
, and
is the probability measure of
.
is a random event,
is the PC coefficient, and
is a multivariate orthogonal polynomial function in regard to the probability distribution function of
.
Since the launch platform velocity studied in this paper obeys the Gaussian distribution, refers to the Hermite orthogonal polynomials based on Table . The one-dimension normalized form is provided via the recursion formula:
(2)
Table 1. The probability distribution form and the corresponding polynomials (Fisher & Bhattacharya, Citation2011).
Table 2. One-dimensional quadrature points at different precisions.
For practical use, the PCE (Equation (1)) with n dimensions (number of uncertain variables) and p orders (the highest order of polynomials) needs to be truncated to terms, and the value can be calculated using
, which is also the number of
.
3.2. Nested sparse grid-based stochastic collocation method
Generally, the construction of a sample space, which is referred to as the collocation points, directly determines the accuracy of a response surface model and the calculation amount. The selected NSSCM can not only employ fewer collocation points to avoid the so-called Curse of Dimensionality problem, it can also make full use of the lower-order points when the PC order must increase. Based on the extending method presented by Patterson (Citation1968), one-order-higher sample space consists of the existing sample space of a lower order and some added points. Therefore, the collocation points of one dimension can be extended each time as provided in Table 2. The collocation points listed above are the ones used in this article, so for cases with or without an exhaust, a total of 38 cases are needed.
3.3. Calculation of the PCE coefficients
After the collocation points are selected, the unsteady calculation of the water-emerging process of the vehicle can be implemented under deterministic conditions corresponding to collocation points. Then, the sample space can be constructed using the parameters that are obtained from these simulation results. At this time, the building of the response surface model of the non-intrusive PCE is transformed into solving the PCE coefficients. As shown in Equation (3), after the left-hand values are obtained from the sample space constructed by the numerical results, the PCE coefficients
can be obtained by solving these equations using the regression method (Salehi, Raisee, Cervantes, & Nourbakhsh, Citation2017; Xiong, Yang, Liu, & Chen, Citation2015).
(3)
3.4. Statistical property post-processing
When the coefficients are calculated, the response surface model is explicitly built (Equation (1)). Since the Hermite orthogonal polynomials that are used are normalized, the mean
and the variance
(in the stochastic sense) can be easily calculated with the following formula (Mazzoni, Ahlfeld, Rosic, & Montomoli, Citation2018; Salehi et al., Citation2017; Zhao, Citation2014):
(4)
Accordingly, the parameters of interest in this paper can be non-dimensionalized using the following expressions:
(5)
4. Results
4.1. Validation of PCE
The UQ analysis is performed based on the PCE response surface model, which is mainly built using parameters extracted from the simulation results. To ensure the validity of relevant results, it is necessary to evaluate the accuracy and the order convergence of this model in the form of polynomials. Figure gives the cumulative distribution function (CDF) of the attitude (the pitching angle relative to the y-axis) of the vehicle for cases with an exhaust when its bottom leaves the surface of the water. These results are computed from the built PCE response surface model with different orders (2nd order 3rd order and 4th order). The order convergence can be evaluated through the coefficient of variation (CV) of the root mean square deviation (RMSD) between the response surface models with adjacent orders, it is calculated using the following formula (Isukapalli, Balakrishnan, & Georgopoulos, Citation2004; Xie, Citation2014):
(6) where m stands for the number of samples picked according to the CDF.
is the response value calculated from the built PCE model.
is the response value that is one-order higher than
. When the value of CV is no more than 5%, the PCE is considered to meet the demand of the order convergence.
Figure 5. CDF of the pitching angle when the bottom of the vehicle leaves the surface of the water with different orders of PCE.
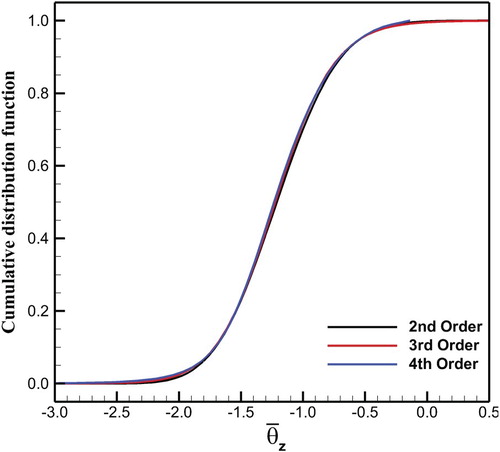
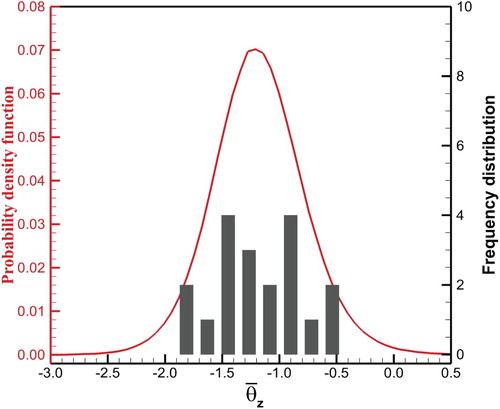
After calculation, the value of the CV between the 2nd order PCE and the 3rd order PCE is 2.09%. In addition, the value of the CV between the 3rd order PCE and the 4th order PCE is 3.7%. Therefore, the built response surface model can be considered to be order-convergent. To obtain a relatively high accuracy without a large amount of redundant calculations, the third-order PCE was adopted to deal with the parameters of interest. And to present the accuracy of the built response surface model, Figure demonstrates the probability density function (PDF) of the attitude of the vehicle employing the 3rd order PCE. Accordingly, the relevant frequency distribution of the pitching angle obtained from 19 deterministic simulation cases is also provided. Their distributions agree well with one another with a very close mean value. Thus, the response surface model built with the 3rd order PCE can meet the accuracy requirements in expressing the water-emerging process of a vehicle with an exhaust considering the platform velocity as an uncertain variable.
Figure 6. PDF (3rd order PCE) and frequency distribution of the pitching angle when the bottom of the vehicle leaves the water.
4.2. Typical developing process of pressure-equalizing film and its effect on a vehicle under deterministic condition (1DOF)
Generally, the formation of a pressure-equalizing film is the air injection from a pre-filled chamber into the water layer surrounding the exterior of the vehicle. Its working effect comes from the special distribution of pressure and mainly depends on its developing process. To clearly explain the basic evolution features of pressure-equalizing film and its working mechanism, the deterministic simulation results of a simplified 1DOF model equipped with a venting slot is first provided based on previous research.
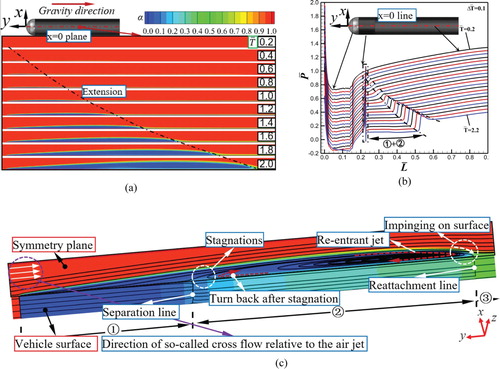
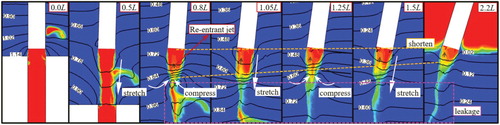
Figure demonstrates the development of the air film on the x = 0 plane and its inside pressure along the axial exterior of the vehicle as the vehicle moves (the marked number is non-dimensional time ). It shows that the size of the air film grows gradually in space, which is embodied by the radial stretching and axial extending as the vehicle moves (
rises). This process is mainly realized by the continuous injection of air, the scouring effect of the surrounding water and the air film expansion driven by a decrease in the hydrostatic pressure. As air film develops, a region with approximately even pressure (marked as
+
in Figure (b)) forms inside the air film, which mainly consists of the air phase region (marked
in Figure (c) with a large proportion of air) and the mixture phase region (marked
in Figure (c) with mixed air and water, characterized by its inside re-entrant jet) and has the same axial size as the air film. Thus, the partial hydrodynamic load and pitching moment of the vehicle are taken away because the lateral resultant force from the front and back sides of the vehicle decreases.
Figure 7. Development of air film as the vehicle moves. (a) Distribution of the phase volume fraction on the x = 0 plane of the vehicle (b) Distribution of the non-dimensional pressure
on the exterior of the vehicle along the axial direction (c) Distribution of the phase volume fraction
and streamlines on the x = 0 plane and the exterior plane of the vehicle at
.
The forming speed of the air film and its extension speed along the exterior of the vehicle determine the effect of the load reduction and trajectory improvement. Venting structures with two rows of slots benefit the fast extension of the air film according to previous research. Thus in this study, cases corresponding to the collocation points are all equipped with two rows of venting slots. The obtained results show similar basic evolution processes, as well as the flow field features of the air film compared to the cases in 1DOF motion with one slot exhausting.
4.3. Kinematic and hydrodynamic characteristics of the water-emerging process with the platform velocity as an uncertain input
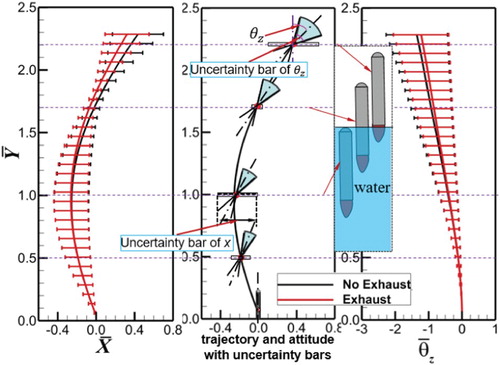
Figure shows the trajectory of a vehicle with uncertainty once its bottom leaves the tube exit, demonstrated by the mean values and uncertainty bars of non-dimensional displacement (center of gravity) in the x–y plane, as well as the relevant attitude angle (pitching angle) with or without an exhaust. The four marked lines stand for the moments that the vehicle moves: 0.5L (the bottom of the vehicle moves 0.5L away from the tube exit), 1.0L (the head of the vehicle reaches the surface of the water), 1.7L (the center of gravity of the vehicle reaches the surface of the water), and 2.2L (the bottom of the vehicle leaves the surface of the water).
Figure 8. The mean values and uncertainty bars of the non-dimensional displacement and vehicle attitude in the x-y plane as it emerges from the water with and without an exhaust.
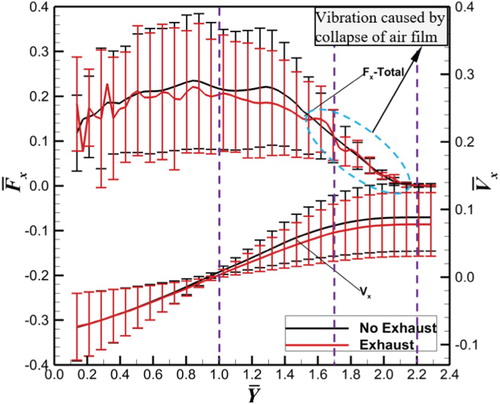
In conjunction with the horizontal velocity () shown in Figure , the horizontal motion (
) of a vehicle in the vertical water-emerging process starts with a gradually decreasing velocity. After about one vehicle-length (L) distance movement,
decreases to zero. Soon after, it gradually accelerates to a positive value as it pierces the surface of the water. Until the bottom of the vehicle leaves water, it has a constant horizontal motion. For the uncertainty bars of
, as the vehicle moves up, it exhibits an expanding-contracting-expanding pattern with a ‘spindle’ shape. By contrast, the shape of the uncertainty bars of
is similar to an ‘hourglass’, progressing a half cycle ahead of
. In fact, there is some relationship between the displacement and the velocity. That is, when the vehicle exits from the launch tube carrying a negative
with uncertainty, the uncertainty of
persistently increases. When the mean value and the uncertainty of
are weakened to zero driven by the hydrodynamic resistance after about a 1.0L distance movement, the uncertainty of
yields a maximum value. Soon after the vehicle accelerates along the positive x-axis with an increasing uncertainty, and the uncertainty bars of
begin to decrease because the previous uncertainty value is produced by the negative motion of the x-axis. Then, the uncertainty of
contracts to zero when the center of gravity of the vehicle reaches the surface of the water and continuously increases due to the uncertainty from the positive motion. When the vehicle leaves the water, the uncertainty of
persistently increases with a near constant velocity.
Figure 9. The mean values and uncertainty bars of the horizontal force and velocity of a vehicle as it emerges from the water with and without an exhaust.
The value of the attitude angle without an exhaust presents a simple continuous increasing mode with the uncertainty bars significantly enlarged. Thus, by combining the displacement and pitching angle of the vehicle, its trajectory and attitude with uncertainty bars can be demonstrated using the schematic shown in Figure . (The trace (solid line) and the central axis of the sector (dash-dotted line) denote the mean values for the displacement and attitude angles with the width of the rectangle and the angle of the sector as the uncertainty bars of the displacement and attitude angle, respectively).
When the vehicle moves with the exhaust, within approximately one vehicle-length (L) distance, the trace, attitude and their uncertainty bars are similar to those of the cases without exhaust. This is because the air film during this time has not become sufficiently strong to resist the surrounding water (the size of the air film is similar to the results of the 1DOF case before ). As the vehicle moves, the air film gradually develops with its working effect becoming enhanced, while the horizontal motion and attitude angle are both continuously weakened with their uncertainty bars significantly diminished.
To account for the features of the mean values and uncertainty bars in the horizontal motion, Figure demonstrates the statistical results of the parameters involving the horizontal force and velocity. As the vehicle moves through the water layer from the launch depth, the horizontal force () maintains a positive value and gradually tends toward zero when piercing the water layer. This is the key factor that continuously drives the acceleration of
along the positive x-axis. For the uncertainty of
, its initial value is large, which primarily comes from the water resistance caused by an uncertain initial platform velocity. As the attitude of the vehicle increases, the uncertainty of
tends to be enhanced. Note that the continuous high-level positive value of the uncertainty of
results in the vanishing of negative
and its uncertainty, changing it to a positive value. Compared with the case without an exhaust, the horizontal force and velocity of the vehicle with an exhaust are reduced because of the existence of the air film, especially when the air film is well-developed after a distance of approximately 1.0L. The weakened uncertainty is a significant advantage for the hydrodynamic load and trajectory robustness of the vehicle.
In general, the acceleration of the vehicle in the launch tube to a certain vertical velocity is mainly driven by the compressed gas inside. During the process of vertical motion and exiting from the water, the vehicle also requires the driving force from the pushing effect of the bubble attached to its bottom. The mean values of bottom force without an exhaust are shown in Figure . The developing process is divided into three parts according to the special developing process of trail bubbles, which is obtained from the deterministic results (when the platform velocity is Vsub) in Figure . First, when the bottom of the vehicle departs the tube exit with the gas supply stopped, the gas column, which is connected to the bottom of the vehicle and the launch tube, begins to stretch with the radial size ‘necking’ and the inside pressure decompressing (0.0L to 0.5L). As a result, the bottom force of the vehicle declines (marked in Figure ). With the continuous pulling effect of the vehicle, the bottom gas column breaks near the tube exit. The surrounding water then compresses the gas column to form a closure motion of the trail bubble. The closure of trail bubble gathers the surrounding water and generates a high stagnation pressure, inducing a strong re-entrant jet pointing to the interior of the trail bubble (Figures and at 0.8L). After the trail bubble forms, it starts to experience the stretching-compressing-stretching process that accompanies leaking gas and the axial length shortening dominated by the strong re-entrant jet, which matches the gradually decreasing ambient pressure. Thus, the bottom force of the vehicle experiences a decreasing process with a periodic fluctuation (marked
in Figure ). Finally, when the bottom of the vehicle begins to move through the surface of the water, the attached trail bubble breaks up, and then the bottom force of the vehicle tends toward zero.
Figure 10. The mean values and uncertainty bars of the vertical force and velocity of a vehicle as it emerges from the water with and without exhaust.
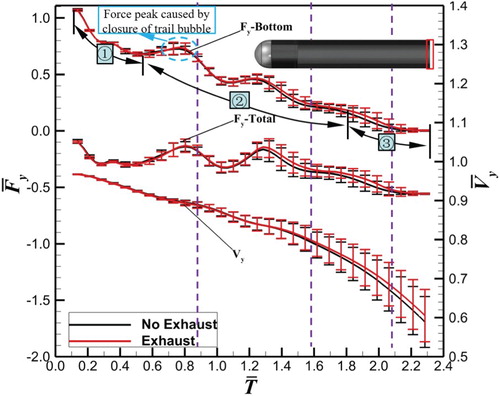
Figure 11. Evolution of the trail bubble when the platform moves with a Vsub velocity, and the vehicle is without an exhaust.
With regard to the uncertainty bars of the bottom force, a narrow range is presented in stage due to the low attitude angle at this time. Soon after, it expands when the first high-pressure peak comes, and then goes through a multiple contraction-expansion process with a fluctuating mean value. This phenomenon can be accounted for through the re-entrant-jet-induced leakage process of the trail bubble. Comparing the cases with or without exhaust, their statistical bottom force presented by mean values and uncertainty bars show a similar evolution process and fluctuation amplitude. Except for the moment when vehicle moves approximately 1.2L, the bottom force with the exhaust yields a relative higher value for the vertical velocity, which is advantageous for the fast water exiting the vehicle.
The attitude angle and angular velocity are the key parameters that determine the stability of the subsequent motion of the vehicle after it leaves the surface of the water. Thus, Figure demonstrates the variation in the pitching moment and angular velocity with the mean values and uncertainty bars. After the vehicle leaves the launch tube, its angular velocity continuously increases. Because the rotation of the vehicle can weaken the partial attacked angle of the vehicle, especially for the head and trail parts (a detail schematic is drawn in Figure (b)), the angular acceleration gradually decreases during this period. When the vehicle starts piercing the surface of the water, an unloading of the partial exterior of the vehicle reduces the pitching moment. Even a positive one (righting moment) is generated when the center of gravity tends to reach the water’s surface. At last the angular velocity of vehicle obtains a constant value to leave the water when the hydrodynamic force unloads. For the uncertainty bars of the angular velocity, they become wider under the effect of a large uncertainty of the pitching moment. When the vehicle head begins to pass through the surface of the water, uncertainty of pitching moment tends toward zero, leaving little change in the uncertainty bars of the angular velocity. Within the entire vertically moving process of the vehicle, the uncertainty bars of the angular velocity are extremely large, which seems fatal for the attitude robustness of the vehicle. This indicates that the attitude angle scatter of the vehicle is quite sensitive to the uncertainty of the platform velocity, and implementing an effective flow control method is extremely necessary.
Figure 12. (a) The mean values and uncertainty bars of the pitching moment and the angular velocity of the vehicle as it emerges from the water with or without an exhaust (b) Schematic of the local attack angle due to the rotation of the vehicle.
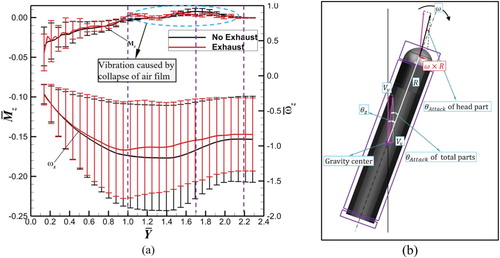
When the vehicle moves equipped with exhaust facilities, the angular velocity is improved, with the mean values decreasing and the uncertainty bars narrowing. This improvement is mainly realized through a reduction of the pitching moment and its uncertainty offered by the air film. The effect seems to be especially apparent when the air film has fully developed after the vehicle moves a distance of 1.0L. What should be noted is that the air film will experience a collapse process when it is exposed to the air, generating some vibration to the horizontal force and pitching moment of the vehicle (marked in Figures and (a)). Since the radial thickness of the air film is thinner than the traditional ventilated cavity, a relatively high inside pressure is generated. The disturbance caused by the use of the pressure-equalizing technique is small.
4.4. Surrounding flow field characteristics of a vehicle with the platform velocity as the uncertain input
The previous analysis highlighted the features of the kinematics and dynamics of the vehicle for its water-emerging process with or without exhaust. This is actually the interaction resulting between the motion of the vehicle and variation in the flow field. Thus, this section focuses on the flow field that surrounds the vehicle with an uncertain platform velocity input.
Figure gives the mean values of the phase volume fraction () on the symmetry plane (z = 0) of a vehicle at five typical positions picked from the water-emerging process. Streamlines are drawn in the coordinate system of the vehicle using a mean velocity with a vehicle attitude corresponding to the mean value of its pitching angle. Thus, it can be determined that the evolution process of the trail bubble is similar to the deterministic results presented earlier. That is, after the vehicle has moved approximately 0.5L away from the tube exit without an exhaust, the vehicle first moves vertically with a small attitude angle and pulls the gas column to neck. Soon after the bottom gas column breaks, a strong asymmetric re-entrant jet forms and points to the interior of trail bubble. During the follow-up moving process, the trail bubble of the vehicle persistently leaks, and its axial length is shortened under the impact of the re-entrant jet. Finally, the vehicle leaves the water driven by inertia, and the trail bubble breaks.
Figure 13. The mean values of the phase volume fraction and non-dimensional pressure. (a) The vehicle without an exhaust (b) The vehicle with an exhaust.
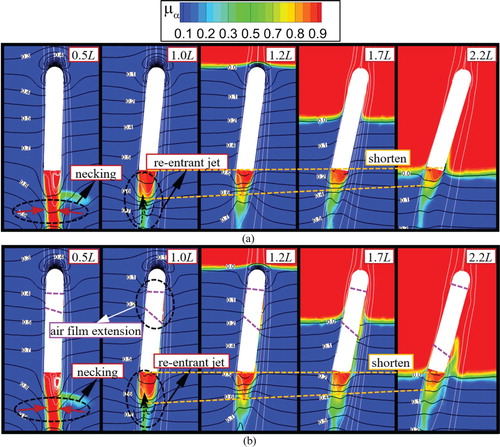
In the case with an exhaust, the water-emerging process and the evolution of the trailing bubble are similar to the no-exhaust case. These few differences mainly come from the air film. At the beginning of the process within a distance of 1L, the air film is very thin and covers a small area, which has little effect on the motion of the vehicle. As the vehicle moves, the air film gradually grows, especially for the back sides due to its low ambient pressure. After its full development, which is strong enough to resist the surrounding water and change the distribution of pressure on the exterior of the vehicle, the motion and rotation of the vehicle are improved. Note that when the venting slot pierces the surface of the water, the air film breaks up with the surrounding water striking the exterior of the vehicle, so some vibration is brought to the hydrodynamic force and moment of the vehicle.
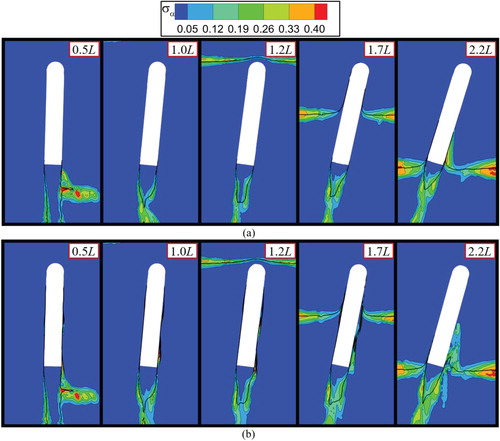
Figure gives the standard deviations distribution for the phase volume fraction () as the vehicle moves. Related to the distribution of the mean phase volume fraction (
), regions where a large uncertainty is yielded are mainly concentrated on the air–water interface, for example on both sides of the trail gas column, the closure region of the trail bubble and the air film. The large value near the gas column within a moving distance of approximately 0.5L of the vehicle is primarily caused by the uncertain scouring level of the water induced by different platform velocities. While the high value at its back side is from the uncertain gathering effect of the head bubble (it first covers the vehicle head before the launch marked in Figure (a)), which may influence the amount of air that is carried by trail bubble. The large standard deviation near the air–water interface of the trail bubble is mainly produced by the motion of the re-entrant jet with large uncertainty in size and strength. The large value near the trail of the air film is attributed to its uncertain extending speed.
Figure 14. Standard deviation of the phase volume fraction . (a) The vehicle with an exhaust (b) The vehicle without an exhaust.
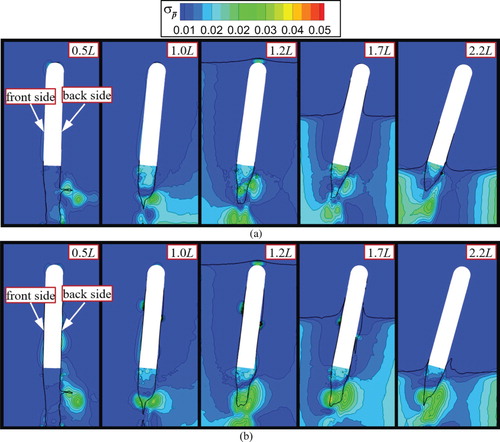
In this part, a statistics discussion is conducted for non-dimensional pressure (), which explains the features of the hydrodynamic load and moment. Figure denotes the distribution of the standard deviation of
on the symmetry plane of the vehicle (z = 0 plane) for cases with or without exhaust. Regions where the air film yields a large value for the standard deviation of
, such as the closure regions of the trail bubble and the air film (in the cases with exhaust) correspond to the results on the phase volume fraction. The large value in the closure region of the trail bubble mainly comes from the unsteady stretching-compressing mode with the re-entrant jet impact. At the same time, the uncertainty of
inside the trail bubble also yields a certain value. The large value of the standard deviation in the closure regions of the air film is the result of the uncertain extension speed of the air film, because the film tail exists with a stagnant high pressure.
Figure 15. The standard deviation of the non-dimensional pressure . (a) The vehicle without an exhaust (b) The vehicle with an exhaust.
For quantitatively exhibiting the hydrodynamic load of the vehicle in its water-emerging process, the statistical parameters of on both sides (front and back) of the exterior of the vehicle are provided in Figure . Similar to results obtained under the deterministic condition, the mean values of
without an exhaust present a significant correlation to the local profile of the exterior of the vehicle as the axial position decreases. What is of interest here is that the pressure on the front side of the vehicle always obtains a greater value compared with the value on the back side before the partial exterior of the vehicle pierces the surface of the water. This is caused by the strong stagnation of fluid on the front side, which forms the positive horizontal force and negative pitching moment mentioned earlier. For the mean values of
with the exhaust, most parts present similar features with the 1DOF results shown in Figure (b), except for the front parts, which yield a relative high value due to the stagnation of water. More remarkably, the pressure-equalizing region, which starts at the venting slot and ends at the film tail, yields an almost equal internal pressure of the air film on the front side and back side of the vehicle. It is the primary factor that weakens the horizontal load and the mean attitude angle of the vehicle.
Figure 16. The mean values and uncertainty bars of the non-dimensional pressure on the front and back sides of the exterior of the vehicle with or without an exhaust.
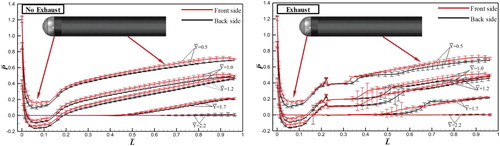
As for the uncertainty bars of along the axial direction of the vehicle, a case without an exhaust obtains a high value on the top. After a weak shrinking when the position passes the head parts, the uncertainty bar presents an increasing mode on the cylinder part as the axial position tends towards the bottom of the vehicle. Additionally, the front side always yields larger uncertainty bars compared to those obtained by the back side. This is the result of the uncertain horizontal stagnation of the water by the uncertain platform velocity input, which caused the large uncertainty of the horizontal force, as well as pitching moment. When the vehicle emerges from the water with an exhaust, the uncertainty within the pressure-equalizing region nearly tends toward zero on both the front and back parts of the vehicle. This means that the uncertainty of the pressure inside the air film is less sensitive to the uncertain input of the platform velocity and has improved the robustness of the local hydrodynamic load and pitching moment. Note that the uncertainty bars of
obtain a large value near the closure position of the ‘pressure-equalizing’ region, especially on the front side, which corresponds to the high standard deviations of
and
at the film tail mentioned above.
5. Conclusion
By adopting the NSSCM, this study built a three-order NIPC response model to investigate the performance of a pressure-equalizing exhaust on the trajectory and attitude robustness improvement while considering the uncertain input of the platform velocity. The sample space involves 38 collocation points (19 for cases without an exhaust and 19 for cases with an exhaust), which are obtained from the simulation results of the water-emerging processes (3DOF motion). The results with simple 1DOF motion, which denotes the evolution process of the air film, are also provided. The conclusions are given as follow.
As the vehicle gradually turns from the moving direction of the platform to the opposite direction with the attitude angle continuously rising, the uncertainty bars of the horizontal displacement with or without an exhaust both exhibit an expanding-contracting-expanding pattern with a ‘spindle’ shape. By contrast, the horizontal velocity presents an ‘hourglass’ shape in the vertical water-emerging process, progressing a half cycle earlier in the contracting-expanding mode.
The horizontal velocity and pitching angular velocity of the vehicle during the water-emerging process are quite sensitive to the uncertainty in the platform velocity. Their large uncertainty mainly propagates from the horizontal force and pitching moment and will statistically worsen the trajectory and attitude of the vehicle.
The implementation of the exhaust during the water-emerging process can weaken the horizontal motion and pitching rotation of the vehicle, as well as their uncertainty. This is attributed to the generated pressure-equalizing region inside the air film with a low uncertainty. To meet the demand of robustness in the water-emerging process of the vehicle, the exhaust is urgently needed.
A limitation of this study is that only three degrees of freedom are released, and only one stochastic variable is involved. In future work, motion with six degrees of freedom will be released and more stochastic variables will be considered. Additionally, it would be valuable to conduct a sensitivity analysis of the response values for these stochastic variables. To avoid generating a large number of simulation cases, a more advanced collocation method needs to be adopted to construct the response surface model with fewer collocation points.
Nomenclature
| d | = | width of venting slots |
| D | = | the diameter of the vehicle |
| l1 | = | distance from vehicle’s head to axial position of the first venting slot |
| l2 | = | distance from vehicle’s head to axial position of the first venting slot |
| = | The non-dimensional horizontal force that vehicle suffers | |
| = | The non-dimensional vertical force that vehicle suffers | |
| L | = | the length of the vehicle |
| = | the non-dimensional position along the axial direction of vehicle | |
| = | the non-dimensional pitching moment | |
| = | the non-dimensional pressure | |
| = | the velocity when bottom of vehicle leaves launch tube | |
| = | the non-dimensional velocity of platform | |
| = | the non-dimensional velocity of vehicle along x-axis | |
| = | the non-dimensional velocity of vehicle along y-axis | |
| = | the non-dimensional coordinate of X | |
| = | the distance from a certain point on vehicle’s exterior to its head | |
| = | the non-dimensional coordinate of Y | |
| = | phase volume fraction | |
| = | the pitching angle when gravity center of vehicle leaves water surface | |
| = | the non-dimensional parameter of pitching angle | |
| = | the density of water phase | |
| = | the pitching angular velocity when gravity center of vehicle leaves water surface | |
| = | the non-dimensional parameter of pitching angular velocity |
Disclosure statement
No potential conflict of interest was reported by the authors.
Related Research Data
References
- Ardabili, S. F., Najafi, B., Shamshirband, S., Bidgoli, B. M., Deo, R. C., & Chau, K.-W. (2018). Computational intelligence approach for modeling hydrogen production: A review. Engineering Applications of Computational Fluid Mechanics, 12(1), 438–458. doi: 10.1080/19942060.2018.1452296
- Bao, W. C., Quan, X. B., & Wei, H. P. (2014). [Numerical simulation on the flow dynamics of underwater vehicle launching with exhaust]. Missiles and Space Vehicles, 5, 14–18.
- Chen, F., Ma, G.-H., Yu, J.-Y., & Jiang, S. (2016). Effect of exhaust angle on evolutionary and flow characteristics of pressure-equalizing film on surface of underwater vehicle. Journal of Ship Mechanics, 20(12), 1495–1512.
- Congedo, P. M., Goncalves, E., & Rodio, M. G. (2015). About the uncertainty quantification of turbulence and cavitation models in cavitating flows simulations. European Journal of Mechanics – B/Fluids, 53, 190–204. doi: 10.1016/j.euromechflu.2015.05.005
- Fisher, J., & Bhattacharya, R. (2011). Optimal trajectory generation with probabilistic system uncertainty using polynomial chaos. Journal of Dynamic Systems, Measurement, and Control, 133(1), 014501. doi: 10.1115/1.4002705
- Fotovatikhah, F., Herrera, M., Shamshirband, S., Chau, K.-W., Ardabili, S. F., & Piran, M. J. (2018). Survey of computational intelligence as basis to big flood management: Challenges, research directions and future work. Engineering Applications of Computational Fluid Mechanics, 12(1), 411–437. doi: 10.1080/19942060.2018.1448896
- Isukapalli, S. S., Balakrishnan, S., & Georgopoulos, P. G. (2004, December). Computationally efficient uncertainty propagation and reduction using the stochastic response surface method. 43rd IEEE Conference on Decision and Control. CDC. (Vol. 2, pp. 2237–2243). IEEE.
- Levy, L. J. (2005). The systems analysis, test, and evaluation of strategic systems. Johns Hopkins APL Technical Digest, 26(4), 438–442.
- Luo, X., Yang, F., Zeng, X., Tao, J., Zhu, H., & Cai, W. (2009). A modified nested sparse grid based adaptive stochastic collocation method for statistical static timing analysis. IEICE Transactions on Fundamentals of Electronics, Communications and Computer Sciences, 92(12), 3024–3034. doi: 10.1587/transfun.E92.A.3024
- Ma, G., Chen, F., Yu, J., & Liu, H. (2018). Flow mechanism and characteristics of pressure-equalizing film along the surface of a moving underwater vehicle. Journal of Fluids Engineering, 140(4), 041103. doi: 10.1115/1.4038394
- Ma, G., Chen, F., Yu, J., Song, Y., & Mu, Z. (2018). Effect of pressure-equalizing film on hydrodynamic characteristics and trajectory stability of an underwater vehicle with injection through one or two rows of venting holes. Journal of Fluids Engineering, 140(9), 091103. doi: 10.1115/1.4039519
- Ma, G., Chen, F., Yu, J., & Wang, K. (2019). Numerical investigation of trajectory and attitude robustness of an underwater vehicle considering the uncertainty of platform velocity and yaw angle. Journal of Fluids Engineering, 141(2), 021106. doi: 10.1115/1.4040930
- Mariotti, A., Siconolfi, L., & Salvetti, M. V. (2017). Stochastic sensitivity analysis of large-eddy simulation predictions of the flow around a 5:1 rectangular cylinder. European Journal of Mechanics – B/Fluids, 62, 149–165. doi: 10.1016/j.euromechflu.2016.12.008
- Mazzoni, C. M., Ahlfeld, R., Rosic, B., & Montomoli, F. (2018). Uncertainty quantification of leakages in a multistage simulation and comparison with experiments. Journal of Fluids Engineering, 140(2), 021110. doi: 10.1115/1.4037983
- Mnasri, C., Hafsia, Z., Omri, M., & Maalel, K. (2010). A moving grid model for simulation of free surface behavior induced by horizontal cylinders exit and entry. Engineering Applications of Computational Fluid Mechanics, 4(2), 260–275. doi: 10.1080/19942060.2010.11015315
- Najm, H. N. (2009). Uncertainty quantification and polynomial chaos techniques in computational fluid dynamics. Annual Review of Fluid Mechanics, 41, 35–52. doi: 10.1146/annurev.fluid.010908.165248
- Patterson, T. N. L. (1968). The optimum addition of points to quadrature formulae. Mathematics of Computation, 22(104), 847–847. doi: 10.1090/S0025-5718-68-99866-9
- Qi, D., Feng, J., Xu, B., Zhang, J., & Li, Y. (2016). Investigation of water entry impact forces on airborne-launched AUVs. Engineering Applications of Computational Fluid Mechanics, 10(1), 473–484. doi: 10.1080/19942060.2016.1202864
- Qin, Y. (2014). Effect of gas exhausting on hydrodynamic characteristic of underwater vehicle considering wave (Master’s thesis). Retrieved from China National Knowledge Infrastructure.
- Rodio, M. G., Abgrall, R., & Congedo, P. M. (2017, March). Numerical simulation of cavitating flows under uncertainty. In Journal of physics: Conference series (Vol. 821, No. 1, p. 012009). IOP Publishing.
- Rodio, M. G., & Congedo, P. M. (2014). Robust analysis of cavitating flows in the venturi tube. European Journal of Mechanics – B/Fluids, 44, 88–99. doi: 10.1016/j.euromechflu.2013.11.002
- Salehi, S., Raisee, M., Cervantes, M. J., & Nourbakhsh, A. (2017). The effects of inflow uncertainties on the characteristics of developing turbulent flow in rectangular pipe and asymmetric diffuser. Journal of Fluids Engineering, 139(4), 041402. doi: 10.1115/1.4035302
- Shereena, S. G., Vengadesan, S., Idichandy, V. G., & Bhattacharyya, S. K. (2013). CFD study of drag reduction in axisymmetric underwater vehicles using air jets. Engineering Applications of Computational Fluid Mechanics, 7(2), 193–209. doi: 10.1080/19942060.2013.11015464
- Xie, Q. M. (2014). Study on uncertainty of occupant evacuation time in fire safety design (Doctoral dissertation). Retrieved from China National Knowledge Infrastructure.
- Xiong, F., Xiong, Y., & Xue, B. (2015). Trajectory optimization under uncertainty based on polynomial chaos expansion. AIAA guidance, navigation, and control conference (p. 1761), Kissimmee, FL.
- Xiong, F. F, Yang, S. X., Liu, Y., & Chen, S. S. (2015).
 [Engineering probabilistic uncertainty analysis method] (pp. 121–167). Beijing, BJ: Science Press.
 - Zhang, X., & Wang, C. (2015). Research on underwater vehicle based on multiphase flow control. MATEC web of conferences (Vol. 25, p. 03004). EDP Sciences, Kuala Lumpur, Malaysia.
- Zhao, K. (2014). Complex aerodynamic optimization and robust design method based on computational fluid dynamics (Doctoral dissertation). Retrieved from China National Knowledge Infrastructure.