
 ?Mathematical formulae have been encoded as MathML and are displayed in this HTML version using MathJax in order to improve their display. Uncheck the box to turn MathJax off. This feature requires Javascript. Click on a formula to zoom.
Abstract
Slurry pipeline transport, which is widely used in dredging, is an important method of solid material transportation. The internal structure information of flows with different shaped particles must be obtained to investigate the effects of different particle shapes on the efficiency and flow characteristics of slurry transport. To solve this problem, a numerical method which couples the computational fluid dynamics (CFD) and the discrete element method (DEM) is established in this study. Using the coupled CFD-DEM, the internal flow structure for spherical, square platens and line-shaped coarse particles is studied, and the working conditions under which clogging of non-spherical particles occurs are explored. The flow states of different shaped particles at velocities of 2, 4.1 and 8 ms−1 are qualitatively analyzed in a horizontal pipeline system within the diameter of 100 mm, and quantitative analyses of the concentration distribution in different flow regimes are performed. The study describes the particle flow characteristics under clogging conditions based on the flow regime transition and concentration distribution. Abnormal transport is analyzed using qualitative and quantitative indications. In addition, along with the particle force and robustness of transport, the conditions for stable transport are discussed.
Nomenclature
| = | Solid concentration | |
| = | Modified drag coefficient | |
| = | Drag force | |
| = | Saffman lift force | |
| = | Magnus lift force | |
| = | Particle–wall forces | |
| = | Particle–particle contact forces | |
| = | Turbulent kinetic energy | |
| = | Turbulent kinetic energy | |
| = | Gravitational acceleration | |
| = | Moment of inertia | |
| Mt | = | Turbulent Mach number |
| Mp | = | Net torque due to the contact force |
| = | Particle mass | |
| = | Liquid density | |
| = | Stress tensor | |
| = | Thermal expansion coefficient | |
| = | Number of particle per unit volume | |
| = | Pressure | |
| = | Turbulent Prandtl number | |
| = | Effect of compressible turbulent pulsatile expansion on the total dissipation rate | |
| = | Liquid volume fraction | |
| = | Porosity of the particles | |
| = | Rotational speed | |
| = | Prandtl numbers corresponding to the turbulent kinetic energy | |
| = | Prandtl numbers corresponding to the turbulent dissipation rate | |
| = | Velocity of square platens particles | |
| = | Velocity of line-shaped particles | |
| = | Velocity of spherical particles | |
| Rep | = | Reynolds number of the flow |
| Φ, Φ⊥ | = | Characterization coefficients of non-spherical particles |
| = | Liquid velocity |
Introduction
Pipeline hydraulic transportation, which involves the use of a liquid (usually water) as a carrier to achieve powder material transportation through a sealed pipeline conveyance system, is widely used in the chemical industry and ocean engineering. This transportation has high efficiency, a large capacity, strong adaptability and little impact on the environment (Miedema, Citation2015). In real works, transport materials include not only hard particles of varying sizes, such as rock and soil, but also industrial waste with different shapes. Therefore, to avoid clogging and achieve stable conveyance of particles, investigating the flow characteristics of particles with different shapes and selecting appropriate operating conditions are necessary.
In the field of pipeline transportation, many theoretical and experimental studies have been carried out by previous research studies (Lun, Savage, Jeffrey, & Chepurniy, Citation1984; Televantos, Shook, Carleton, & Streat, Citation2010; Wasp, Kenny, & Gandhi, Citation1977), which were mainly based on the semi-empirical models and experiment data, especially explored the characteristics of transport resistance and proposed a series of theoretical models for slurry pipeline transportation. The theoretical studies about pipeline transport laid the foundation for further investigation. However, most theoretical models focus on a single flow state for spherical particles rather than the changes in the flow state for coarse particles are not considered. Vlasák, Chára, Krupiěka, and Konfrět (Citation2014) studied the flow transition of spherical coarse particles and explored the clogging conditions based on experimental data. Miedema (Citation2016) theoretically analyzed particle transport according to the particle size distribution, dividing the flow into five patterns and integrating five independent models into the DHLLDV framework, which is a theoretical model for defining the flow transition process and critical settling velocity of particles under different sizes during transport. Although particles with different shapes were rarely involved, these studies more fully considered the interphase interaction and better described the changes in the flow state during conveyance, which can provide a reference for the research on the transport of different shaped particles.
The transport of different shaped particles is complicated. The theoretical model with a certain drag correction coefficient was used to discover the influences of particles with different shapes on the transport head losses (Miedema & Ramsdell, Citation2016). However, fully describing the transport situation using only a theoretical model or experimental research is difficult. Instead, numerical simulation techniques based on the computer, such as the discrete element method (DEM) based on the Lagrangian approach, which was first proposed by Cundall and Strack (Cundall & Strack, Citation1979), have been widely used in the study of particle dynamics (Antony, Citation2007; Cleary, Citation2009, Citation2010, Citation2013; Herrmann & Luding, Citation1998; Müller et al., Citation2009; Tsuji, Citation2000). The DEM not only enables efficient formulations for different shaped particles, including single-particle methods and the composite sphere method (Das et al., Citation2011; Kruggel-Emden & Elskamp, Citation2014; Lu, Third, & Müller, Citation2012; Wang, Park, & Fu, Citation2007) but also provides algorithms for the efficient detection of contacts and the determination of contact parameters to ensure accuracy (Fraige, Langston, & Chen, Citation2008; Lu, Third, & Müller, Citation2015). In addition, the Computational Fluid Dynamics (CFD) method, which has been proved to capture flow information accurately in many areas of research, is ideal for simulating the fluid field in the transport pipe. Mou, He, Zhao, and Chau (Citation2017) used CFD to ascertain wind pressure distributions on and around various square platens tall buildings. Eivaz (Akbarian et al., Citation2018) investigated a dual-fueled constant-speed engine based on CFD, and the results showed good agreements with the experimental results under cylinder pressure. Ramezanizadeh, Alhuyi Nazari, Ahmadi, and Chau (Citation2019) designed a new heat exchanger that was compared with a copper heat exchanger through the CFD method. Ghalandari, Mirzadeh Koohshahi, Mohamadian, Shamshirband, and Chau (Citation2019) numerically modeled the flow of Ag/water nanofluid in the root canal based on the precise description of the CFD method. In addition, Faizollahzadeh Ardabili et al. (Citation2018) summed up the application of the CFD method in hydrogen production and conducted a qualitative analysis of its accuracy. In general, the studies involved CFD method illustrate that fluid simulation has an outstanding performance in the field of fluids research.
The DEM combined with a finite volume computational fluid dynamics solver, called the DEM-CFD model, has been used intensively to simulate the solid–liquid two-phase flow systems (Deen, Annaland, Hoef, & Kuipers, Citation2007). This method is an alternative Euler–Lagrange simulation; the liquid term is solved by the Navier–Stokes (NS) equation, while the particles are described as discrete entities. The motion information of each particle in the field can be obtained. Therefore, the collision and deposition information of particles can be fully captured (Capecelatro & Desjardins, Citation2013a, Citation2013b; Patankar & Joseph, Citation2001; Uzi & Levy, Citation2018). Regarding the transport of different shaped particles, Hilton and Cleary (Citation2011) first explored the effect of different shaped particles modeled by the super-quadric equation on powder material pneumatic conveyance using the CFD-DEM and found that the shape of the particles is critical to the transition of the transport flow state. As the pressure gradient increases, the flow mode of spherical particles undergoes a fixed bed flow regime to sheared bed transition, and the mode finally becomes slug flow, while the difference of non-spherical particles flow is not obvious. Similarly, Kuang, Zou, Pan, and Yu (Citation2012) found that as the degree of sphericity gradually decreases, spherical and near-spherical particles exhibit slug flow, whereas non-spherical particles instead transition to dilute flow at high gas velocities. This phenomenon mainly occurs because non-spherical particles are quite different from spherical particles in terms of their friction coefficient and restitution coefficient, which are the key factors in the transition of flow modes (Fraige & Langston, Citation2006; Li, Kuang, Pan, & Yu, Citation2014). Kruggel-Emden and Oschmann (Citation2014) carried out numerical simulations to study the pneumatic transport of non-spherical particles (cubes, octahedrons, pyramids, plates and icosahedrons) in an elbow pipe using the CFD-DEM framework, which has been validated against empirical models. The changes in the particle/particle force, particle/wall force and particle/fluid force are highly dependent on the particle shape. In addition, the CFD-DEM method is widely used in the research of fluidized beds of binary mixtures. Xu, Luo, Zhao, Fan, and Cen (Citation2018) used the CFD-DEM method coupled with a particle-scale erosion model to perform a multi-scale analysis of the erosion of the immersed pipes in a three-dimensional gas–solid fluidized bed. Further, Wang, Luo, Hu, and Fan (Citation2018) used the CFD-DEM method to conduct a high-fidelity simulation of the full-loop circulating fluidized bed and comprehensively explored the heat transfer, erosion characteristics and the impact of superficial gas velocity In addition, Ma, Zhao, and Cheng (Citation2019) proposed a steady and efficient CFD-DEM algorithm which described the rod-shaped particles by the super-ellipsoid model to solve the flow characteristics in the fluidized bed reactors with complex geometry. Abbaszadeh Molaei, Yu, and Zhou (Citation2019) employed the CFD-DEM approach to perform a numerical analysis of the effect of particle shape on the particle mixing and segregation phenomenon in liquid fluidization systems. In another field, Liu, Tang, and Li (Citation2017) conducted experiments and studied the flow features of refined oil and impurity particles in the pipe system using the CFD-DEM model. In addition, he considered parameters that may affect the deposition characteristics of impurities, such as particle shapes.
In view of previous research, the particle shape has a large influence on the flow state, force and sedimentation characteristics of the transport. Arguably, most studies have focused on gas–solid two phases, while theoretical investigations of the hydraulic transport of non-spherical particles are lacking, as non-spherical particles are difficult to construct, and the solid–liquid coupling processes are complicated. Therefore, this study analyzes the flow characteristics and sediment characteristics of non-spherical particle pipeline transport using the coupled CFD-DEM combined with actual conveyance conditions. Among them, the changes in the shape of the particles are achieved by a method in which a plurality of spherical units fills the inner cut ball elements. This study also discusses the mechanism of clogging, which strengthens the theoretical support for non-spherical particle pipeline hydraulic transport and helps the practical engineering application.
Methodology
To capture the dynamic properties and transition process of the flow state accurately, the CFD-DEM is used to analyze slurry pipeline transport of non-spherical particles. The carrier water is considered as a continuous field, and the non-spherical particles are regarded as the discrete phase.
In the CFD-DEM coupled process, the liquid satisfies the continuity equation and the corrected momentum conservation as follows:
(1)
(1)
(2)
(2) where ρ is the local density of the liquid,
and
are the local velocities, p and g refer to the pressure, and the gravitational acceleration. In addition,
is the stress tensor,
is the volume fraction of liquid phase,
is the total particles number in each unit volume, moreover,
,
and
refer to the drag forces applied to each particle, the Saffman lift force and the Magnus lift force, respectively (Hussainov, Kartushinsky, Mulgi, & Rudi, Citation1996; Saffman, Citation1962).
As shown below, the k-ϵ standard turbulence model is used to describe the turbulence in the pipe.
(3)
(3)
(4)
(4) where
,
,
,
, and
. Parameter Gk refers to the turbulent kinetic energy and Gb refers to the buoyancy turbulent kinetic energy;
is the total dissipation rate affected by compressible turbulent pulsation expansion;
are empirical constants with default values of 1.44, 1.92 and 0.09, respectively. The default values of
and
which are the turbulent coefficient are 1.0 and 1.3 and
takes a constant value of 0.85.
For the particle phase, the turbulent diffusion and the slip velocity due to the phase initial momentum difference are important. Therefore, the DEM is used for simulation, and the Euler model is used for the coupled interface. A softball model is carried out to evaluate particles, and the model is shown by Newton's equations for translational and rotational motion:
(5)
(5)
(6)
(6) where
refer to the mass of particles, translational velocity, moment of inertia and rotational velocity;
and
are the contact forces of particle-to-wall and particle-to-particle; and
is the net torque. The abovementioned terms have already been described in detail in previous studies (Chu, Wang, Xu, Chen, & Yu, Citation2011; Karimi & Dehkordi, Citation2015).
The drag force model obtained by experiment data is shown as,
(7)
(7) where
refers to the local density of liquid;
is the mean diameter of each particle;
and
refer to the velocities of the liquid and particles;
is the particles porosity;
is the drag coefficient.
is the fragmental function which is related to the particle number and porosity:
(8)
(8) where
is the porosity correction factor which is caused by the particles interaction effects (Di Felice, Citation1994).
In addition, the drag coefficient used for non-spherical particles must be corrected. The following equation gives the modified drag coefficient of an isolated non-spherical particle. The coefficient has been validated experimentally (Ganser, Citation1993; Tran-Cong, Gay, & Michaelides, Citation2004).
(9)
(9) where Rep is the Reynolds number of the flow.Φ and Φ⊥ are two characterization coefficients for non-spherical particles. The former is the ratio between the surface area of the volume equivalent sphere and the actual particle surface area. The latter is the ratio between the maximum cross-sectional area of the volume equivalent sphere and the projected area of the actual particle perpendicular to the flow direction (Hölzer & Sommerfeld, Citation2008).
Simulation implementation
Solving process
The CFD-DEM coupling method is implemented to investigate the two-phase flow field. The liquid flow field is realized by the CFD method and the particle simulation is based on the DEM, while the Euler-Euler method is used for coupling. The Lagrangian method is carried to study the particles motion and distribution in DEM. The Hertz-Mindlin (no slip) model is used to describe the particle contact (Emeriault & Cambou, Citation1996) In addition, the Saffman and Magnus lift models are used for the lift model.
The enhanced wall treatment, which can effectively address the flow field near the solid wall, combined with the k-ϵ standard turbulence model is used to handle near-wall flow. This method is almost independent of the wall function and is fitted for complex fluid flows, especially in low Reynolds number. In this method, the entire fluid field is subdivided into a viscosity-affected area and a fully turbulent area. In the fully turbulent area (Reynolds number > 200), the k-ϵ model is used for solving. However, in the viscosity affected zone, the single equation model of Wolfstein is selected for solving (Wolfshtein, Citation1969).
Physical model
A circular periodic pipe with an inner diameter of 100 mm and a length to diameter ratio of 15 (L/D = 15) is defined based on the experimental data of Vlasák (Vlasák et al., Citation2014). An O-grid is established for the fluid domain using CFD-ICEM. To fully capture the spatial scale range associated with turbulence, a 15-layer exponentially growing boundary layer is established with a growth ratio of 1.2, and the height of the first layer from the wall is described as a dimensionless parameter y+ <1. After the grid independence test, the number of grids is determined to be 412k cells.
In the CFD-DEM, the solid phase mesh has no influence on the liquid phase mesh. When studying the solid phase, the time spent on the overall collision detection must be reduced and the simulation efficiency improved. Therefore, the DEM divides the simulation area into several grid elements, and the solver performs collision detection only for the units that contain two or more elements. In this study, the grid side length is specified as 3 times the particle radius to save computing resources under the premise of capturing the flow features accurately.
The average particle diameter used in the simulation is 11 mm, which is the same as the experimental data. Square platens particles and line-shaped particles, which represent the shells and steel wires in actual dredging, are established based on spherical particles. The properties of the three particles are identical except for the shape. The shape changes are achieved by using a method in which multiple spherical elements are filled into an inner cut ball. The specific parameters are shown in the Table and more details for particles in DEM are shown in Table .
Table 1. Particle parameters.
Table 2. DEM model setting parameters.
Boundary conditions
The common coarse particle flow states in slurry pipeline transport are fixed bed flow regime, sliding bed flow regime and sliding flow regime. According to the DHLLDV framework, the critical velocity for the fixed bed flow to sliding bed flow transition is 1.72 m/s, and the critical velocity for the sliding bed flow regime to sliding flow regime transition is 3.43 m/s (Miedema, Citation2016). Therefore, combining the DHLLDV and experimental results, and to better meet the actual dredging project, the simulation inlet velocities are set as 2, 4.1 and 8 m/s. Further, in this study, the transport medium consists of coarse particles; when conveying coarse particles, the flow stratification is obvious, it is difficult to form suspended sludge. In addition, the temperature pressure is set to be approximately constant in our study; thus, we consider the fluid viscosity to be a constant value. It should be pointed out that to make the flow tend to be stable as soon as possible, the line-shaped particles were set to enter the pipeline horizontally. In addition, atmospheric pressure is set as the outlet conditions for the overflow and particles outlet.
Results and discussion
Validation of the model
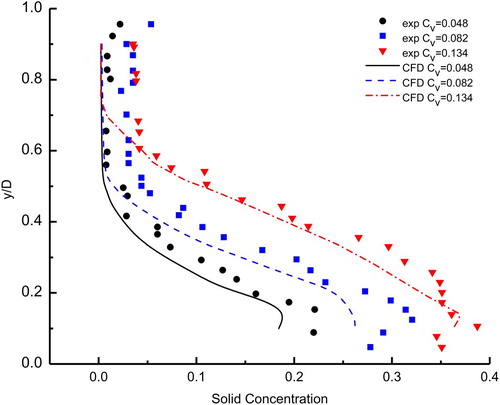
To improve the quality of the model and ensure the accuracy of the simulation, the simulation model must be verified with experimental data. In this paper, the experimental data of Vlasák et al. (Citation2014) on slurry pipeline transport are selected as the comparison object to verify the accuracy of the numerical simulation. Vlasák carried out an experimental study on the transport of coarse spherical particles (Dp = 11mm) slurry with the initial concentration of 0.048, 0.082 and 0.134 in a horizontal pipe with a length of 1.5 m and an inner diameter of 100 mm, which are the same with the simulation conditions. The results comparison between the simulations and experiments are demonstrated in Figure . As shown in Figure , the simulation data of the concentration distribution for different initial volume fractions are in great agreement with the experimental data, and the maximum error in the effective field is within 20%.
Figure 1. Comparison of experimental data and CFD-DEM simulation data. Note: Vertical concentration distribution at x=10D).
Flow characteristics
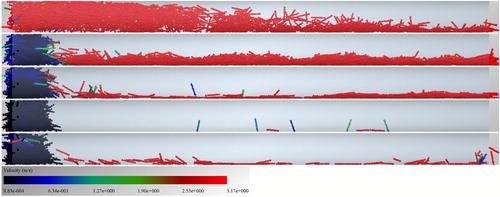
Analysis of the spherical particle flow regime
The transition of the spherical particle flow state is illustrated in Figure . The flow regime presents sliding-bed flow when the conveying velocity is 2 m/s. After the particles enter from the inlet, the velocity decreases over a short period of time, and the particles settle near the nozzle, forming a particle bed at the bottom. The particles depositing at the bottom of the pipeline have a significant velocity stratification, which decreases from top to bottom. In the sliding-bed flow state, the transport is unstable and is susceptible to external factors (Mills, Citation2004). If the pipe cannot be unblocked in time, when the transport velocity fluctuates, the clogging phenomenon will occur.
Figure 2. Spherical particle flow state (from top to bottom: 2, 4.1, 8 m/s).
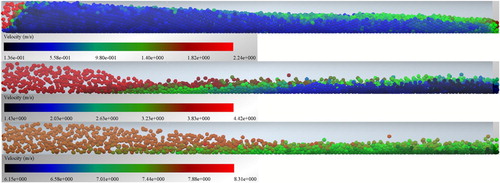
As the conveying velocity increases (4.1, 8 m/s), the flow state gradually transitions to the sliding-flow state. As the increased velocity gives the fluid a stronger ability to carry particles, the particles gradually settle in a parabolic shape, the conveying velocity is larger, and the deposition position is farther from the inlet. In addition, the velocity stratification is no longer obvious, and the transport, which is stable, has no tendency toward clogging, especially at the conveying velocity of 8 m/s.
Analysis of the square platens particle flow regime
Figure shows the transition of the square platens particle flow regime. At a velocity of 2 m/s, the flow exhibits a fixed-bed flow state. After entering from the inlet, the particles settle quickly near the nozzle and gradually accumulate to the top of the pipe until the particles fill the entire pipe section. The particle bed, which is at rest, deposits at the bottom of the pipe, and no slip velocity or significant velocity stratification occurs. In addition, the height of the particle bed is proportional to the transport amount. Therefore, as the transport time increases, the particles continue to accumulate, and clogging eventually occurs at the top of the pipeline.
Figure 3. Square platens particle flow state (from top to bottom: 2, 4.1, 8 m/s).
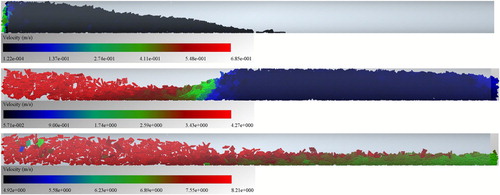
At a conveying velocity of 4.1 m/s, the square platens particles are pushed forward along the inner wall at the bottom of the initial section of the pipe, resulting in a low porosity (56%). Due to the uneven forces on the particles in the vertical and horizontal directions, the particle velocity decreases rapidly along the length of the pipe, and the flow is substantially stationary in the rear section of the pipe. As the transport amount increases, the stationary particles in the rear section gradually accumulate and move backward, eventually forming ‘sand dunes’ and filling the pipeline. When the velocity is further up to 8 m/s, material transport is achieved, as the load carrying capacity of the fluid is enhanced. In the fully developed section, the particles slide in the conveyance direction at a constant velocity, and a particle bed is stably present and propelled at a constant velocity.
Analysis of the line-shaped particle flow regime
Figure depicts the transition of the line-shaped particle flow regime. At a velocity of 2 m/s, the limited sand carrying capacity of the fluid causes the particles to begin to deposit at the inlet and eventually clog the nozzle. At this time, the line-shaped particles are present in the same fixed-bed flow state as the square platens particles. As the conveying velocity of the line-shaped particle is further increased to 4.1 m/s, similar to square platens particles, the initial fixed-bed flow is gradually converted into sliding-bed flow. In general, the reason for the change in the mode of non-spherical particle movement is the same; that is, the limited ability of the fluid to carry sand and the uneven forces in different directions cause the particles to settle.
Figure 4. Line-shaped particle flow state (from top to bottom: 2, 4.1, 8 m/s).
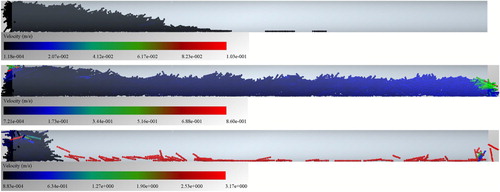
When the flow velocity is reached to 8 m/s, the transport of the line-shaped particles presents a completely different flow state. In the case of a fluid with a strong sand carrying capacity, clogging still occurs at the nozzle. In addition, no velocity stratification occurs, and a small number of particles with higher velocity are dispersed in the pipeline. At this time, the flow is not controlled by the DHLLDV framework, and other mechanisms at the nozzle cause clogging.
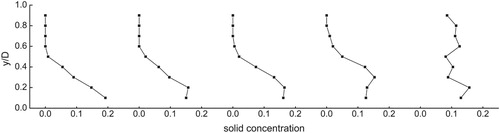
Solid concentration distribution
Figures – exhibit different trends of the solid volume concentration in the simulation results, the particle concentration is defined based on the statistical concept, that is, the percentage of the particles volume passing through the per unit volume per unit time separately covering the transport velocity (2–8 m/s) and particle shape conditions. The section of the pipe 1 m from the entrance, which is the stable flow section, is selected as the analysis surface.
Figure 5. Particle solid concentration at 2 m/s.
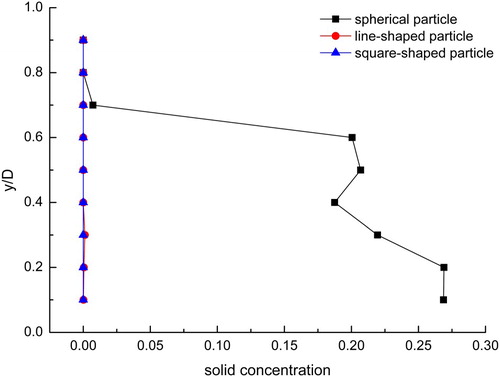
Figure 6. Particle solid concentration at 4.1 m/s.
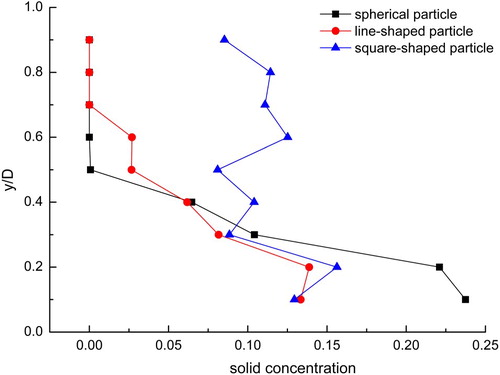
Figure 7. Particle solid concentration at 8 m/s.
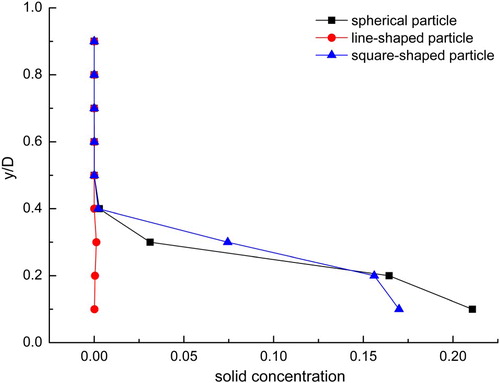
Figure shows the simulation results of different shaped particles at a certain mixture velocity (2 m/s). The spherical particle concentration increases from top to bottom in the vertical direction of the pipe, reaching a maximum (30%) near the bottom of the pipe that extends from the bottom of the pipe to y/D = 0.2. This result indicates that the sedimentation and aggregation of particles in the lower half of the pipe result in a particle bed. In addition, the low particle concentration at the top of the pipe causes the particles to continue to move slowly, which proves that sliding-bed flow is formed at this time. The line-shaped and square platens particles have a low concentration close to zero in this section, indicating that clogging has occurred before the flow has stabilized.
Figure shows the concentration profiles of different shaped particles at 4.1 m/s. The spherical particles are mainly concentrated in the lower half of the pipe. The maximum value appears at y/D = 0.1, which drops sharply in the range of y/D = 0.2∼0.5. Similarly, the line-shaped particle concentration reaches 13% at the bottom of the pipe and decreases layer by layer over the range of y/D = 0.1∼0.7, showing a gradient distribution. However, the concentration in the upper part of the pipe is high; thus, combined with the flow regime, the flow is already in the critical state of clogging at this time. The concentration of the square platens particles, which is at most 16%, is almost evenly distributed in the vertical direction. Clogging occurs because a large number of particles accumulate at the top of the pipe. In addition, the concentration fluctuates over the range of y/D = 0.3∼0.9, which shows that the square platens particles are stacked irregularly, easily causing clogging.
Figure provides the simulation results of the solid concentration distribution for the 8 m/s transport velocity. As shown in the figure, spherical particles and square platens particles concentrate at the bottom of the pipe at y/D = 0.1, and the concentration falls sharply in the range of y/D = 0.2∼0.4. Regarding the flow state, the flow is stable at this time. The line-shaped particles are special; the concentration is zero in the stable section of the pipe at high velocity, and the particles all accumulate at the nozzle.
Analysis of the clogging state
Analysis of square platens particles
To further analyze the clogging process of the squared-shaped particles, Figures and show the concentration change in the section 1 m from the inlet under the critical velocity of 4.1 m/s with the progression of time (from 1 to 5 s).
Figure 8. Time evolution of the concentration profile for square platens particles at 4.1 m/s and x = 10D.
Note: The panels represent 5 stages at 1, 2, 3, 4 and 5 s.
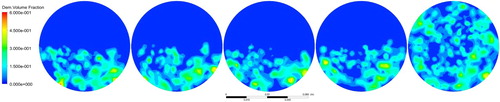
Figure 9. Time evolution of the concentration curve for square platens particles at 4.1 m/s and x = 10D.
Note: The panels represent 5 stages at 1, 2, 3, 4 and 5 s.
As shown in the figures, the concentration, which is largest at the bottom, decreases from the bottom to the top over the range of y/D = 0.1∼0.5 when the particles enter the pipe. This result indicates that due to the accumulation effect and the influence of the particle shape, a clogging tendency occurs at the beginning. As time progresses, the concentration range continues to expand, and the maximum point moves upward. During the flow progress, most particles move in the axial direction, but some of the particles are stacked layer by layer. At 5 s, the concentration is evenly distributed in the range of y/D = 0∼1, indicating that the section is filled with particles, and the pipe is completely blocked. In addition, in the incomplete clogging stage, the position of the concentration maximum point, whose value continues to decrease slightly, appears to move upward with time. One of the reasons for this phenomenon is that the square platens particles in the layer-by-layer stacking process gradually transition from being carried by the liquid to experiencing particle interactions. Moreover, the particles obtain an upward velocity due to the lift effect being greater than the effective gravity (Marchioli, Giusti, Salvetti, & Soldati, Citation2003).
Analysis of line-shaped particles
In the case of high-velocity transport, surprisingly, the conveyance of line-shaped particles results in clogging at the nozzle, which is worth exploring. Figure depicts the changes in the flow state of line-shaped particles in the transport process over time.
Figure 10. Flow process of line-shaped particles (from 1 to 5 s).
In the initial transport section of the pipe, most of the particles are subjected to a liquid-carrying action that induces flow with a high velocity, with the concentration being the largest at the inlet and gradually decreasing toward the outlet. As time progresses, the concentration at the entrance increases, and the velocity decreases. The number of particles successfully transported gradually decreases, demonstrating that the clogging phenomenon, which exhibits a cliff-type mode, has appeared. In addition, most of the stationary particles are concentrated in the clogging section at the entrance, proving that the particles have lost most of the kinetic energy when entering the pipe. Because of the clogging feature, some of the particles intersect, forming a reticulated structure stuck at the entrance when they enter the pipe. The clogging arises due to other entering particles being intercepted or entangled by the reticulated structure. During the period of 2–5 s, a few particles still flow with a high velocity under the clogging condition. Gaps still exist that allow particles to pass through, indicating that the clogging is not caused by particle close packing, further confirming that the mechanism of clogging is interception.
Analysis of mixed particles
As shown in Figures and , to verify the clogging situation in an actual project, the transport of a mixture of the three different shaped particles at 4.1 m/s is selected for analysis.
Figure 11. Flow process of mixed particles for v = 4.1 m/s (from 1 to 5 s).
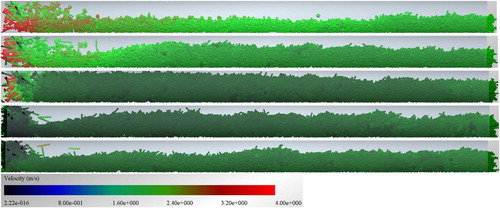
Figure 12. Mixed particle distribution at t = 5s for v = 4.1 m/s. Colors: line-shaped particles (green), square platens particles (gray), spherical particles (yellow).
After the flow becomes stable, some clogging occurs at the nozzle. Based on the mixed particle distribution, a large number of line-shaped particles accumulate at the nozzle, which proves the interception effect and indicates that the line-shaped particles, which hardly pass through the reticulated structure, are easily blocked. In the fully mixed section, no significant velocity stratification occurs, and the dune-like flow state is more obvious, which indicates that the square platens particles have an influence on the flow state. In addition, the interaction between the mixed particles and the increase in the bulk density make the flow slow. Observing the mixed particle distribution, the porosity of the mixed particles decreases, so the risk of clogging is increased as the liquid-carrying capacity of the particles is further weakened.
Discussion of the particle force
Analysis of the compressive force and coupling force
The dimensionless compressive force and dimensionless coupling force for different shaped particles during transport are shown in Figures – to describe the particle behavior more accurately.
Figure 13. Compressive force for spherical particles.
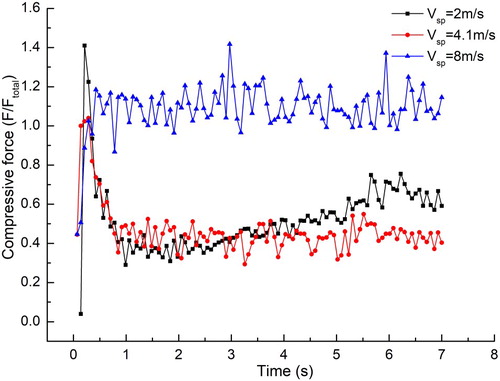
Figure 14. Coupling force for spherical particles.
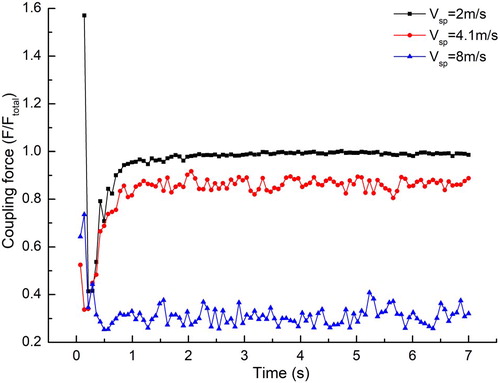
Figure 15. Compressive force for square platens particles.
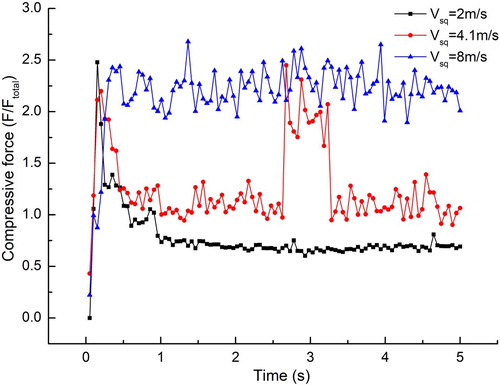
Figure 16. Coupling force for square platens particles.
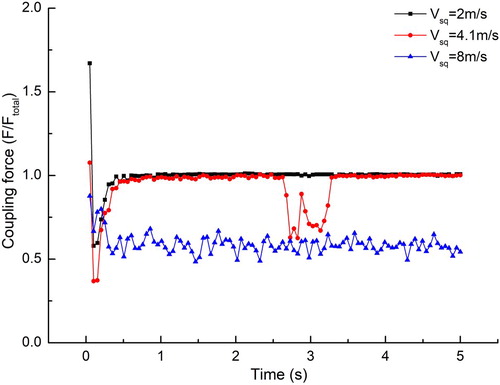
Figure 17. Compressive force for line-shaped particles.
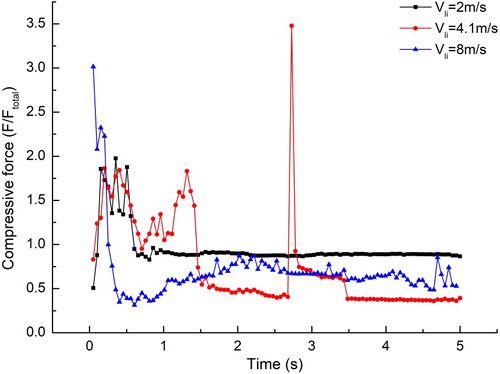
Figure 18. Coupling force for line-shaped particles.
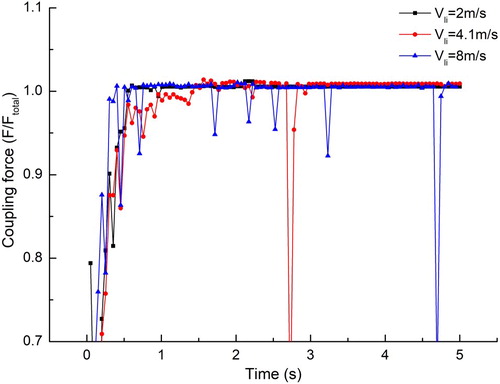
The compressive force between the spherical or square platens particles always fluctuates during transport. This phenomenon occurs because the intersection of the particle motion trajectories results in collisions, which cause the magnitude of the force to fluctuate. However, the coupling force when conveying the spherical or square platens particles remains constant at low velocity, and only small fluctuations occur at higher velocity. The main component of the coupling force arises from the liquid carrier, which strengthens the disturbance of the particles with increasing velocity, causing the coupling force to fluctuate.
In the case of spherical particles at a velocity of 2 m/s, the compressive force has an upward trend with the progression of time, which is caused by the continuous accumulation of particles. The upward trend is gentle, and the compressive force slightly decreases after reaching the maximum, indicating that after the particles have accumulated to a certain extent, the particle agglomeration will not compress the space, and space still exists for the flow to move. In addition, in the case of square platens particles at a velocity of 4.1 m/s, the compressive force and coupling force both exhibit sudden changes. In addition, the flow state is in the clogging stage. At this moment of critical clogging, the limited space in the pipe causes a sudden increase in the squeezing of the aggregated particles, resulting in a sudden increase in the compressive force. Meanwhile, the liquid-carrying effect is minimized because the flow is nearly stopped, causing a sudden drop in the coupling force.
Some differences are found in the conveyance of line-shaped particles. Clogging occurs at the nozzle both at 2 and 8 m/s, but the compressive force is more pronounced while the coupling force exhibits the opposite trend at low velocity. The main cause of clogging at low velocity is that particles accumulate layer by layer, causing the porosity to be small and the arrangement close. However, interception is the main cause of clogging at high velocity, which causes particle agglomerations to collide with each other and lose most of the turbulent energy instantaneously.
Analysis of the compressive force under clogging conditions
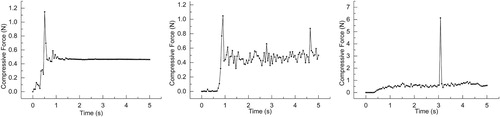
To further explore the relationship between the interaction force of different shaped particles and the occurrence of clogging, the compressive forces at different velocities and pipe positions are obtained for analysis.
As shown in Figure , clogging causes a violent increase in the compressive force, followed by a drop to a stable value. This result indicates that an instantaneous imbalance caused by clogging occurs in the pipe; however, the compressive force decreases to a stable value when a particle agglomeration is formed, and the flow tends to stabilize. In addition, when clogging occurs at the nozzle, the compressive force will stabilize at a new level after the flow has stabilized. Meanwhile, when clogging occurs at the back, the particle force after the clogging section will recover to the state before clogging due to the particle forces being balanced.
Figure 19. Compressive force under different conditions.
Notes: The figures from left to right show the compressive force changes with time for the line-shaped particles at the velocity of 2 m/s over the length of 0∼80 mm and the compressive force changes with time for the square platens particles at the velocity of 2 m/s over the length of 0∼80 mm and at the velocity of 4.1 m/s over the length of 1250∼1330 mm.
Robustness of the solid flow rate
To ensure the reliability of the transport, the robustness of the conveyance is also critical. As shown in Figures –, the stability of the flow regime under non-clogging conditions is discussed from two aspects: the number and velocity of particles.
Figure 20. Spherical particle number (2 m/s).
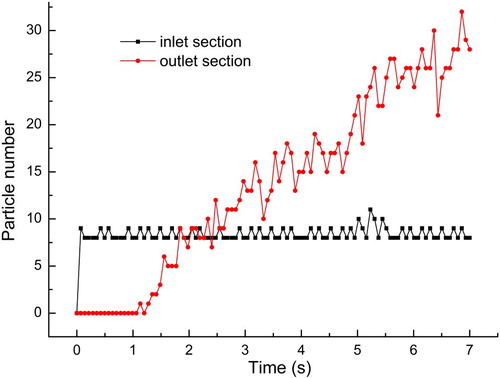
Figure 21. Spherical particle outlet velocity (2 m/s).
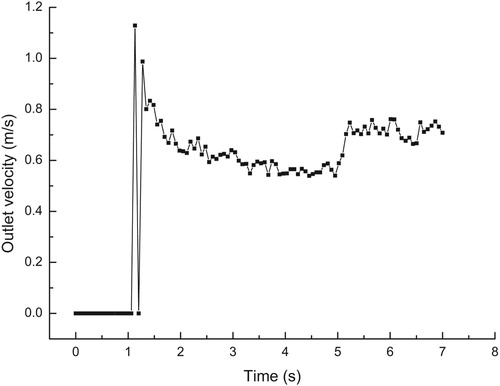
Figure 22. Spherical particle number (4.1 m/s).
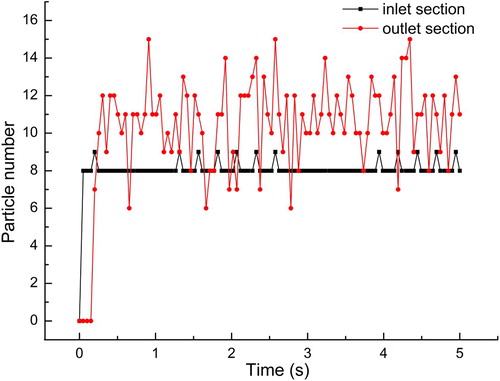
Figure 23. Spherical particle outlet velocity (4.1 m/s).
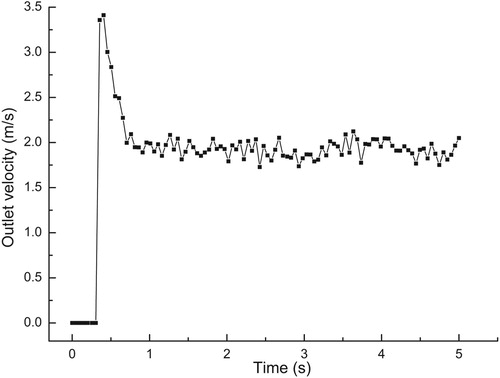
Figure 24. Spherical particle number (8 m/s).
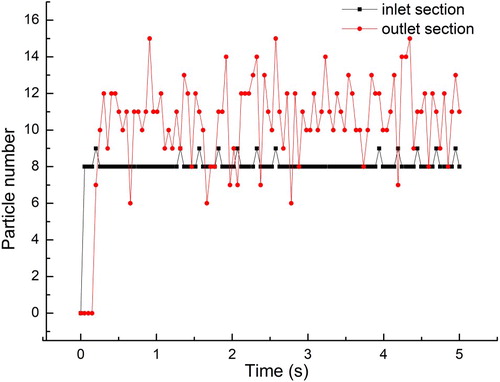
Figure 25. Spherical particle outlet velocity (8 m/s).
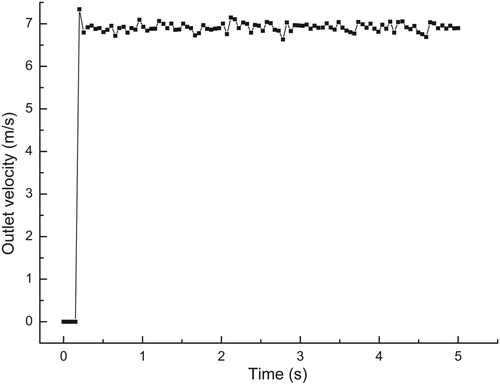
Figure 26. Square platens particle number (4.1 m/s).
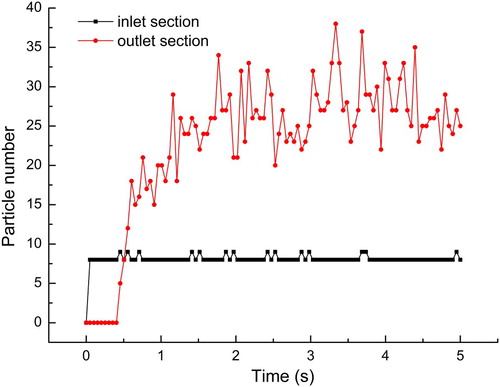
Figure 27. Square platens particle outlet velocity (4.1 m/s).
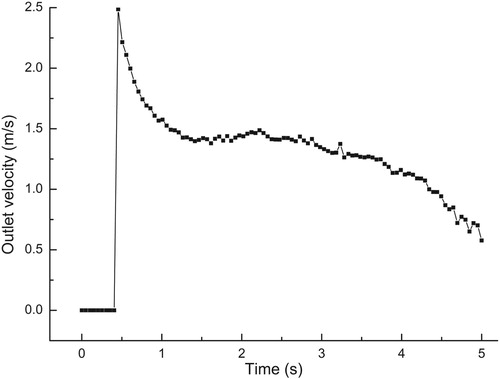
Figure 28. Square platens particle number (8 m/s).
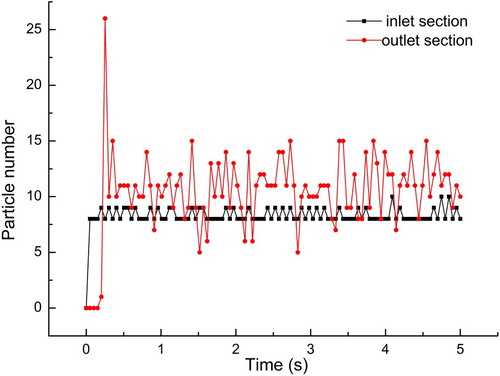
Figure 29. Square platens particle outlet velocity (8 m/s).
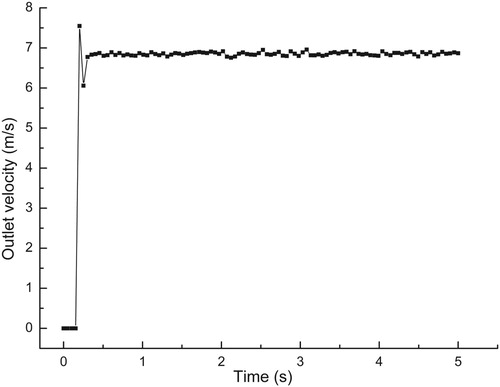
When spherical particles are transported at the velocity of 2 m/s and the number of particles injected into the inlet is constant, the outlet velocity increases, and the number of outlet particles fluctuates drastically with an upward trend. This phenomenon occurs because the apparent velocity stratification leads to increasing numbers of particles being deposited in the pipe, and the particles advance in the direction of transport in a dune-like flow, causing the number and velocity of outlet particles to simultaneously increase. When the conveying velocity is 4.1 m/s, the flow of square platens particles exhibits two flow states, sliding-bed flow and fixed-bed flow, with the progression of time. According to the figures, the number of outlet particles fluctuates at this velocity, and the particle velocity at the outlet of the pipe decreases with the progression of time. Considering the particle flow regime, the particles will completely lose their ability to move during the foreseeable period of time, forming a static deposited particle cluster that blocks the pipe. Combined with the analyses above, the flow states in these working conditions all show a sand dune flow state during the entire simulation period. This flow state is part of the sliding-bed flow and is an unstable state, which is susceptible to external influences that cause clogging.
In addition, the flow state under the other working conditions is slip flow. Although the number and velocity of the particles fluctuate, the range of variation from the average value is limited. As the velocity increases, the difference between the numbers of inlet and outlet particle decreases. Although the number and velocity of the particles fluctuate to some extent, the range of variation from the average value is limited. Meanwhile, the difference between the numbers of inlet and outlet particles decreases as the velocity increases, and the number of particles in the pipe tends to stabilize. In general, the transport maintains sliding flow under these conveyance conditions, which is stable and conducive to the pipeline transport of dredging materials.
Conclusions
This paper studied horizontal slurry pipeline transport with different shaped particles in a chemical industry project based on the coupled CFD-DEM. The influences of the particle shape on the flow regimes, concentration distributions, particle forces and transport stabilities under different velocities conditions were explored. The conclusions are as follows.
The concentration gradient decreases in the vertical direction from top to bottom when different shaped particles are transported. With the increase of the transport velocity, the spherical particle concentration transitions from the standard three-layer model to a linear distribution, while the concentration of square platens particles exhibits an almost linear distribution. The line-shaped particles are prone to clogging due to the shape specificity, so the concentration distribution is concentrated at the inlet of the pipe.
The pipe transport of non-spherical particles, among which the effect of the line-shaped particles is the most serious, easily causes pipe clogging that is hard to clear. The spherical particle flow state first transitions to slip flow with increasing conveying velocity, and the square platens particles exhibit a state transition only under high-velocity flow (8 m/s). The line-shaped particles are affected by the packing effect, causing the pipe to be blocked at low velocity, while the interception effects produced by the reticulated structure are the main cause of clogging at high velocity. In addition, due to the short accumulation process and the stable clogging state of non-spherical particles, dredging is difficult if clogging has occurred.
When conveying non-spherical particles, the velocity is inversely proportional to the coupling force and proportional to the compressive force, which will instantaneously increase under the clogging conditions. The forces for the spherical and square platens particles are stably maintained during transportation. However, the forces for the line-shaped particles are extremely unstable, indicating that the transport of the line-shaped particles is extremely complicated, which is very unfavorable for slurry pipeline transport.
The sliding-flow state is an ideal transport state for all particle shapes. When the flow is in the sliding-bed flow or transitional state, the number of particles at the outlet continues to rise or fluctuates over a large range, which easily causes clogging. However, when the flow state transitions into the sliding flow, which is a steady flow regime, the number of outlet particles fluctuates within a small range, and the velocity tends to be constant, causing safe and stable transport.
In the reality, shape is not the only factor affecting the slurry pipeline transport; other physical parameters particles behaviors can also affect transport. Further, in the actual project, the material would also be transported on the sea surface by a floating hose; thus, the type of pipe will be changed, and the fluid-structure interaction needs to be considered. At present, we are focusing on the influences of particle shapes on the pipeline transport. In the future, research on the variation law of the transport characteristics of dredged materials under the coupling of multiple physical parameters will be conducted, and hose transport floating on the sea surface will be carried out.
Data availability statement
All data and some important models used during the study appear in the submitted article, such as the revised momentum and mass conservation model and all the simulation data in the Discussion section mentioned in the paper. In addition, all of the models used during the study are available from the corresponding author by request.
Additional information
Funding
References
- Abbaszadeh Molaei, E., Yu, A. B., & Zhou, Z. Y. (2019). CFD-DEM modelling of mixing and segregation of binary mixtures of ellipsoidal particles in liquid fluidizations. Journal of Hydrodynamics, Series B, 31(1), 1–21.
- Akbarian, E., Bahman, N., Mohsen, J., Sina, F. A., Shahaboddin, S., & Kwok-wing, C. (2018). Experimental and computational fluid dynamics-based numerical simulation of using natural gas in a dual-fueled diesel engine. Engineering Applications of Computational Fluid Mechanics, 12(1), 517–534.
- Antony, S. J. (2007). Link between single-particle properties and macroscopic properties in particulate assemblies: Role of structures within structures. Philosophical Transactions of the Royal Society A – Mathematical Physical and Engineering Sciences, 365(1861), 2879–2891.
- Capecelatro, J., & Desjardins, O. (2013a). An Euler–Lagrange strategy for simulating particle-laden flows. Journal of Computational Physics, 238(31), 1–31.
- Capecelatro, J., & Desjardins, O. (2013b). Eulerian–Lagrangian modeling of turbulent liquid–solid slurries in horizontal pipes. International Journal of Multiphase Flow, 55, 64–79.
- Chu, K. W., Wang, B., Xu, D. L., Chen, Y. X., & Yu, A. B. (2011). CFD-DEM simulation of the gas-solid flow in a cyclone separator (EI). Chemical Engineering Science, 66(5), 834–847.
- Cleary, P. W. (2009). Industrial particle flow modelling using discrete element method. Engineering Computations, 26(6), 698–743.
- Cleary, P. W. (2010). DEM prediction of industrial and geophysical particle flows. Particuology, 8(2), 106–118.
- Cleary, P. W. (2013). Particulate mixing in a plough share mixer using DEM with realistic shaped particles. Powder Technology, 248(2), 103–120.
- Cundall, P. A., & Strack, O. D. L. (1979). Discussion: A discrete numerical model for granular assemblies. Geotechnique, 29(30), 331–336.
- Das, N., Thomas, S., Kopmann, J., Donovan, C., Hurt, C., Daouadji, A., … Sukumaran, B. (2011). Modeling granular particle shape using discrete element method. In Geo-frontiers 2011: Advances in geotechnical engineering (pp. 4293–4302).
- Deen, N. G., Annaland, M. V. S., Hoef, M. A. V. D., & Kuipers, J. A. M. (2007). Review of discrete particle modeling of fluidized beds. Chemical Engineering Science, 62(1), 28–44.
- Di Felice, R. (1994). The voidage function for fluid-particle interaction systems. International Journal of Multiphase Flow, 20(1), 153–159.
- Emeriault, F., & Cambou, B. (1996). Micromechanical modelling of anisotropic non-linear elasticity of granular medium. International Journal of Solids & Structures, 33(18), 2591–2607.
- Faizollahzadeh Ardabili, S., Najafi, B., Shamshirband, S., Minaei Bidgoli, B., Deo, R. C., & Chau, K.-W. (2018). Computational intelligence approach for modeling hydrogen production: A review. Engineering Applications of Computational Fluid Mechanics, 12(1), 438–458.
- Fraige, F. Y., & Langston, P. A. (2006). Horizontal pneumatic conveying: A 3D distinct element model. Granular Matter, 8(2), 67–80.
- Fraige, F. Y., Langston, P. A., & Chen, G. Z. (2008). Distinct element modelling of cubic particle packing and flow. Powder Technology, 186(3), 224–240.
- Ganser, G. H. (1993). A rational approach to drag prediction of spherical and nonspherical particles. Powder Technology, 77(2), 143–152.
- Ghalandari, M., Mirzadeh Koohshahi, E., Mohamadian, F., Shamshirband, S., & Chau, K. W. (2019). Numerical simulation of nanofluid flow inside a root canal. Engineering Applications of Computational Fluid Mechanics, 13(1), 254–264.
- Herrmann, H. J., & Luding, S. (1998). Modeling granular media on the computer. Continuum Mechanics & Thermodynamics, 10(4), 189–231.
- Hilton, J. E., & Cleary, P. W. (2011). The influence of particle shape on flow modes in pneumatic conveying. Chemical Engineering Science, 66(3), 231–240.
- Hölzer, A., & Sommerfeld, M. (2008). New simple correlation formula for the drag coefficient of non-spherical particles. Powder Technology, 184(3), 361–365.
- Hussainov, M., Kartushinsky, A., Mulgi, A., & Rudi, Ü. (1996). Gas-solid flow with the slip velocity of particles in a horizontal channel. Journal of Aerosol Science, 27(1), 41–59.
- Karimi, H., & Dehkordi, A. M. (2015). Prediction of equilibrium mixing state in binary particle spouted beds: Effects of solids density and diameter differences, gas velocity, and bed aspect ratio. Advanced Powder Technology, 26(5), 1371–1382.
- Kruggel-Emden, H., & Elskamp, F. (2014). Modeling of screening processes with the discrete element method involving non-spherical particles. Chemical Engineering & Technology, 37(5), 847–856.
- Kruggel-Emden, H., & Oschmann, T. (2014). Numerical study of rope formation and dispersion of non-spherical particles during pneumatic conveying in a pipe bend. Powder Technology, 268(1), 219–236.
- Kuang, S. B., Zou, R. P., Pan, R. H., & Yu, A. B. (2012). Gas–solid flow and energy dissipation in inclined pneumatic conveying. Industrial & Engineering Chemistry Research, 51(43), 14289–14302.
- Li, K., Kuang, S. B., Pan, R. H., & Yu, A. B. (2014). Numerical study of horizontal pneumatic conveying: Effect of material properties. Powder Technology, 251(1), 15–24.
- Liu, G., Tang, Y., & Li, B. (2017). Movement, deposition and influence laws of impurities in the product oil pipelines. Oil & Gas Storage and Transportation, 36(6), 708–715.
- Lu, G., Third, J. R., & Müller, C. R. (2012). Critical assessment of two approaches for evaluating contacts between super-quadric shaped particles in DEM simulations. Chemical Engineering Science, 78(34), 226–235.
- Lu, G., Third, J. R., & Müller, C. R. (2015). Discrete element models for non-spherical particle systems: From theoretical developments to applications. Chemical Engineering Science, 127, 425–465.
- Lun, C. K. K., Savage, S. B., Jeffrey, D. J., & Chepurniy, N. (1984). Kinetic theories for granular flow: Inelastic particles in Couette flow and slightly inelastic particles in a general flowfield. Journal of Fluid Mechanics, 140(140), 223–256.
- Ma, H., Zhao, Y., & Cheng, Y. (2019). CFD-DEM modeling of rod-like particles in a fluidized bed with complex geometry. Powder Technology, 344, 673–683.
- Marchioli, C., Giusti, A., Salvetti, M. V., & Soldati, A. (2003). Direct numerical simulation of particle wall transfer and deposition in upward turbulent pipe flow. International Journal of Multiphase Flow, 29(6), 1017–1038.
- Miedema, S. A. (2015). A head loss model for slurry transport in the heterogeneous regime. Ocean Engineering, 106, 360–370.
- Miedema, S. A. (2016). The heterogeneous to homogeneous transition for slurry flow in pipes. Ocean Engineering, 123, 422–431.
- Miedema, S. A., & Ramsdell, R. C. (2016). The delft head loss & limit deposit velocity framework (DHLLDV). Journal of Dredging, 15(2), 1.
- Mills, D. (2004). An investigation of the unstable region for dense phase conveying in sliding bed flow. Granular Matter, 6(2–3), 173–177.
- Mou, B., He, B.-J., Zhao, D.-X., & Chau, K.-W. (2017). Numerical simulation of the effects of building dimensional variation on wind pressure distribution. Engineering Applications of Computational Fluid Mechanics, 11(1), 293–309.
- Müller, C. R., Scott, S. A., Holland, D. J., Clarke, B. C., Sederman, A. J., Dennis, J. S., & Gladden, L. F. (2009). Validation of a discrete element model using magnetic resonance measurements. Particuology, 7(4), 297–306.
- Patankar, N. A., & Joseph, D. D. (2001). Modeling and numerical simulation of particulate flows by the Eulerian–Lagrangian approach. International Journal of Multiphase Flow, 27(10), 1659–1684.
- Ramezanizadeh, M., Alhuyi Nazari, M., Ahmadi, M. H., & Chau, K.-W. (2019). Experimental and numerical analysis of a nanofluidic thermosyphon heat exchanger. Engineering Applications of Computational Fluid Mechanics, 13(1), 40–47.
- Saffman, G. P. (1962). On the stability of laminar flow of a dusty gas. Journal of Fluid Mechanics, 13(1), 120–128.
- Televantos, Y., Shook, C., Carleton, A., & Streat, M. (2010). Flow of slurries of coarse particles at high solids concentrations. Canadian Journal of Chemical Engineering, 57(3), 255–262.
- Tran-Cong, S., Gay, M., & Michaelides, E. E. (2004). Drag coefficients of irregularly shaped particles. Powder Technology, 139(1), 21–32.
- Tsuji, Y. (2000). Activities in discrete particle simulation in Japan. Powder Technology, 113(3), 278–286.
- Uzi, A., & Levy, A. (2018). Flow characteristics of coarse particles in horizontal hydraulic conveying. Powder Technology, 238, 1–31.
- Vlasák, P., Chára, Z., Krupiěka, J., & Konfrět, J. (2014). Experimental investigation of coarse particles-water mixture flow in horizontal and inclined pipes. Journal of Hydrology & Hydromechanics, 62(3), 241–247.
- Wang, S., Luo, K., Hu, C., & Fan, J. (2018). Particle-scale investigation of heat transfer and erosion characteristics in a three-dimensional circulating fluidized bed. Industrial & Engineering Chemistry Research, 57, 6774–6789.
- Wang, L., Park, J.-Y., & Fu, Y. (2007). Representation of real particles for DEM simulation using X-ray tomography. Construction & Building Materials, 21(2), 338–346.
- Wasp, E. J., Kenny, J. P., & Gandhi, R. L. (1977). Solid-liquid flow slurry pipeline transportation. Bulk Materials Handling, 1, 4.
- Wolfshtein, M. (1969). The velocity and temperature distribution in one-dimensional flow with turbulence augmentation and pressure gradient. International Journal of Heat & Mass Transfer, 12(3), 301–318.
- Xu, L., Luo, K., Zhao, Y., Fan, J., & Cen, K. (2018). Multiscale investigation of tube erosion in fluidized bed based on CFD-DEM simulation. Chemical Engineering Science, 183, 60–74.
Appendix. The inter-particle forces
Table