
 ?Mathematical formulae have been encoded as MathML and are displayed in this HTML version using MathJax in order to improve their display. Uncheck the box to turn MathJax off. This feature requires Javascript. Click on a formula to zoom.
Abstract
The possible changes in precipitation of Syrian due to climate change are projected in this study. The symmetrical uncertainty (SU) and multi-criteria decision-analysis (MCDA) methods are used to identify the best general circulation models (GCMs) for precipitation projections. The effectiveness of four bias correction methods, linear scaling (LS), power transformation (PT), general quantile mapping (GEQM), and gamma quantile mapping (GAQM) is assessed in downscaling GCM simulated precipitation. A random forest (RF) model is performed to generate the multi model ensemble (MME) of precipitation projections for four representative concentration pathways (RCPs) 2.6, 4.5, 6.0, and 8.5. The results showed that the best suited GCMs for climate projection of Syria are HadGEM2-AO, CSIRO-Mk3-6-0, NorESM1-M, and CESM1-CAM5. The LS demonstrated the highest capability for precipitation downscaling. Annual changes in precipitation is projected to decrease by −30 to −85.2% for RCPs 4.5, 6.0, and 8.5, while by < 0.0 to −30% for RCP 2.6. The precipitation is projected to decrease in the entire country for RCP 6.0, while increase in some parts for other RCPs during wet season. The dry season of precipitation is simulated to decrease by −12 to −93%, which indicated a drier climate for the country in the future.
1. Introduction
Climate change has increasingly led to more frequent floods, heatwaves, droughts and so on, and has affected many sectors including water resources, health, environment, agriculture, power, and security (Ahmed, Shahid, & Nawaz, Citation2018; Alamgir et al., Citation2019, Citation2015; Mohsenipour, Shahid, Chung, & Wang, Citation2018; Pérez-Ruiz et al., Citation2018; Shahid et al., Citation2017; Shiru, Shahid, Alias, & Chung, Citation2018). Consequently, economies are being affected and humanitarian crises have sprung up in some parts of the globe, especially in arid and semi-arid environments, which are comparatively more vulnerable to climate variability (Ahmed, Shahid, & Nawaz, Citation2018; Ahmed, Shahid, Sachindra, Nawaz, & Chung, Citation2019; Hadi Pour, Abd Wahab, Shahid, & Wang, Citation2019; Khan et al., Citation2019). For example, prolonged droughts between 2007 and 2010 in Syria due to the changing climate have been reported to be a catalyst for the Syrian unrest (Kelley, Mohtadi, Cane, Seager, & Kushnir, Citation2015). The droughts aggravated a water crisis, leading to severe agricultural and livestock losses for about 1.3 million people, out of which 800,000 were affected severely (St. Cyr, Citation2005). It also resulted in the exodus of people from the afflicted villages to the cities (Solh, Citation2010).
As the impacts of the changing climate have intensified around the globe, understanding the future changes, particularly on regional scales, is important for the development of adaptation and mitigation measures (Bouwer, Citation2011; Met Office Hadley Centre, Citation2011; Szerszynski & Urry, Citation2010). General circulation model (GCM) simulations of the future climatic variables are applicable for this purpose (Wilby et al., Citation1998; Wilby & Wigley, Citation1997). However, local or regional application of GCMs have the shortcoming of uncertainty due to their coarse spatial resolution, hence they are discouraged from being used directly (Onyutha, Tabari, Rutkowska, Nyeko-Ogiramoi, & Willems, Citation2016; Sa’adi, Shahid, Ismail, Chung, & Wang, Citation2017). Through the downscaling technique, a better resolution output of the GCMs which are usable locally/regionally for climatic studies and policymaking can be obtained (Ahmed, Shahid, Nawaz, & Khan, Citation2018; Hadi Pour et al., Citation2019; Shiru, Shahid, Chung, Alias, & Scherer, Citation2019a). As GCMs are produced by different organizations, there is a spatial variation in their performance across the globe (Chen, Brissette, Lucas-Picher, & Caya, Citation2017), subjecting a user to select models uncritically from the suite of ones available for climate projection. Therefore, rather than the downscaling of a single model for climate projection, the downscaling of a number of models systematically selected by the exclusion of the least realistic ones is commonly practiced to create an ensemble model so as to lessen uncertainties in projections (Ahmed et al., Citation2019; Lutz et al., Citation2016).
The selection of models for climate downscaling is often conducted in two main ways, namely, the envelope and the past performance approaches (Chen, Brissette, & Leconte, Citation2011; Chen, Brissette, Chaumont, & Braun, Citation2013; Pryor et al., Citation2012). The selection of climate models in the past performance approach is based on the ability of the models to replicate the ongoing climate, while the collection of models that cover a broad spectrum of projections is considered in the envelope approach (Pour, Shahid, Chung, & Wang, Citation2018). The past performance approach has the strength to cover all ranges of projections for an ensemble selected from the available GCM pool, so when they are used for selection, there is no need to use the envelope approach. The filter and wrapper methods of feature selection are usually used for this purpose, (Khan et al., Citation2018; Lutz et al., Citation2016; McSweeney, Jones, Lee, & Rowell, Citation2014) considering different skill metrics, statistical indices, or their combination using multi-criteria decision analysis (MCDA). Entropy based feature selection methods can be used in the ranking of GCMs as it has the ability to measure the average information of one variable about another (Khan et al., Citation2018; Pour et al., Citation2018). Therefore, the variability in seasonal and annual observed precipitation for an area, simulated by different GCMs in combination with an MCDM technique, can be used for their rankings.
The statistical and dynamical approaches of downscaling are the two main methods of climate downscaling. Compared to the dynamical downscaling, statistical downscaling has the advantages of computational efficiency, cost effectiveness, and flexibility, and is therefore commonly used (Khan et al., Citation2018; Pour, Harun, & Shahid, Citation2014; Shiru et al., Citation2019a). Of the two statistical downscaling methods mainly used, namely the model output statistics (MOS) and the perfect prognosis (PP), the MOS has the ability to account for inherent errors and biases in GCMs, and has frequently been used in climatic downscaling (Eden & Widmann, Citation2014; Sa’adi et al., Citation2017). The MOS can also better simulate precipitation mean and variability which are most required for impact assessment (Ahmed, Shahid, Nawaz, & Khan, Citation2018; Pour et al., Citation2018).
While there is the likelihood of an increase in runoff in some areas, like the higher latitudes resulting from increased precipitation due to changes in climate, there is the possibility of increased droughts in other areas (Alkhalaf, Solakova, Zelenakova, & Gargar, Citation2018). Syria, a country already prone to droughts, may face more severe impacts from the changes in climate. This will affect agricultural production and may exacerbate the humanitarian crisis already existing in the country. Few studies (Terink, Immerzeel, & Droogers, Citation2013) used the A1B GHG emission scenario, which is a scenario of the four IPCC report families (A1, A2, B1, and B2) for climate projection in the Middle East and North African (MENA) region including Syria until 2050. It was revealed that precipitation would decrease over Syria. With the availability of more improved climate simulations, like the Coupled Model Intercomparison Project phase 5 (CMIP5), further studies of the area are paramount for the development of longer term adaptation and mitigation measures to combat climate change and achieve sustainability in the water resources and agriculture of the country.
In recent times, improved machine learning methods, including artificial neural networks (ANN), entropy based models, random forest (RF), and so on, as well as statistical techniques, have enhanced hydrological and climatological studies (Fotovatikhah et al., Citation2018; Ghorbani, Kazempour, Chau, Shamshirband, & Ghazvinei, Citation2018; Moazenzadeh, Mohammadi, Shamshirband, & Chau, Citation2018; Wang, Chau, Qiu, & Chen, Citation2015). In the present study, symmetrical uncertainty (SU), an entropy-based method, was used in the ranking of a total of 20 GCMs based on their capability to imitate the historical precipitation of Syria. An MCDA tool was afterwards employed and systematically applied using a novel multi-criterion perspective for the identification of the most suitable GCMs to create an ensemble for Syria for the projection of the possible changes in the precipitation characteristics over the Syrian region. The selected GCMs were downscaled using four bias correction methods. The most appropriate bias correction method was identified based on a set of statistical and graphical evaluation criteria. The selected bias correction model was used to correct the biases of the selected GCM projections. The multi model ensemble (MME) of the projections was generated for all the four representative concentration pathways (RCPs) RCP 2.6, RCP 4.5, RCP 6.0, and RCP 8.5 using random forest regression (Breiman, Citation2001). Finally, the precipitation of Syria was projected for the periods 2010–2039, 2040–2069, and 2070–2099, and for all RCPs at 76 grid points.
2. Study area and data
2.1. Study area
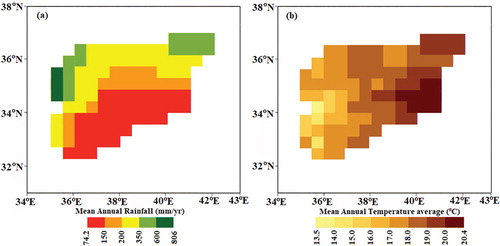
Syria (Latitude: 32°−38°N; Longitude: 35°-43°E), covering an area of 185,180 km², is located in the Middle East. The country is bordered by the Mediterranean Sea and Lebanon to the west, Turkey to the north, Jordan to the south, and Iraq to the east. The topography of the country is characterized by a narrow coastal plain in the west, mountains in the west, and a desert plateau to the east (Figure ). The climate of the country is mostly the desert type. Precipitation in Syria ranges between 350 and 800 mm/yr in the northwest and decreases in the south to less than 100 mm/yr (Figure a). Precipitation usually occurs in winter (wet season) between November and April, while the rest of the year is mostly dry. Although the northwest part that borders the Mediterranean is fairly green, most parts of the country consist of arid plateau. Important agricultural areas in the country are Al-Jazira in the northeastern part and Hawran in the south. The largest river in the region, the Euphrates, crosses the country through the eastern part. The range of the mean monthly temperature of Syria varies from 7°C in January to 28°C in August. Spatially, the temperature ranges between 13°C in the southwest to more than 20°C in the east (Figure b).
Figure 1. Geographical position and elevation of Syria.
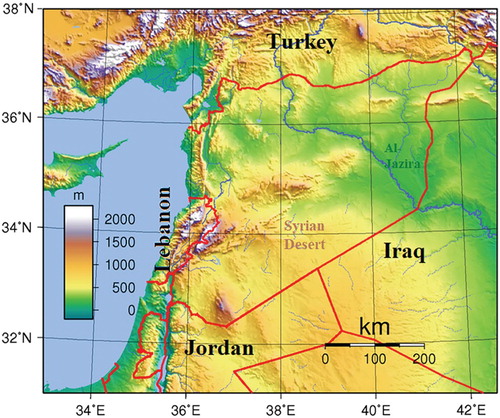
Figure 2. Geographical distribution of (a) mean annual precipitation and (b) annual average temperature prepared from monthly GPCC and CRU data respectively for Syria during 1971–2000.
2.2. Data
2.2.1. Observed precipitation data
In Syria, there are insufficient long-term records of climatic observations for hydro-climatological investigations. Gridded climate data offer a reliable use for the purpose of climate research in such areas. Among these data, gauge-based data are more preferred due to their availability for a longer time span and higher spatial resolution (Shiru, Shahid, Chung, & Alias, Citation2019b). The Deutscher Wetterdienst’s Global Precipitation Climatology Center (GPCC) full data reanalysis product (Becker et al., Citation2013; Schneider et al., Citation2014) was used as the reference data in this study. GPCC data has the advantage of: (1) time series completeness after January 1951; (2) having its derivation from the highest number of observation records; (3) good data quality for hydrological studies; and (4) usage for a wider period of study due to a longer time span (Ahmed et al., Citation2014; Ahmed, Shahid, Chung, Ismail, & Wang, Citation2017; Spinoni, Naumann, Carrao, Barbosa, & Vogt, Citation2014). The monthly GPCC precipitation at 76 grid points within Syria for a time span of 1961–2005 was used in this study. The GPCC precipitation data has been widely validated and used in many studies around the globe (Dinku, Connor, Ceccato, & Ropelewski, Citation2008; El Kenawy & McCabe, Citation2016; Sarmadi & Shokoohi, Citation2015; Shiru et al., Citation2019c). In the neighboring country of Iraq, GPCC was found to have an overall best performance in replication of the observed properties of rainfall in the country compared to six other precipitation data products.
2.2.2. Historical temperature data
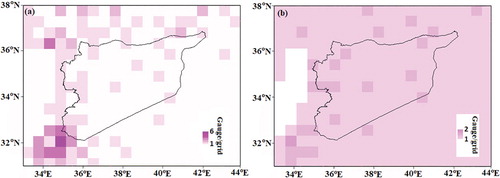
The monthly average gridded daily mean temperature data of the Climatic Research Unit (CRU) (Harris, Jones, Osborn, & Lister, Citation2014) of the East Anglia University at 0.5° spatial resolution (76 grid points covering Syria) for the period 1961–2005 was also used in this study along with GPCC precipitation for the selection of GCMs. The CRU temperature is prepared from gauged data gathered from more than 4000 stations distributed across the globe. The quality of collected data is assessed using both manual and semi-automatic procedures. The first was the intensive checking of the data for consistency, and the second involved the removal of the stations or months with large errors during the interpolation process. The CRU data has been widely validated and used for climatic studies due to its performance (Qutbudin et al., Citation2019; Sa’adi, Shiru, Shahid, & Ismail, Citation2019; Shiru et al., Citation2019c; Ying et al., Citation2009). CRU temperature data has been used in the Middle East and found suitable for climate research (Pu & Ginoux, Citation2016; Rahman, Almazroui, Islam, O’Brien, & Yousef, Citation2018). The number of gauges per grid for Syria for the GPCC and CRU precipitation and temperature data respectively are given in Figure .
Figure 3. Number of gauges per grid in and around Syria used for the preparation of (a) GPCC and (b) CRU data.
2.2.3. CMIP5 datasets
The Coupled Model Intercomparison Project phase 5 (CMIP5) has a set of globally coordinated GCM simulations developed by different climate modeling organizations. In comparison to the CMIP3, the CMIP5 is much improved (Taylor, Stouffer, & Meehl, Citation2012). In the present study, 20 CMIP5 monthly simulations of GCMs were selected on the basis of their availability for all RCPs for Syria. A description of selected GCMs is given in Table .
Table 1. Developing organization and the resolution of GCMs used in this study.
3. Methods
Although the aim of the present study was to project precipitation for Syria, the selection of GCMs for both precipitation and temperature were considered. This is because temperature and precipitation are important climatic variables which can affect each other, and both have impacts simultaneously on the characteristics of disasters such as flood and drought. Therefore, it is expected that the selected GCMs in this study would be able to project the climate of Syria and can be applied for future studies requiring both rainfall and temperature. Therefore, GCMs were selected based on their ability to simulate both precipitation and temperature. Selected precipitation GCMs were then used for the precipitation projection of Syria. The procedure used for the selection of GCMs and the projection of spatio-temporal changes in the precipitation of Syria is outlined here:
The re-gridding of the 20 GCM simulations to a 0.5o grid in order to have the same resolution as that of the GPCC and CRU data;
The use of the past performance approach for the preparation of a sub-ensemble or a subset of GCMs;
Comparison of the four widely used bias correction methods and selection of the best and highest performing bias correction method to correct the biases in GCMs precipitation at each grid, taking GPCC precipitation as the base;
Generate MME of GCM simulations using RF in order to reduce uncertainty in projection;
Evaluate spatio-temporal changes in precipitation in Syria during 2010–2039, 2040–2069, and 2070–2099.
The methods applied in selecting the GCMs and the downscaling are given in the next sections.
3.1. GCM ensemble selection
Selecting the most appropriate GCMs for climatic studies is imperative for the development of reliable policies for the mitigation of the impact of climate change for an area. Due to numerous GCMs with a varying range of uncertainties available from different organizations/modeling centers at various resolutions, selection can be challenging. A systematic aggregation of a multi model ensemble (MME) for the projection of climate can reduce the uncertainties existing in the individual GCMs (Knutti, Furrer, Tebaldi, Cermak, & Meehl, Citation2010; McSweeney et al., Citation2014). Therefore, in this study, the most suitable GCMs for the formation of MME for the projection of precipitation in Syria were selected. The procedure for this selection is given as follows:
Re-grid GCM simulation of precipitation and temperature for the period 1961–2005 to GPCC/CRU resolution (0.5°) for compliance;
Estimate the SU of each GCM based on their capability to construct GPCC precipitation and CRU daily mean temperature at each grid point for the period 1961–2005;
Estimate GCM ranking using scores ranking pattern aggregation at all grids over Syria using MCDM;
Delineate GCM ensemble based on ranking in simulating precipitation and temperature.
In this study, model selection was conducted considering precipitation and temperature as they have strong relationships, and it would be logical to choose the same GCMs for climatic projections for an area. Hence, a model’s selection in this study is not only based on the scores and rankings of the precipitation, but those of the temperature as well.
The next sections discuss the methods involved in the ranking of the GCMs and the scoring techniques applied in selecting the most suitable ones using MCDA.
3.1.1. Symmetrical uncertainty
Symmetrical uncertainty (SU) has its basis in the theoretical conception of information entropy. It can be used to assess the input feature’s influence on model outcomes, hence is applicable in GCM classification based on goodness evaluation (Jiang, Ding, Ma, & He, Citation2008). The mutual information (MI) concept is used for the association assessment of two variables. Let M and N be GPCC precipitation and GCM historical precipitation simulation respectively at a grid location. If σ(M) and σ(N) are the probability density functions (PDFs) and σ(M, N) is the joint PDF of M and N, then the MI between M and N is (Senthamarai Kannan & Ramaraj, Citation2010; Singh, Kushwaha, & Vyas, Citation2014):
(1)
(1) Common information in two precipitations is estimated by MI as the difference between entropy sums and their joint entropy:
(2)
(2) where, H(M) and H(M, N) are Shannon’s entropy of M and the joint entropy of M and N, respectively. The MI estimated by Equation (Equation1
(1)
(1) ) indicates the MI between GPCC and GCM precipitations. The MI will be zero if the variables are independent of each other, while a higher than zero MI is an indication that there is some sort of similarity between the GPCC and GCM precipitations.
There is a bias of MI towards the variable with large values. It is possible to avoid by the use of SU which is the ratio of MI to the sum of the entropies of GCM precipitation and GPCC precipitation:
(3)
(3) Complete similarity exists between GPCC and GCM precipitation when the SU is 1, while an SU equal to 0 means no similarity (Shreem, Abdullah, & Nazri, Citation2014).
3.1.2. Ranking of GCMs using MCDA
Information aggregation from various sources using MCDM is found efficient in the ranking of alternatives (Salman et al., Citation2019; Xiao-jun et al., Citation2014). In this study, GCM ranking was conducted based on their scores generated using the SU method and an MCDM approach. This involves a payoff matrix, whereby the grid point numbers at which a certain rank is achieved by a GCM is observed in the matrix. This study involves 20 GCMs and, thus, the payoff matrix dimension was 20 by 20 where the ranks were between 1 and 20. The model performance is quantified based on the occurrence frequency of GCM at all grid points over Syria. This means the higher the frequency of occurrence of a model at the different grid points within the study area, the higher its general performance for the total grid points of the study area. Similarly, a higher frequency of occurrence of a particular model gives it higher weight, and hence a higher ranking among other models. For example, if a GCM obtained rank of 1, 2, 3, … , n at X1, X2, X3, … Xn grid point respectively, the score of the GCM is estimated as: X1 (1/1) + X2 (1/2) + X3 (1/3) + … . Xn (1/n). For example, if a GCM obtains a rank of 1 at n grid points, it gets a score of (n/1), if it obtains second rank at m grid points, it gets another (m/2) score, and so on. The total score is estimated from all the ranks a GCM gets.
3.2. Correction of biases in GCMs
Over the last few decades, several bias correction techniques have emerged. Amongst the ones widely used are the quantile mapping (QM), general quantile mapping (GQM), power transformation (PT), and linear scaling (LS) methods as they are simple to apply and have good correction abilities (Noor et al., Citation2019). Therefore, performance of these methods was compared according to their capability to correct biases in GCM precipitation for the period 1961–2005 in reference to the GPCC precipitation. Their performances were assessed using standard statistical indices, namely, modified index of agreement (MD), relative standard deviation (RSD), percentage of bias (Pbias), normalized root mean square error (NRMSE%), and volumetric efficiency (VE). The biases of the ensemble GCMs were then corrected using the best performing bias correction method.
3.3. Precipitation ensemble projections
The variance in the MME average is possible to preserve by the regression-based MME and, thus, it has been widely used for this purpose in recent times. However, there is a lack of ability by multiple linear regressions to define the nonlinear association existing between the dependent and the independent variables, even when the linear relationship is significant. Such nonlinearity can be modeled using RF (Li, Heap, Potter, & Daniell, Citation2011) and hence was applied in this study for the conversion of the selected GCM precipitation into a single precipitation series. RF has advantages – like robustness, which can avoid over-fitting, and operational and analytical flexibility – and as such was used in this study for the generation of ensemble projection for different RCPs. The spatial and temporal precipitation variation of Syria was evaluated from the MME precipitation projection for 2010–2039, 2040–2069, and 2070–2099, against the GPCC precipitation for 1971–2000.
4. Application results and analysis
4.1. Ranking of GCMs
GCM rankings based on their capacity in the replication of precipitation and temperature using SU and MCDA respectively is shown in Figure a and 4b respectively. The x-axis represents the ranks of the GCMs while the y-axis numbers indicate the GCM numbers as given in Table . Figure shows MIROC5 (16) attained the highest ranking for the most number of grids for precipitation followed by CSIRO-MK3.6.0 (5), HadGEM2-AO (12), GFDL-CM3 (7), and so on. In the case of temperature, HadGEM2-ES (13) attained the highest rank at most of the grid points.
Figure 4. GCM ranking according to their performance in replicating (a) the precipitation and (b) the temperature of the study area. The color bar represents the number of grid points.
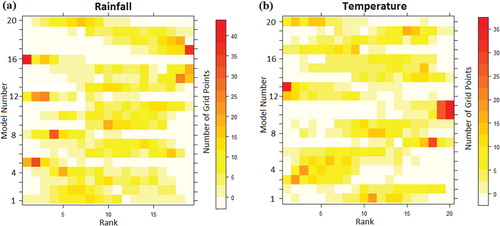
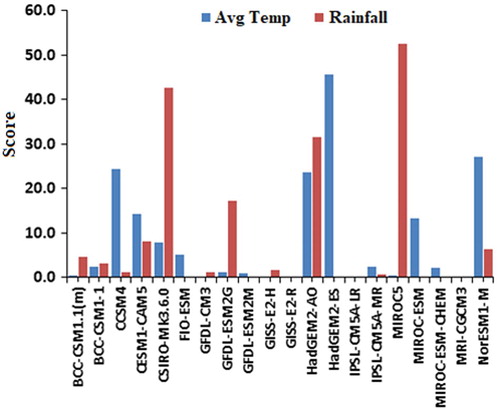
The score obtained for each of the GCMs for precipitation and temperature based on their rankings are shown in Figure , which reveals that the highest ranking models for precipitation are MIROC5, CSIRO-MK3.6.0, HadGEM2-AO, GFDL-CM3, CESM1-CAM5, and NorESM1-M, while the highest ranking ones for temperature are HadGEM2-ES, NorESM1-M, CCSM4, HadGEM2-AO, CESM1-CAM5, and MIROC-ESM. However, some GCMs like MIROC5, even though they rank high for precipitation, showed very low performance for temperature.
Figure 5. The score of the 20 models obtained using SU and MCDA for precipitation and temperature.
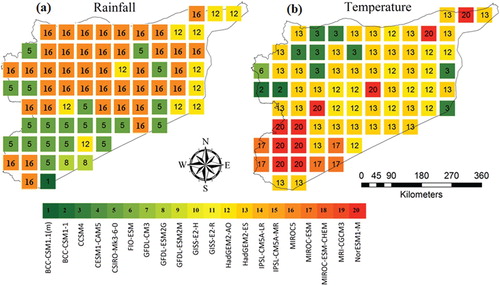
The spatial patterns showing the performances of the different GCMs used in this study are presented in Figure a and 6b for precipitation and temperature respectively. Figure a shows IPSL-CM5A-MR was ranked top at most of the northwest and central areas, and some parts of the northeast and southwest. In the northeast of the country, HadGEM2-AO showed a better performance. CSIRO-MK3.6.0 was seen as best in the south and in some parts of the northeast and northwest. For temperature, NorESM1-M was found best in the southwest and at a few other locations in Syria. CCSM4 was ranked top in the northwest and some grids in the east. MIROC-ESM was ranked top at some grids in the southwest while HadGEM2-AO and HadGEM2-ES was ranked top for most other locations in the country.
Figure 6. Spatial ranking of the models by SU for (a) precipitation and (b) temperature.
The ranking of the GCMs based on precipitation and temperature are presented in Table . As some models rank very high for one variable and very low for the other, e.g. MIROC5 was ranked very high for precipitation but very low for temperature, the top 50th percentile GCMs were considered as the GCMs that have the capability to simulate the climate (both rainfall and temperature) of the study area (Khan et al., Citation2018). Therefore, any GCM for each of the variables that falls at the bottom 50th percentile was considered to have less skill in simulation. In order to select the same model for precipitation and temperature, only those existing for the precipitation and temperature of the 50th percentile models for each variable were considered. Therefore, CSIRO-Mk3.6.0, HadGEM2-AO, CESM1-CAM5, and NorESM1-M (in bold in Table ) were selected as the most suitable GCMs for the climate simulation of Syria.
Table 2. The scores and ranks achieved by the GCMs for precipitation and temperature.
4.2. Performance assessment of bias correction methods
For the evaluation of the performances of the bias correction methods, the monthly mean precipitation of the selected models was compared with those of the GPCC precipitation using five different statistical indices. The results obtained for each of the methods and the GCM are presented in Table . The performances of the bias correction method vary for the different models. However, in order to choose the same bias correction approach for the downscaling of all GCMs, the most capable method for all GCMs in terms of all statistics was explored. The table shows LS as the best for correcting the biases in the GCM precipitation of Syria.
Table 3. The evaluation metrics of the four bias correction methods used in the study. The bold number represents the best statistics.
4.3. Performance evaluation of downscaled precipitation
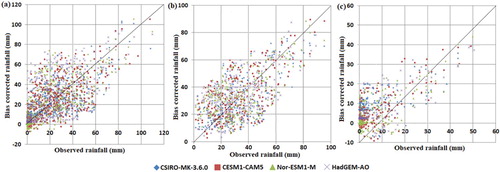
The performance of the downscaled GCM precipitation using LS was first assessed using scatter plots and PDF plots. This was done for both wet and dry seasons and for the year-round precipitation in Syria. The downscaled and the GPCC precipitation relationships for the entire year, as well as the wet and dry seasons, are depicted in Figure a, b, and c, respectively. Good estimates of the downscaled precipitation to that of the GPCC were observed, indicating the efficiency of the LS method for the correction of the biases in the GCMs.
Figure 7. Scatter plots of the downscaled and GPCC precipitation for (a) the entire year, the (b) wet season, and (c) the dry season.
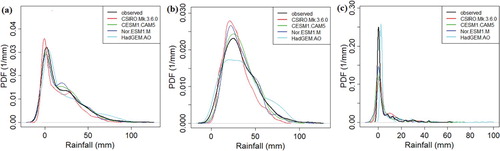
The PDFs of the downscaled precipitation of GCMs and the GPCC precipitation were also compared to assess the performance of LS bias correction methods in replicating variance, average, and distribution. The PDFs for the GPCC and the downscaled GCM precipitation for the entire year, as well as the wet and dry seasons, are given in Figure . Figures show similarity in the shapes of the PDFs of GCMs and the GPCC, which proves the ability of LS in correcting the biases in the GCMs (Figure ).
Figure 8. PDFs of GPCC and downscaled precipitation for (a) the entire year, (b) the wet season, and (c) the dry season.
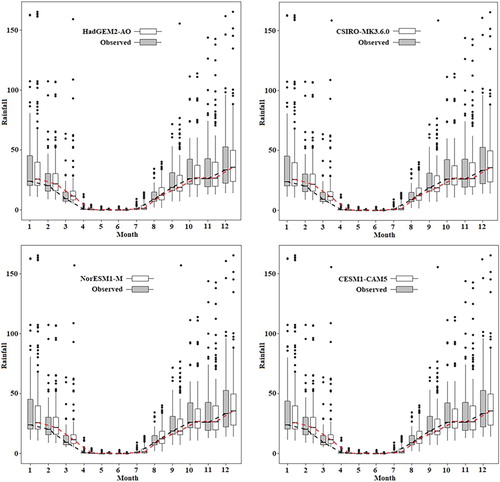
The LS performance in downscaling GCM precipitation was also assessed through comparison of the boxplots of the monthly averages of the GPCC and downscaled GCM precipitation. The boxplots for each of the GCMs and the GPCC are presented in Figure . Figures show close matching of precipitation in different GCMs with the GPCC precipitation indicating the ability of the LS in correcting the biases in the GCMs.
Figure 9. Boxplots of the monthly GPCC precipitation compared to those of the downscaled precipitation. The black line is the median values of the observed precipitation (GPCC) while the red is the median of the downscaled precipitation.
4.4. Precipitation projection
The MME precipitation for RCP 2.6, RCP 4.5, RCP 6.0, and RCP 8.5 were used in this study to show the spatio-temporal changes in precipitation in Syria. Selected GCM precipitation was downscaled at all the 76 grid points of Syria. The projected precipitation MME was computed for all the grids for different RCPs using RF. Results obtained from the MME means projections for precipitation are discussed later in this article.
4.4.1. Multi-model ensemble mean of precipitation
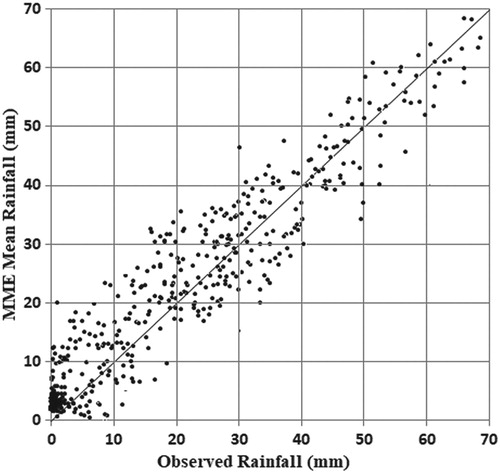
The scatter plot of the GPCC precipitation and the MME mean precipitation for the period 1961–2005 averaged for all the 76 grid points for Syria is presented in Figure . A good association between the GPCC and the MME precipitation was observed, indicating the strength of the RF in the computation of the MME. At each of the grid points, the correlation coefficients between the estimated MME and the observed data falls at the value of 0.94 at least. The estimated MME from RF can be said to improve the projection accuracy as it reduces the uncertainties associated with individual GCMs.
Figure 10. Scatter plot of the areal average of GPCC and MME mean precipitation during 1961–2005.
4.4.2. Changes in geographical distribution of annual precipitation
The spatial pattern of the percentage precipitation changes expected over Syria during 2010–2039, 2040–2069, and 2070–2099 in comparison to GPCC precipitation during 1971–2000 are presented in this section. Assessment of the changes was done for the entire year and for both wet and dry seasons for all RCPs.
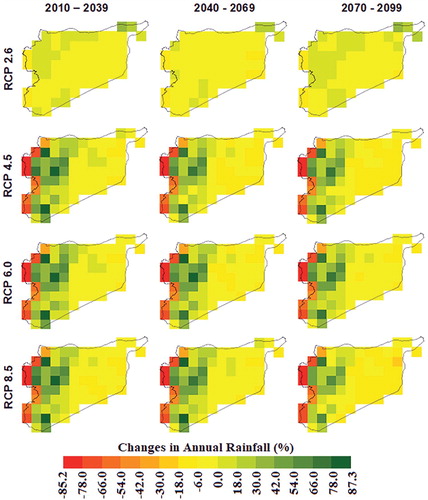
Figure presents the expected annual changes (%) in precipitation for the country. Maps show that parts of the northwest and southwest, mostly the coastal areas of the country, would have the highest decreases in precipitation in the range of −30 to −85.2% under RCPs 4.5, 6.0, and 8.5 during the three considered periods. The same areas showed a precipitation decrease in the range of 0.0 to −30% under RCP 2.6. Increases in precipitation ranging from 6 to 87.3% were observed at the places next to this area in the same region. The precipitation was projected to decrease in the entire eastern part, except in some patches where precipitation was projected to increase up to 18%.
Figure 11. Geographical distribution of the changes (%) in annual mean precipitation for different RCPs and future periods.
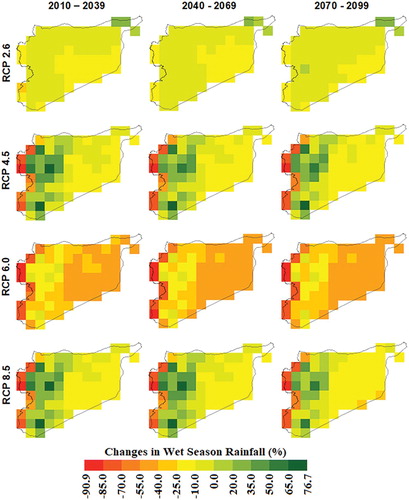
The geographical distribution of the changes (%) in precipitation during the wet season in Syria is presented in Figure for different RCPs and periods. Under RCP 2.6, a decrease in precipitation (0.0–−25%) was projected for the entire country for all the periods except at a few grid points. Increases in precipitation were observed for RCP 4.5 and RCP 8.5 in most parts of the northwest and the southwest next to the coastal area. The coastal areas, however, showed decreasing precipitation for these RCPs. Decreases in precipitation up to −40% were observed for RCPs 4.5 and 8.5 in the east of the country. Under RCP 6.0, precipitation was found to decrease at different rates in the entire country ranges from < 0.0 in the northwest and southwest to −55% in the east, and −90% in the coastal areas.
Figure 12. Geographical distribution of the changes (%) in wet season precipitation for different RCPs and future periods.
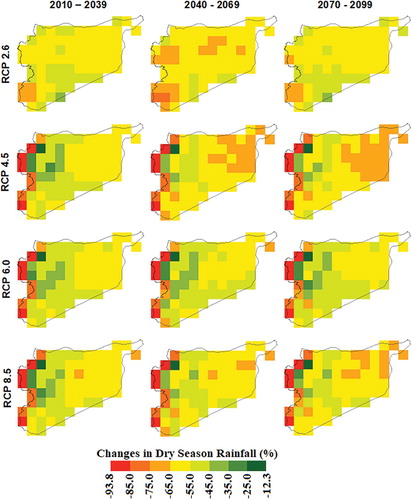
The spatial changes (%) in rainfall during the dry season are presented in Figure . Though rainfall occurrences are low during the dry season, the projection of rainfall during the different periods under different RCPs indicated a drier condition in all parts of the country. As in the entire year and wet season, the coastal areas of Syria showed the highest percentage decreases in rainfall (> −90%) followed by the eastern parts (−45 to −75%). The least changes in rainfall were observed in the areas next to the coast in the northwest and the southwest of the country.
Figure 13. Geographical distribution of the changes (%) in dry season rainfall for different RCPs and future periods.
5. Discussion and conclusions
The climatic variables are changing in many regions of the globe, including Syria, due to global warming, which has an impact on many sectors of our existence (Ahamed et al., Citation2019; Mathbout, Lopez-Bustins, Martin-Vide, Bech, & Rodrigo, Citation2018; Nashwan, Shahid, & Abd Rahim, Citation2018; Salman et al., Citation2017). There have been reports of the aggravation of the impacts of climate change, especially in areas that are prone to disasters like droughts, among which Syria belongs. Understanding the dynamics of the possible alteration in climate variables and how they may influence disasters is therefore pivotal for the development of resilience. The selection of suitable GCMs for Syria was conducted in this study for ensemble projection of climate. Of a total of 20 GCMs, four were selected by combining SU and a MCDM approach. Four bias correction techniques were compared in terms of their abilities to downscale the precipitation of selected GCMs. The MME average of the downscaled precipitation projection was made using RF.
It was revealed that CSIRO-Mk3.6.0, HadGEM2-AO, CESM1-CAM5, and NorESM1-M are the models best suited for Syria for precipitation projection based on their skill. As the GCMs were identified based on their ability to mimic observed precipitation and temperature, those can be used for the evaluation of the impact of climate change in Syria. The appraisal of the four bias correction methods showed that linear scaling followed by power transformation is the most efficient method for precipitation downscaling in Syria. The study also revealed the capability of non-linear regression for the preparation of MME.
Annual precipitation was projected to decrease mostly in the coastal areas, while projected to increase next to those areas. The eastern parts would mostly experience a decrease in precipitation in the range of 0.0–−30%. Percentage decreases in precipitation were projected to be higher for RCPs 4.5 and 8.5 for the period 2070–2099, while the increase in precipitation in the northwest and southwest were noticed least for RCP 2.6 for the considered periods compared to other RCPs.
Changes in percentage precipitation during the wet season were observed to decrease most for RCP 6.0 (−70% in the east). The precipitation was generally projected to decrease in the coastal areas for all RCPs with the lowest decrease for RCP 2.6. Increases in precipitation (up to 76%) were projected at some areas in the northwest and southwest for RCPs 4.5 and 8.5. Increases ranging from 0.0 to 20% in these areas and in the northeast were projected for RCP 2.6. Overall, precipitation was found to decrease during the dry season with the highest decreases in the coastal areas and in northeast.
The data and methods applied in the study are carefully selected based on an extensive literature review. The methodologies were compared, after which the high performing methods were selected for the application and preparation of results. The quantification of uncertainties relating to data and methodology applied were not assessed in this study. Nevertheless, it cannot be ruled out that these are not in existence considering uncertainties inherent from the GCMs and other data during their various processes of preparation. Future study can be conducted on uncertainties associated with precipitation projected in this study. However, it can be sufficiently said that the results and approaches presented in this study can be a guide to the likely expected changes in precipitation in the future.
The findings from this study have revealed the importance of this study of Syria. It has shown that the country, which has witnessed severe and prolonged droughts in the past, may experience more severe droughts in the future due to a decline in precipitation. This will aggravate the water crisis and agriculture, which is an essential source of livelihood for most of the rural population. With the same GCMs selected in this study for precipitation and temperature projection, a similar study can be conducted in the future on the projection of temperature change in Syria. The findings of this study can be utilized for the formulation of climate change adaptation and mitigation strategies.
Disclosure statement
No potential conflict of interest was reported by the authors.
Related Research Data
References
- Ahamed, S. J., Homsi, R., Khan, N., Shahid, S., Shiru, M. S., Mohsenipour, M., … Yuzir, A. (2019). Assessment of changing pattern of crop water stress in Bangladesh. Environment, Development and Sustainability, 19. doi:10.1007/s10668-019-00400-.
- Ahmed, K., Shahid, S., Chung, E. S., Ismail, T., & Wang, X. J. (2017). Spatial distribution of secular trends in annual and seasonal precipitation over Pakistan. Climate Research, 74(2), 95–107. doi:10.3354/cr01489.
- Ahmed, K., Shahid, S., Harun, S. B., Ismail, T., Nawaz, N., & Shamsudin, S. (2014). Assessment of groundwater potential zones in an arid region based on catastrophe theory. Earth Science Informatics, 8(3), 539–549. doi:10.1007/s12145-014-0173-3.
- Ahmed, K., Shahid, S., & Nawaz, N. (2018). Impacts of climate variability and change on seasonal drought characteristics of Pakistan. Atmospheric Research, 214(May), 364–374. doi:10.1016/j.atmosres.2018.08.020.
- Ahmed, K., Shahid, S., Nawaz, N., & Khan, N. (2018). Modeling climate change impacts on precipitation in arid regions of Pakistan: A non-local model output statistics downscaling approach. Theoretical and Applied Climatology. doi:10.1007/s00704-018-2672-5.
- Ahmed, K., Shahid, S., Sachindra, D. A., Nawaz, N., & Chung, E. S. (2019). Fidelity assessment of general circulation model simulated precipitation and temperature over Pakistan using a feature selection method. Journal of Hydrology, 573(March), 281–298. doi:10.1016/j.jhydrol.2019.03.092.
- Alamgir, M., Mohsenipour, M., Homsi, R., Wang, X., Shahid, S., Shiru, M., … Yuzir, A. (2019). Parametric assessment of seasonal drought risk to crop production in Bangladesh. Sustainability, 11(5), 1442. doi:10.3390/su11051442.
- Alamgir, M., Shahid, S., Hazarika, M. K., Nashrrullah, S., Harun, S. B., & Shamsudin, S. (2015). Analysis of meteorological drought pattern during different climatic and cropping seasons in Bangladesh. JAWRA Journal of the American Water Resources Association, 51(3), 794–806. doi: 10.1111/jawr.12276
- Alkhalaf, I., Solakova, T., Zelenakova, M., & Gargar, I. (2018). Recent climate change in Syria: Seasonal rainfall and climatology of Syria for 1991–2009. Selected Scientific Papers – Journal of Civil Engineering, 13(1), 77–96. doi:10.1515/sspjce-2018-0022.
- Becker, A., Finger, P., Meyer-Christoffer, A., Rudolf, B., Schamm, K., Schneider, U., & Ziese, M. (2013). A description of the global land-surface precipitation data products of the global precipitation climatology centre with sample applications including centennial (trend) analysis from 1901-present. Earth System Science Data. doi:10.5194/essd-5-71-2013.
- Bouwer, L. M. (2011). Have disaster losses increased due to anthropogenic climate change? Bulletin of the American Meteorological Society. doi:10.1175/2010BAMS3092.1.
- Breiman, L. (2001). Random forests. Machine Learning, 45(1), 5–32. doi:10.1023/A:1010933404324.
- Chen, J., Brissette, F. P., Chaumont, D., & Braun, M. (2013). Performance and uncertainty evaluation of empirical downscaling methods in quantifying the climate change impacts on hydrology over two North American river basins. Journal of Hydrology. doi:10.1016/j.jhydrol.2012.11.062.
- Chen, J., Brissette, F. P., & Leconte, R. (2011). Uncertainty of downscaling method in quantifying the impact of climate change on hydrology. Journal of Hydrology, 401(3–4), 190–202. doi:10.1016/j.jhydrol.2011.02.020.
- Chen, J., Brissette, F. P., Lucas-Picher, P., & Caya, D. (2017). Impacts of weighting climate models for hydro-meteorological climate change studies. Journal of Hydrology, 549, 534–546. doi: 10.1016/j.jhydrol.2017.04.025
- Dinku, T., Connor, S. J., Ceccato, P., & Ropelewski, C. F. (2008). Comparison of global gridded precipitation products over a mountainous region of Africa. International Journal of Climatology, 28, 1627–1638. doi: 10.1002/joc.1669
- Eden, J. M., & Widmann, M. (2014). Downscaling of GCM-simulated precipitation using model output statistics. Journal of Climate, 27(1), 312–324. doi:10.1175/jcli-d-13-00063.1.
- El Kenawy, A. M., & McCabe, M. F. (2016). A multi-decadal assessment of the performance of gauge-and model-based rainfall products over Saudi Arabia: Climatology, anomalies and trends. International Journal of Climatology, 36(2), 656–674. doi: 10.1002/joc.4374
- Fotovatikhah, F., Herrera, M., Shamshirband, S., Chau, K.-W., Ardabili, S. F., & Piran, M. J. (2018). Survey of computational intelligence as basis to big flood management: Challenges, research directions and future work. Engineering Applications of Computational Fluid Mechanics, 12(1), 411–437. doi:10.1080/19942060.2018.1448896.
- Ghorbani, M. A., Kazempour, R., Chau, K.-W., Shamshirband, S., & Ghazvinei, P. T. (2018). Forecasting pan evaporation with an integrated artificial neural network quantum-behaved particle swarm optimization model: A case study in Talesh, Northern Iran. Engineering Applications of Computational Fluid Mechanics, 12(1), 724–737. doi:10.1080/19942060.2018.1517052.
- Hadi Pour, S., Abd Wahab, A. K., Shahid, S., & Wang, X. (2019). Spatial pattern of the unidirectional trends in thermal bioclimatic indicators in Iran. Sustainability, 11(8), 2287. doi:10.3390/su11082287.
- Harris, I., Jones, P. D., Osborn, T. J., & Lister, D. H. (2014). Updated high-resolution grids of monthly climatic observations – the CRU TS3.10 Dataset. International Journal of Climatology. doi: 10.1002/joc.3711
- Jiang, B., Ding, X., Ma, L., He, Y., Wang, T., & Xie, W. (2008). A hybrid feature selection algorithm: Combination of symmetrical uncertainty and genetic algorithms. Proceedings of the 2nd International Symposium on Optimization and Systems Biology, Lijiang, pp. 152–157.
- Kelley, C. P., Mohtadi, S., Cane, M. A., Seager, R., & Kushnir, Y. (2015). Climate change in the fertile crescent and implications of the recent Syrian drought. Proceedings of the National Academy of Sciences, 112(11), 3241–3246. doi:10.1073/pnas.1421533112.
- Khan, N., Pour, S. H., Shahid, S., Ismail, T., Ahmed, K., Chung, E., … Wang, X. (2019). Spatial distribution of secular trends in rainfall indices of Peninsular Malaysia in the presence of long-term persistence. Meteorological Applications. doi:10.1002/met.1792.
- Khan, N., Shahid, S., Ahmed, K., Ismail, T., Nawaz, N., & Son, M. (2018). Performance assessment of general circulation model in simulating daily precipitation and temperature using multiple gridded datasets. Water, 10(12), 1793. doi:10.3390/w10121793.
- Knutti, R., Furrer, R., Tebaldi, C., Cermak, J., & Meehl, G. A. (2010). Challenges in combining projections from multiple climate models. Journal of Climate, 23(10), 2739–2758. doi:10.1175/2009jcli3361.1.
- Li, J., Heap, A. D., Potter, A., & Daniell, J. J. (2011). Application of machine learning methods to spatial interpolation of environmental variables. Environmental Modelling & Software, 26(12), 1647–1659. doi:10.1016/j.envsoft.2011.07.004.
- Lutz, A. F., Ter Maat, H. W., Biemans, H., Shrestha, A. B., Wester, P., & Immerzeel, W. W. (2016). Selecting representative climate models for climate change impact studies: An advanced envelope-based selection approach. International Journal of Climatology, 36(12), 3988–4005. doi:10.1002/joc.4608.
- Mathbout, S., Lopez-Bustins, J. A., Martin-Vide, J., Bech, J., & Rodrigo, F. S. (2018). Spatial and temporal analysis of drought variability at several time scales in Syria during 1961–2012. Atmospheric Research, 200, 153–168. doi:10.1016/j.atmosres.2017.09.016.
- McSweeney, C. F., Jones, R. G., Lee, R. W., & Rowell, D. P. (2014). Selecting CMIP5 GCMs for downscaling over multiple regions. Climate Dynamics, 44(11–12), 3237–3260. doi:10.1007/s00382-014-2418-8.
- Met Office Hadley Centre, (MOHC). (2011). Climate: Observations, projections and impacts. Developed at the request department of energy & climate change by met office Hadley centre, The University of Nottingham, Walker Institute, Centre for Ecology & Hydrology, University of Leads and Tydall Centre.
- Moazenzadeh, R., Mohammadi, B., Shamshirband, S., & Chau, K.-W. (2018). Coupling a firefly algorithm with support vector regression to predict evaporation in northern Iran. Engineering Applications of Computational Fluid Mechanics, 12(1), 584–597. doi:10.1080/19942060.2018.1482476.
- Mohsenipour, M., Shahid, S., Chung, E. S., & Wang, X. J. (2018). Changing pattern of droughts during cropping seasons of Bangladesh. Water Resources Management. doi:10.1007/s11269-017-1890-4.
- Nashwan, M. S., Shahid, S., & Abd Rahim, N. (2018). Unidirectional trends in annual and seasonal climate and extremes in Egypt. Theoretical and Applied Climatology, 136(1–2), 457–473. doi:10.1007/s00704-018-2498-1.
- Noor, M., Ismail, T. B., Shahid, S., Ahmed, K., Chung, E.-S., & Nawaz, N. (2019). Selection of CMIP5 multi-model ensemble for the projection of spatial and temporal variability of rainfall in peninsular Malaysia. Theoretical and Applied Climatology. doi:10.1007/s00704-019-02874-0.
- Onyutha, C., Tabari, H., Rutkowska, A., Nyeko-Ogiramoi, P., & Willems, P. (2016). Comparison of different statistical downscaling methods for climate change rainfall projections over the Lake Victoria basin considering CMIP3 and CMIP5. Journal of Hydro-Environment Research, 12, 31–45. doi:10.1016/j.jher.2016.03.001.
- Pérez-Ruiz, C. L., Badano, E. I., Rodas-Ortiz, J. P., Delgado-Sánchez, P., Flores, J., Douterlungne, D., & Flores-Cano, J. A. (2018). Climate change in forest ecosystems: A field experiment addressing the effects of raising temperature and reduced rainfall on early life cycle stages of oaks. Acta Oecologica, 92, 35–43. doi:10.1016/j.actao.2018.08.006.
- Pour, S., Harun, S., & Shahid, S. (2014). Genetic Programming for the downscaling of Extreme rainfall Events on the east coast of Peninsular Malaysia. Atmosphere, 5(4), 914–936. doi:10.3390/atmos5040914.
- Pour, S. H., Shahid, S., Chung, E.-S., & Wang, X.-J. (2018). Model output statistics downscaling using support vector machine for the projection of spatial and temporal changes in rainfall of Bangladesh. Atmospheric Research, 213, 149–162. doi:10.1016/j.atmosres.2018.06.006.
- Pryor, S. C., Barthelmie, R. J., Clausen, N. E., Drews, M., MacKellar, N., & Kjellström, E. (2012). Analyses of possible changes in intense and extreme wind speeds over Northern Europe under climate change scenarios. Climate Dynamics. doi:10.1007/s00382-010-0955-3.
- Pu, B., & Ginoux, P. (2016). The impact of the Pacific Decadal Oscillation on springtimedust activity in Syria. Atmospheric Chemistry and Physics, 16, 13431–13448. doi:10.5194/acp-16-13431-2016.
- Qutbudin, I., Shiru, M. S., Sharafati, A., Ahmed, K., Al- Ansari, N., Yassen, Z. M., … Wang, X. (2019). Seasonal drought pattern changes due to climate variability: Case study in Afghanistan. Water, 11, 1096. doi:10.3390/w11051096.
- Rahman, M. A., Almazroui, M., Islam, M. N., O’Brien, E., & Yousef, A. E. (2018). The role od lnd usrface fluxex in Saudi-KAU AGCM: Temperature climatology over the Arabian Penninsula for the period 1981 – 2010. Atmospheric Research, 200, 139–152. doi: 10.1016/j.atmosres.2017.10.011
- Sa’adi, Z., Shahid, S., Ismail, T., Chung, E. S., & Wang, X. J. (2017). Trends analysis of rainfall and rainfall extremes in Sarawak, Malaysia using modified Mann–kendall test. Meteorology and Atmospheric Physics. doi:10.1007/s00703-017-0564-3.
- Sa’adi, Z., Shiru, M. S., Shahid, S., & Ismail, T. (2019). Selection of general circulation models for the projections of spatio-temporal changes in temperature of Borneo Island based on CMIP5. Theoretical and Applied Climatology. doi:10.1007/s00704-019-02948-z.
- Salman, S. A., Shahid, S., Ismail, T., Al-Abadi, A. M., Wang, X. J., & Chung, E. S. (2019). Selection of gridded precipitation data for Iraq using compromise programming. Measurement: Journal of the International Measurement Confederation. doi:10.1016/j.measurement.2018.09.047.
- Salman, S. A., Shahid, S., Ismail, T., Rahman, N. B. A., Wang, X., & Chung, E.-S. (2017). Unidirectional trends in daily rainfall extremes of Iraq. Theoretical and Applied Climatology, 134(3–4), 1165–1177. doi:10.1007/s00704-017-2336-x.
- Sarmadi, F., & Shokoohi, A. (2015). Regionalizing precipitation in Iran using GPCC gridded data via multivariate analysis and L-moment methods. Theoretical and Applied Climatology, 122(1–2), 121–128. doi: 10.1007/s00704-014-1292-y
- Schneider, U., Becker, A., Finger, P., Meyer-Christoffer, A., Ziese, M., & Rudolf, B. (2014). GPCC’s new land surface precipitation climatology based on quality-controlled in situ data and its role in quantifying the global water cycle. Theoretical and Applied Climatology, 115(1–2), 15–40. doi:10.1007/s00704-013-0860-x.
- Senthamarai Kannan, S., & Ramaraj, N. (2010). A novel hybrid feature selection via Symmetrical uncertainty ranking based local memetic search algorithm. Knowledge-Based Systems, 23(6), 580–585. doi:10.1016/j.knosys.2010.03.016.
- Shahid, S., Pour, S. H., Wang, X. J., Shourav, S. A., Minhans, A., & Ismail, T. (2017). Impacts and adaptation to climate change in Malaysian real estate. International Journal of Climate Change Strategies and Management, 9(1), 87–103. doi: 10.1108/IJCCSM-01-2016-0001
- Shiru, M. S., Shahid, S., Alias, N., & Chung, E.-S. (2018). Trend analysis of droughts during Crop Growing seasons of Nigeria. Sustainability, 10(871), 13. doi:10.3390/su10030871.
- Shiru, M. S., Shahid, S., Chung, E.-S., Alias, N., & Scherer, L. (2019a). A MCDM-based framework for selection of general circulation models and projection of spatio-temporal rainfall changes: A case study of Nigeria. Atmospheric Research, 225, 1–16. doi:10.1016/j.atmosres.2019.03.033.
- Shiru, M. S., Shahid, S., Chung, E. S., & Alias, N. (2019b). Changing characteristics of meteorological droughts in Nigeria during 1901–2010. Atmospheric Research. doi:10.1016/j.atmosres.2019.03.010.
- Shiru, M. S., Shahid, S., Shiru, S., Chung, E.-S., Alias, N., Ahmed, K., … Sediqi, M. N. (2019c). Challenges in water resources of Lagos Mega City of Nigeria in the Context of climate change. Journal of Water and Climate Change, In press. doi:10.2166/wcc.2019.047.
- Shreem, S. S., Abdullah, S., & Nazri, M. Z. A. (2014). Hybrid feature selection algorithm using symmetrical uncertainty and a harmony search algorithm. International Journal of Systems Science, 47(6), 1312–1329. doi:10.1080/00207721.2014.924600.
- Singh, B., Kushwaha, N., & Vyas, O. P. (2014). A feature subset selection technique for high Dimensional data using Symmetric uncertainty. Journal of Data Analysis and Information Processing, 2(4), 95–105. doi:10.4236/jdaip.2014.24012.
- Solh, M. (2010). Tackling the drought in Syria. Nature Middle East. doi:10.1038/nmiddleeast.2010.206.
- Spinoni, J., Naumann, G., Carrao, H., Barbosa, P., & Vogt, J. (2014). World drought frequency, duration, and severity for 1951-2010. International Journal of Climatology, 34(8), 2792–2804. doi:10.1002/joc.3875.
- St. Cyr, J. F. (2005). At Risk: Natural Hazards, people’s Vulnerability, and disasters. Journal of Homeland Security and Emergency Management, 2(2). doi:10.2202/1547-7355.1131.
- Szerszynski, B., & Urry, J. (2010). Changing climates: Introduction. Theory, Culture and Society. doi:10.1177/0263276409362091.
- Taylor, K. E., Stouffer, R. J., & Meehl, G. A. (2012). An Overview of CMIP5 and the Experiment Design. Bulletin of the American Meteorological Society, 93(4), 485–498. doi:10.1175/bams-d-11-00094.1.
- Terink, W., Immerzeel, W. W., & Droogers, P. (2013). Climate change projections of precipitation and reference evapotranspiration for the Middle East and Northern Africa until 2050. International Journal of Climatology, 18. doi:10.1002/joc.3650.
- Wang, W.-C., Chau, K.-W., Qiu, L., & Chen, Y.-B. (2015). Improving forecasting accuracy of medium and long-term runoff using artificial neural network based on EEMD decomposition. Environmental Research, in Press. doi: 10.1016/j.envres.2015.02.002
- Wilby, R. L., & Wigley, T. M. L. (1997). Downscaling general circulation model output: A review of methods and limitations. Progress in Physical Geography. doi:10.1177/030913339702100403.
- Wilby, R. L., Wigley, T. M. L., Conway, D., Jones, P. D., Hewitson, B. C., Main, J., & Wilks, D. S. (1998). Statistical downscaling of general circulation model output: A comparison of methods. Water Resources Research. doi:10.1029/98WR02577.
- Xiao-jun, W., Jian-yun, Z., Jian-hua, W., Rui-min, H., ElMahdi, A., Jin-hua, L., … Shahid, S. (2014). Climate change and water resources management in Tuwei river basin of northwest China. Mitigation and Adaptation Strategies for Global Change. doi:10.1007/s11027-012-9430-2.
- Ying, X., Xuejie, G., Yan, S., Chonghai, X., Ying, S., & Giorgi, F. (2009). A daily temperature Dataset over China and ItsApplication in Validating a RCM simulation. Advances in Atmospheric Sciences, 26(4), 763–772. doi: 10.1007/s00376-009-9029-z