
 ?Mathematical formulae have been encoded as MathML and are displayed in this HTML version using MathJax in order to improve their display. Uncheck the box to turn MathJax off. This feature requires Javascript. Click on a formula to zoom.
Abstract
In this study, a numerical simulation is applied to investigate the effective factors on the seepage from the earthen channels. To authenticate the information at hand, some of the earthen channels in the Zayandeh-Rud irrigation network in Iran and Gediz watershed in Turkey were studied. 246 numerical models, including different sections of trapezoidal, rectangular and triangular earthen channels, were performed using the finite elements method (FEM). The results showed that, for a numerical simulation, a width of 15 times wider than the top width of the water surface in the channel would be required for the modelling of the left and right lateral boundaries. The comparison of the seepage with empirical relationships showed that the empirical relationships have too much error in the seepage estimation, however, Moritz’s relation with the coefficient of determination (R2) of 0.373 was better than the others. The linear and nonlinear multivariate regression relationships provide a suitable match for the seepage discharge estimation. The wetted perimeter has been distinguished as an effective parameter in the seepage from the channels, yet the channels side slope has a low impact on the seepage.
1. Introduction
In irrigation systems, channels are extensively used to transfer water from the reservoir to agricultural lands. In addition, the conveyance of water through channels might be used to meet industrial and urban needs. In most of the cases, the actual amount of the water at the end of the channel is significantly less than the amount that entered the opening of the water channels, the most important causes of which is the water seepage from the channels. As a result, diagnosing and quantifying the process of seepage from the channels is indispensable in order to protect water resources, manage surface and groundwater, determine the severity of seepage-related loss, and assess the potential technical and fiscal benefits of seepage reduction techniques and technologies (Martin & Gates &, Citation2014). In water projects, in order to increase agricultural products, water conveyance should be based on permissible irrigation system efficiency.
The most prevalent methods to calculate seepage losses from channels mainly include field experiments, empirical formulas, and numerical methods. The field experiment includes the inflow–outflow measurement method, ponding tests, point measurement method and double-ring infiltration test. The first three methods are the widespread ones used at present. The inflow–outflow method is applied to calculate channel seepage losses by measuring the discharge between the cross sections of the channel in upstream and downstream. The privilege of this method over the others is that, in this method, seepage losses can be measured under the normal conditions of the channel. Anyhow, especially for the small amounts of seepage loss from the channels, this method retains lower precision, and satisfactory test results are hard to achieve. Compared to those of the inflow–outflow method, the measurement results of a ponding test are more accurate. The change process of channel seepage losses from initial infiltration to steady infiltration can be observed through a ponding test, and the seepage rate under different water levels can be obtained. The seepage rate can be developed to calculate channel seepage losses during the irrigation season or throughout the year. The significant impediment of the ponding method is the requirement for a heavy workload with higher number of workers resulting in higher overall costs, therefore, it is rarely applied in large irrigation channels and channels with various branches and sharp slopes. The seepage conditions in two ponding and inflow–outflow methods are different and the difference affects the accuracy of the measurement results (Zhang, Chai, Xu, & Qin, Citation2017). Iqbal, MacLean, Taylor, Hecker, and Bennett (Citation2002) conducted a study to estimate seepage losses from unlined irrigation canals in 13 irrigation districts in southern Alberta, Canada. The ponding method for measuring the rate of seepage from canals was applied to determine seepage losses at 29 sites in the irrigation districts. Poly-lined earth plugs at both ends of 150 m long straight canal segments were used in this method. The reaches were filled with water to their operational depth, and the drop of water from full supply level to 80% of the designed depth was recorded. The annual seepage within the irrigation districts in 1999 was about 91 × 106 m3 of water. Eshetu and Alamirew (Citation2018) investigated the seepage loss through lined and unlined irrigation canals of Tendaho sugar estate, Ethiopia. Seepage losses were determined by inflow-outflow method for primary, secondary, and tertiary canals, while water velocity was determined using a current-meter. The average seepage losses were resulted in 0.55% per 100 m (0.0126 lit/s/m2) for lined primary canals and 0.84% per 100 m (0.0180 lit/s/m2) for unlined primary canals. Seepage loss for secondary and tertiary canals was obtained 3.65% per 100 m (0.0391 lit/s/m2) and 4.27% per 100 m (0.0248 lit/s/m2), respectively.
Noori Mohammadiyeh, Sohrabi, and Rahimi (Citation2010) studied the experimental methods of Ingham, Davis Wilson, Moleswerth and Yennidumia, Misra and Moritz about water losses in the earthen channels. Results revealed that, among the experimental methods, Misra and Moritz’s methods indicate more accurate results to estimate seepage rate in The Qazvin Plain, Iran.
Applying the numerical method of finite-difference, Swamee and Kashyap (Citation2001), determined the amount of seepage from the channels while the groundwater level was at an infinite depth. Their research resulted in generating diagrams, on which, later, Kacimov (Citation2003) elaborated in more details. Salemi and Sepaskhah (Citation2006) reviewed the empirical equations on Borkhar Plain in Isfahan province, Iran to estimate the water seepage from the earthen channels in the irrigation network. They noticed that the most appropriate equations to estimate water seepage from the channels of this irrigation network are first the Davis-Wilson’s equation, and then Moleswerth and Yennidumia’s formula. Bahramlu (Citation2011) studied seepage losses from the irrigated channels with rock-cement and concrete lining in cold regions and their impact on water resource reserves in Hamedan province, Iran. The results displayed there is no significant difference between the average losses of seepage from the concrete channels and rock-cement cover.
An analytical method to evaluate the seepage from trapezoidal channels was applied by Chahar (Citation2007). Based on his studies, the method is effective in determining the seepage rate and it is possible to obtain the amount of artificial recharge of groundwater from the trapezoidal channels. Kinzli, Martinez, Oad, Prior, and Gensler (Citation2010) applied ADCP (Acoustic Doppler Current Profilers) device to estimate the seepage rate from the irrigation channels. Based on the geometric characteristics of the channels and the flow velocity, they estimated the rate of the seepage from the channels. Pognant, Canone, Previati, and Ferraris (Citation2013) applied the electromagnetic induction method to measure seepage from the irrigation channels, and the results indicated that this method is suitable for estimating the seepage rate in field surveys.
Swamee, Mishra, and Chahar (Citation2000) applied the relationships, expressed by Harr and Morl-Sytoks, to discover an explicit relationship to calculate the amount of seepage from the channels, which they used in nonlinear optimization of the channel cross section to minimize seepage losses. They analyzed the economic design of the channel and examined the cost of penetration and evaporation losses. Afterwards, based on another relationship, other than those of Manning’s, they optimized the channel design.
Wachyan and Rushton (Citation1987) investigated the effect of hydraulic conductivity on channel seepage. In their study, the soil with lower hydraulic conductivity was laid under the soil with higher hydraulic conductivity. They concluded that if the bed of the channel is lined and the walls are without lining, the seepage is reduced by 4% compared to the unlined form, and if the walls are lined and the bed is unlined, the seepage is reduced by 2% compared to the unlined state. Not only the water seepage is an important issue in the irrigation canals’ conveyance, but also it is an essential factor in the designing of hydraulic structures. Seepage from channels is related to some factors which Akkuzu (Citation2012) provided in his study where he introduced empirical equations.
High seepage rate may cause piping or undermining in the hydraulic structures. This can be controlled by using filters in downstream of the structure (Ahmed, McLoughlin, & Johnston, Citation2015). Another solution for reducing the piping (undermining) is to use cutoff walls under the structure (Jain & Reddi, Citation2011).
Numerical simulations reduce the cost of laboratory operation testing and equipment by using governing equations with specific boundary conditions. For example, Gabl and Righetti (Citation2018) suggested an asymmetric orifice that can be added to a surge tank of a hydro power plant to reduce the mass oscillation. They used the ANSYS-CFX software. In the study of Quezada, Tamburrino, and Niño (Citation2018), a numerical modeling of pile scour is performed due to the action of unsteady currents and oscillatory flow greens, using 3D Reynolds averaged Navier–Stokes (RANS) equations for the hydrodynamic description. Farhadi, Mayrhofer, Tritthart, Glas, and Habersack (Citation2018) applied three variants of two-equation models, i.e. the standard k-ϵ model and two variants of k-ω models, to tackle mean flow and turbulence in a racetrack flume and a river reach.
Jafari, Salmasi, and Abraham (Citation2019) conducted a numerical investigation of granular filter under the bed of a canal to study the uplift force below of canal bed. They found that the application of drain pipes with granular filter envelope can reduce uplift force significantly and this is a positive effect. Another study about the application of drain pipes under the canal bed was carried out by Salmasi, Khatibi, and Nourani (Citation2017). They investigated the reduction of uplift forces by longitudinal drains with underlined canals.
Seepage problems can reduce the stability of earthen slopes in both canal side slopes and embankment dams. For embankment dams application of suitable filter materials can facilitate in reduction of pore water pressure (Salmasi & Jafari, Citation2019), upstream semi-impervious blanket can reduce seepage amount from embankment dams (Salmasi & Nouri, Citation2019). Salmasi, Mansuri, and Raoufi (Citation2015) carried out a numerical simulation to measure the effect of relief wells for decreasing uplift in a homogeneous earth dam. Effective variables were relief wells diameter, space from each other and distance from the embankment toe. In addition, hydraulic conductivity ratio (Kx/Ky) has critical effect on seepage problems. For example, Salmasi and Mansuri (Citation2014) investigated the effect of homogeneous earth dam hydraulic conductivity ratio with horizontal drain on seepage.
In gravity dams, application of vertical drains have shown a positive effect in the reduction of pore water pressure. Nourani, Salmasi, Abbaspour, and Oghati Bakhshayesh (Citation2017) conducted a numerical investigation of the optimum location for vertical drains in gravity dams.
Over the past few years, various researchers have provided empirical relationships for calculating the seepage of water from the channels. Following there are four famous ones:
Davis and Wilson suggested the following empirical equation for calculating seepage discharge from the channels (Kraatz & Mahajan, Citation1975):
(1)
(1) In Equation (1), the value of the coefficient C varies from one to 70 depending on the channel cover and is equal to 1.0 for the concrete channels. Parameter Pw (m) is wetted perimeter, L indicates length of the channel (m), V is average velocity in the channel (m/s), HW shows depth of water in the channel (m) and q is seepage from the channel along the channel length (m3/s).
Moritz proposed Equation (2), according to the studies by the US Department of Land Reclamation, to estimate the seepage losses (Kraatz & Mahajan, Citation1975):
(2)
(2) where C is a constant coefficient and for clay and clay loam soil it is 0.41, and for sandy loam it is 0.66. Parameter q indicates the channel seepage rate of one kilometer (m3/s), V is the velocity of the water in the channel (m/s), and Q is the amount of water seepage (m3/s) from the channel.
Equation (3) is the relationship between the Moleswerth and Yennidumia used by the Egyptian Irrigation Authority to estimate seepage from the channels (Kraatz & Mahajan, Citation1975).
(3)
(3) In Equation (3), q is the amount of the water seepage (m3/m2 day), R is the hydraulic radius (m), and C is the constant coefficient which is 0.0015 for clay soils and 0.003 for sandy soils.
Equation (4) is from Ingham (Kraatz & Mahajan, Citation1975).
(4)
(4) where q is the amount of the seepage (m3/s), P is the wetted perimeter (m), L is the channel length (m), H is the depth of the water in the channel (m) and C is the coefficient, depending on the type of the soil. The value of the C varies between 1.5 and 5.5.
According to the previous studies, the existing empirical relationships are inadequate due to the wide range of constant coefficients in these equations. Most often, the coefficients of these equations are defined for that specific local conditions and they have to be calibrated again for another condition. Using soil hydraulic conductivity as a variable in this study makes a constant coefficient (C) inessential for empirical relationships. The present study implements numerical simulation of seepage from earthen channels using finite elements method (FEM). Verification of the numerical model is obtained from the available data from some of the Zayandeh-Rud irrigation channels (Isfahan province, Iran) and Gediz watershed, Turkey. The effect of the distance of the left and right boundaries from the center of the channel on the amount of seepage is studied as well. As a result, to make a space between the left and right boundaries of the channel center, where the water exchange is reduced to zero, is recommended, which has not been talked about in the previous studies. In order to study the seepage loss from the channels, the left and right distance from the channel center line as well as boundary conditions must be understood well. Three trapezoidal, rectangular and triangular sections are investigated for the seepage of the channels and 246 numerical models are constructed. Most of the channels (including natural or manmade) can be approached with these three shapes of channels. Hereinafter, regression relations of non-dimensional factors are presented to make the numerical model findings more applicable to predict avoidable seepage. The accuracy of the regression relations is comparable from two sets of available data from Zayandeh-Rud irrigation channels in Iran and Gediz irrigation channels in Turkey.
This investigation is aimed to enhance the knowledge and improve the management of the earthen channels. The essential parameters in the seepage from unlined channels are considered in this study which are: the channel wetted perimeter (P), the depth of the water in the channel (y), the width of the channel water surface (W), the width of the channel bed (b), the hydraulic radius (R), the cross-sectional flow (A), the channel side slope (z) and the soil hydraulic conductivity (K) below the channel.
2. Material and methods
2.1 Field measurement data
Field measurement data are from (i): Zayandeh-Rud irrigation channels (Isfahan province, Iran) including 7 channels, and (ii): Menemen Plain in Gediz watershed, Turkey including 5 channels. Some information about these two irrigation networks are presented in the following:
The Zayandeh-Rud, the lifeline of Esfahan, originates in the Zagros Mountains and flows southeast, where it dissipates in the saline of Gavkhuni Swamp. The main river of the central Iranian plateau, along with its tributaries, waters an area of 107,000 ha. The river’s length is about 270 km and its width varies from 10 to 800 meters. Modern surface irrigation started with the construction of major diversion weirs at Nekouabad and Abshar, each diversion weir controlling both a left bank and right bank main canal (Figure ). The main canals have been designed for automatic upstream control, so that canal water levels are maintained at a constant level irrespective of the actual demand. Typically, there is a two-season cropping pattern in all of the irrigation systems in the Zayandeh-Rud basin. Summer crops include potatoes, rice, onion, and vegetables while winter crops are dominated by wheat, barley and vegetables. In addition, there are some annual and perennial crops, including alfalfa, orchards and sugarcane.
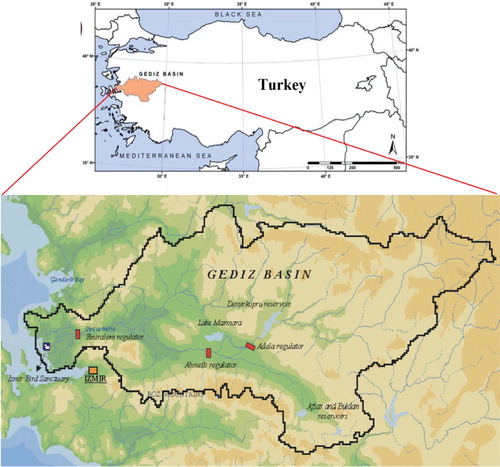
The Menemen Plain is located in the basin of the Gediz River in western Turkey. It is watered by the Gediz River and its branches, which empty into the Aegean Sea. The greater part of the soils of the plain have a medium to medium-heavy structure (Akkuzu, Citation2012). The plain has a Mediterranean climate, with hot dry summers and cool wet winters. The main crops are cotton and maize, and grapes, citrus, cereals, and vegetables are also grown. The Menemen Plain irrigation system covers a net area of 22,865 ha (Figure ). Water diverted from the Emiralem Regulator on the Gediz River to the irrigation system of the Menemen Plain is distributed through the right and the left bank irrigation networks.
Figure 1. Location and main irrigation schemes in the Zayandeh–Rud Basin, Iran.
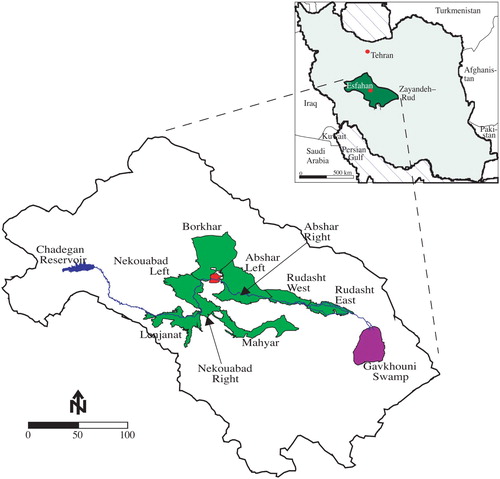
Figure 2. General plan of the Gediz basin, Turkey.
2.2 Dimensional analysis
Various factors influence seepage from the earthen channels. These factors include channel geometry and hydraulic condition of the channel. According to the Equation (5), the seepage discharge per channel unit length is supposed as (qs) and is a function of the wetted perimeter (P), the depth of the water in the channel (y), the width of the channel water surface (W), the width of the channel bed (b), the hydraulic radius (R), the cross-sectional flow (A), the channel side slope (z) and the soil hydraulic conductivity (K) under the channel. In this study, the depth of the groundwater is assumed to be at a lower level compared to the channel bottom level, and therefore, it would have no effect on the seepage. It means, the groundwater is extremely deep and this is the case in many arid lands such as Zayandeh-Rud irrigation network in Iran and Gediz irrigation network in Turkey.
(5)
(5) Using the Buckingham’s theory, the dimensionless equation can be presented as follows:
(6)
(6) Since the hydraulic radius is equal to the result of dividing the cross-sectional area of the flow into the wetted perimeter (R = A/P), the dimensionless parameter A/y2 can be eliminated, but it is necessary to keep P/y. On the other hand, in calculating the water surface width, i.e. w = b + 2zy, w = 2zy, w = b, for the trapezoidal, triangular and rectangular channels, respectively, the factors of y, z and b have been used and these variables are present in the wetted perimeter. Thus, the dimensionless parameter w/y is also eliminated from the Equation (6). As a result, the equation will be:
(7)
(7) In this study, 246 models including different sections of trapezoidal, rectangular and triangular irrigation cross section of the channels were implemented in SEEP/W software. The influence of the soil hydraulic conductivity was used in these numerical models.
It is worth noting that, in order to simulate the movement of water in the soil for a non-saturated porous medium, in the SEEP/W software, it is necessary to know the soil moisture curve, i.e. the relationship between suction and soil moisture (or the suction and the hydraulic conductivity of the soil). But to simulate water flow in a saturated media only the hydraulic conductivity of the saturated soil is required. Obviously, modeling in the saturation mode is much uncomplicated than non-saturated mode and it requires less data. On the other hand, it can be assumed that after some time, the flow of water into the earthen channel reaches to the saturated state. This implies that the seepage from the body and the bed of the channel can be assumed as like the saturated condition. Accordingly, in this study, the saturation condition is modeled and the saturation hydraulic conductivity is applied in all numerical simulations.
2.3 Introducing the FEM method
The SEEP/W software is based on the finite elements method. The finite elements numerical methods are based on the concept of dividing a structure into small pieces describing the behavior or function of these elements, and then connecting the elements to model the entire structure. This process is called meshing. Meshing is one of the three main aspects of the finite elements modeling and the two other ones are material properties and the definition of boundary conditions. Discharge in the soil follows the Darcy’s law:
(8)
(8) where q is discharge seepage (m3/s), K is permeability coefficient (m/s), A is the cross section of the water flow (m²) and ∂h/∂x indicates the hydraulic gradient (m/m) of the flow.
The equation governing the flow of the water in a porous medium is the Poisson’s equation, which is the generalized form of the famous Laplace’s equation:
(9)
(9) where
and
are respectively the hydraulic conductivity of the soil in both horizontal and vertical directions (m/s), h is the water potentiality in the soil (m), and q indicates the flow rate of the inlet or the outlet to the soil mass (m3/s per unit area). Equation (9) is applicable for the steady state flow. For the unsteady flow the equation is:
(10)
(10) in which
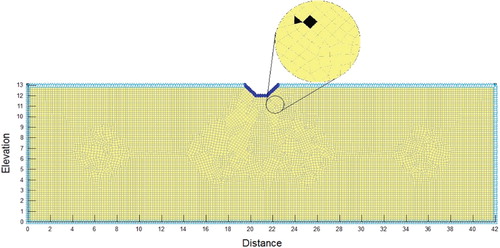
is the volumetric changes in humidity relative to time. Solving the Poisson’s equation is one of the most complex mathematical problems. The SEEP/W software solves the Poisson’s equation employing the finite element method. In this study the elements of Quads & Triangles have been applied (Figure ). In simulated earthen channels the total number of meshes are from 19450 to 51674. In general, the average size of the elements are 0.2 meters.
Figure 3. Cross section of the trapezoidal channel and the elements around it with 3 or 4 nodes.
2.4 The boundary conditions
Having defined the meshing and the permeable substrate materials, the boundary conditions were defined in the model. Boundary conditions are the conditions governing the boundaries of the studied area. The geometric boundaries of a flow system are usually associated with unspecified conditions that are replaced by straight lines, exponential curves, circular arcs, or other mathematical expressions.
In general, the boundary conditions can be divided into two categories:
Boundaries with the specified potential
The boundary with the specified input-output discharge or with the specified hydraulic gradient
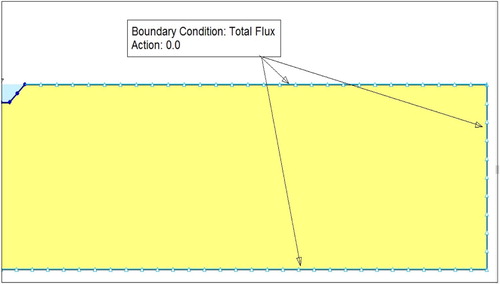
How to apply the boundary conditions in a channel is shown in Figures and in this study. The bottom of the channel and the channel walls have the boundary conditions of specified potential (Head = 13 m). The boundary conditions of the model walls and the bottom of the model, assuming they are not penetrating, are of the type ‘Total Flux’ and their value is zero.
Figure 4. Definition of the boundary condition for the channel bed and the lateral walls in the trapezoidal cross section.
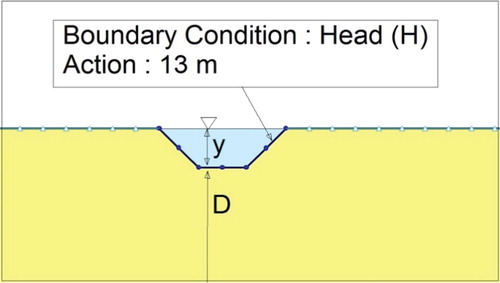
Figure 5. Impermeable boundary conditions for the bed and side wall of the trapezoidal channel model (half of the channel is seen in the left).
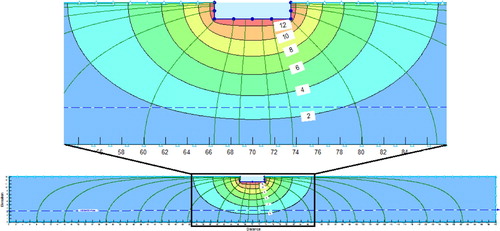
The velocity vectors represent the amount and the direction of the velocity of the water and the flow lines represent the direction of the movement of the water within the porous medium from one point to another. Figures and show flow lines and the velocity vectors in a numerical model of the trapezoidal channel respectively. Similarly, Figures and represent the potential lines and the flow lines and the amount of seepage generated by the model analysis in the rectangular and triangular earthen channels.
Figure 6. The flow lines and the potential curves in the trapezoidal channel model.
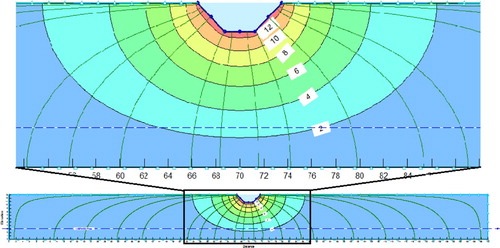
Figure 7. The velocity vectors and the potential curves in the trapezoidal earthen channel model
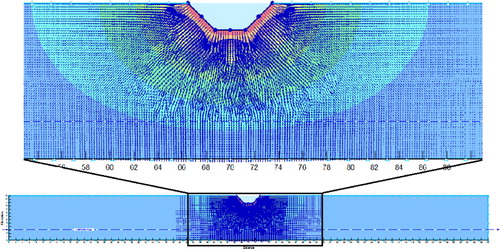
Figure 8. The flow lines and the potential curves in the triangular earthen channel model
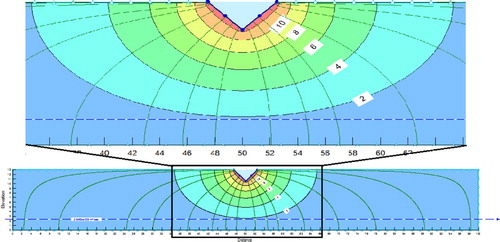
Figure 9. The flow lines and the potential curves in the rectangular channel model
2.5 Evaluation criteria
According to the Equations (11) and (12), the statistical analysis of the coefficient of determination (R2) and the root mean square error (RMSE) were compared between numerical and experimental methods for estimating the seepage rates.
(11)
(11)
(12)
(12) where, the Pi and Oi are simulated and measured variables, respectively, and
and
are the mean values of the simulated and the measured, and n is the total number of data. The lower the RMSE indicator and the higher the R2 value, the more accurate the method will be.
3 Results and the Discussion
3.1 Studying the effect of the lateral boundaries
In numerical studies of the irrigation channels for seepage problems, a lateral distance from the right and left sides of the channel cross section should be considered. One of the aims of this study is to recommend the amount of distance in which the water exchange rate would be reduced to zero. This threshold distance is required in order to select the suitable right and left boundaries in numerical simulations. For this purpose, 20 models of the trapezoidal channels and 24 rectangular channel models are considered. According to Figure , a trapezoidal channel with the hydraulic properties, the water surface width (W) of 3 m, the channel bed width of 1 m, the water depth of 1 m in the channel, and side slope of the channel as 1:1 (H:V) are considered. The method of study is that the lateral boundary from the center of the channel is considered as a coefficient of channel width (). Equation (13) is presented to calculate the error and find the appropriate lateral boundary distance for the situation where the error rate is minimal.
(13)
(13) where Qn is the seepage discharge flux of the model n and Q20 is the seepage flux of the 20th model (the model with the highest boundary width).
Figure 10. The recommended lateral distance in the trapezoidal channel for determining boundary condition.
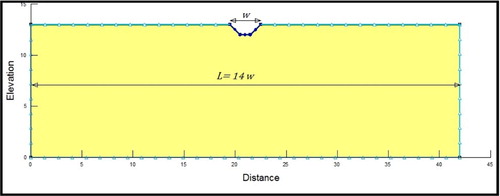
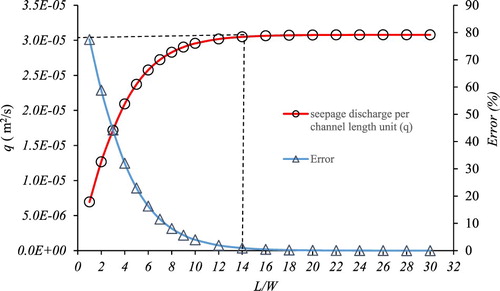
Figure shows the variations in seepage and error rates relative to the coefficient L/W in the trapezium section. According to the calculations, the state L/W = 14 in model 12 is acceptable with error less than 1%, and therefore, it is recommended in future studies to consider the distance between the lateral boundaries in trapezoidal channels to be 14 times the width of the water channel surface. This value was obtained for the rectangular channels 15 times the width of the water channel surface.
Figure 11. The seepage and error changes relative to the L/W in the trapezoidal section.
3.2 Numerical simulation performance verification
To verify the accuracy of the SEEP/W software, data from some of the Zayandeh-Rud Irrigation network channels was used (Table ). The side slope of the studied channels was very close to each other. The input-output flow measurement method was applied to calculate the seepage over the channel. For this purpose, a specific distance along the channel was designated and then the flow velocity at the starting and ending points of the above mentioned distance with the velocity current meter in different sections was measured; ultimately, having the cross-sectional flow of the inlet and outlet, their discharge was obtained. The average hydraulic characteristics of the selected channels from 22 May to 21 June are given in the Table . The hydraulic conductivity listed in the Table has been obtained from the general information, including the sandy clay soil texture, of the studied earthen channels. Furthermore, the fixed coefficient C used in the empirical equations is given in the Table . Only the earthen channels were investigated in this study and the hydraulic conductivity of the channel lining and the soil are the same and they are assumed to be equal to 2 × 10⁻⁵ m/s, which is approximately equal to the average of the hydraulic conductivity listed in the Table (equal to 0.72 cm/h).
Table 1. Geometric and hydraulic parameters studied.
Table 2. The statistical information of the channels in the irrigation network of Isfahan province, Iran.
Table 3. The value of the constant coefficient C in the experimental equations (Bahramlu, Citation2011).
In the Table , the statistical parameters obtained from different methods of estimating seepage from the Zayandeh-Rud irrigation network are presented. It is obvious that the experimental methods of Davis Wilson, Moleswerth & Yennidumia, Moritz, and Ingham did not have a satisfactory seepage estimation accuracy, while the Moritz’s method demonstrated a better performance compared to the other methods. The comparison between the SEEP/W model and the seepage measurement data in the Zayandeh-Rud irrigation network channels (Isfahan, Iran) indicates the accuracy of the SEEP/W numerical model (the last row of the Table ). It should be mentioned that in order to obtain the numbers of the second and third columns of the Table the characteristics of soil texture of the Zayandeh-Rud irrigation network channels were used. Thus, using the Tables presented for the experimental relationships, the seepage discharge was obtained. It has been refrained from presenting tables for each of the empirical relations for the sake of brevity.
Table 4. The statistical parameters obtained from different methods of estimating seepage from the earthen channels (Salemi & Sepaskhah, Citation2006).
3.3 The effect of the wetted perimeter on the seepage discharge of the channels with different sections
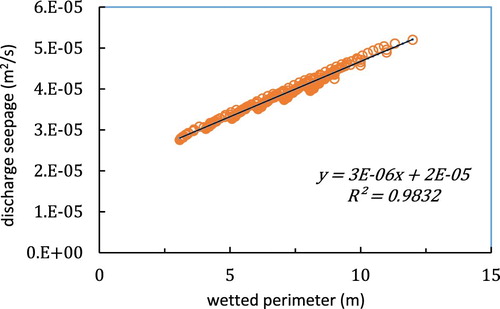
Due to the fact that the water seep occurs from the wetted perimeter of the channel, it seems that there should be a relation between the discharge seep and the wetted perimeter. In Figure , the results of the numerical simulation of 246 channels with different trapezoidal, triangular and rectangular sections and with different hydraulic characteristics are presented. According to Figure , there is a linear relationship with the coefficient of determination of 0.98 between the wetted perimeter of channel (in meters) and the seepage rate of the bottom and side walls (m3/s per channel length unit).
Figure 12. The effect of the wetted perimeter on the seepage discharge in different trapezoidal, rectangular and triangular sections.
Correlation analysis between existing variables and discharge seepage gives some appropriate information about how data is communicated. Table shows the results of the correlation analysis of the data used in this research in SPSS software. As it is indicated in the Table , the parameter z has the lowest correlation with the seepage discharge, which can be seen in the Figure . There is a weak linear relationship with the coefficient of determination of 0.08 between the side slope and the seepage discharge. The sign (**) in the Table indicates that there is a significant correlation between the parameters and 99% of the data (Sig. <0.01) apply to this correlation.
Figure 13. The relationship between the side slope (z) and the dimensionless seepage (qs/ky) for the trapezium, triangular and rectangular sections.
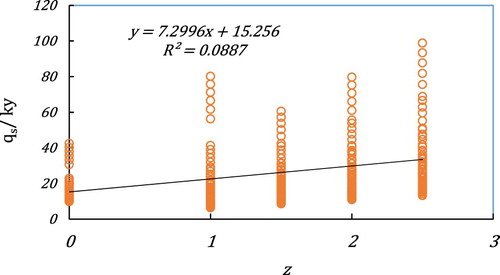
Table 5. The correlation matrix between the dimensionless parameters used for the different cross sections.
In this study, the significance level (Sig.) of 1% is considered in the Table . The significance value is also known as P-Value. The term ‘statistically significant’ is a measure that helps us determine whether the correlation between two factors is really reliable or just happens accidently. When a relationship is statistically ‘meaningful’, it’s likely that less than 1% of the relationship was due to an accident; that is, if the research is repeated, it will eventually lead to a 99% probability. When the result of a correlation test is 99%, it is remarked that the result is statistically significant.
Equation (14), the linear regression equation for non-dimensional seepage discharge with a coefficient of determination of 0.925, root mean square error (RMSE) equal to 4.978 for different trapezoidal, rectangular and triangular sections was obtained for the irrigation channels.
(14)
(14) In the Table , the coefficients of the regression Equation (14) obtained from SPSS software are presented. This Table is a benchmark for analyzing the sensitivity of the factors.
The standard error (Std. Error) is applied to estimate the approximation of the sample mean to the population mean. In other words, standard error (SE) is the standard deviation of a Statistical Sampling Distribution that is applicable in estimating the standard deviation obtained from a number of samples, and it is calculated through Equation (15):
(15)
(15) where SE is the standard error, s is the standard deviation of the sample, and n is the total number of samples (whose value in the current study is 246).
The value of t (in the column before the last one in the Table ) measures the value of the difference with respect to the variability obtained from the samples. In other words, t is equal to the calculated difference divided by the standard error (SE). The higher the value of t in the positive or in the negative direction is, there will be a greater possibility of ruling out the null hypothesis (zero assumption means there is no significant difference).
Table 6. The coefficients for the variables obtained by SPSS software for the different channel sections.
Table 7. The coefficients of the variables in Equation (16) obtained by SPSS software for trapezoidal, rectangular and triangular sections.
Table 8. The calibration and verification results of the linear and nonlinear regression model.
According to the Table , it is indicated that the standard error (Std. Error) of the p/y and b/y factors have the lowest value, and therefore, these two factors have a fundamental role in the fitted equation. The standard error of the R/y factor shows that this factor is less important than the other two above mentioned factors in the equation fitted, which corresponds to the correlation matrix of Table . Likewise, (Sig <0.01) confirms that 99% of the data apply to this fit.
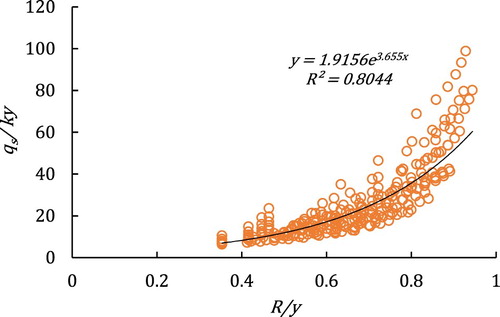
Figures – provide the relationship between nonlinear multivariate regressions for the seepage discharge. It is explicit that the relation between and P/y and b/y is linear but with the R/y it is exponential.
Figure 14. The relationship between qs/Ky and P/y for different channel cross sections.
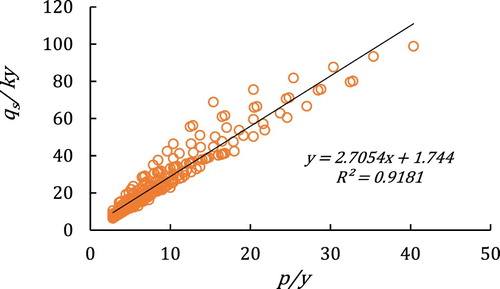
Figure 15. The relationship between qs/Ky and b/y for different channel cross sections.
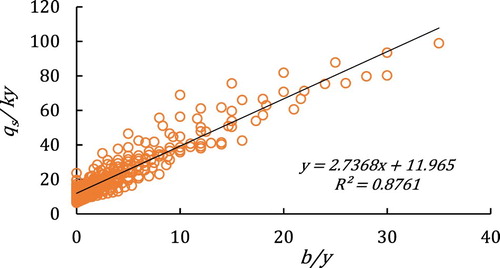
Figure 16. The relationship between qs/Ky and R/y for different channel cross sections.
The nonlinear multivariate regression equation for the discharged seepage was obtained as the Equation (16), with a coefficient of determination of 0.927 and root mean square error (RMSE) of 4.908 for different trapezoidal, rectangular and triangular sections of the irrigation channels. In addition, the nonlinear equation (16) is slightly more accurate than the linear equation (14). However, due to the comfort of the linear equation in calculating and finding the seepage rate of channels, this study suggests using the linear equation. It should be noted that Equation (14) is valid in the range of ,
,
,
.
In the Table , the coefficients of the variables in Equation (16) obtained by SPSS software for the trapezoidal, rectangular and triangular sections are presented.
For calibration and verification of Equations (14) and (16), 70% of the dimensionless parameters were considered as calibrated data and the remaining 30% as test data. The Table shows the results of the calibration and verification steps of a linear and non-linear multivariate regression model for the dimensionless seepage flows. The results of this Table indicate that both linear and nonlinear multivariate regression models have both desirable performance and there is no significant difference between the calibration and verification steps. From the two linear and nonlinear regression equations, although they are not significantly different in terms of performance, considering the convenience of working with it, the linear regression relationship (14) has been chosen as the best relation.
In Figure , the changes of which are calculated by SEEP/W are compared to
calculated by Equation (16). It is shown that, the regression equation is fitted in such a way that it estimates the value of
close to the value of numerical simulation.
Figure 17. The comparison of qs/Ky with two methods: SEEP/W versus Equation (16).
Equation (17) shows nonlinear regression to examine the effect of z on the seepage discharge with a coefficient of determination of 0.928.
(17)
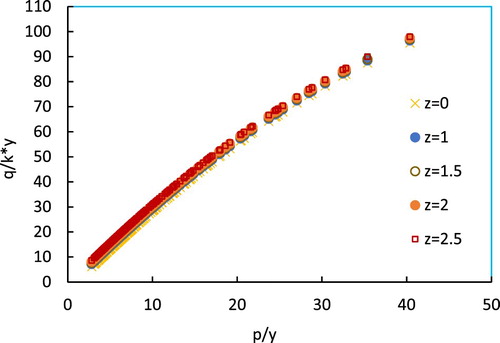
(17) Figure shows the relationship between
and
for different z values based on the Equation (17) at different intervals. As the Figure shows, with increasing the ratio
for a constant side slope, the relative seepage discharge rate
increases nonlinearly. In addition, the slighter slop of the channel walls partially increases the seepage rate. This means that the value
for z = 2.5 is greater than the value for z = 1.
Figure 18. The relationship between and
for different z in the different channel sections.
According to the Table , the second-order polynomial relation, with high precision, can be crossed between points. It should be noted that the relations presented in the Table provide regression equations to estimate qs/Ky for the different side slopes of the trapezoidal, triangular and rectangular channels. In terms of the coefficient of determination, the rectangular channel is more consistent with the relation of z = 0, but the side slope has the lowest RMSE error, z = 1.5. Moreover, according to the RMSE statistical parameter, it can be concluded that the average side slope, such as z = 1, 1.5, and 2, is more accurate in the calculations.
Table 9. The non-linear regression relationship between P/y and qs/Ky for different z values for 3 different cross sections.
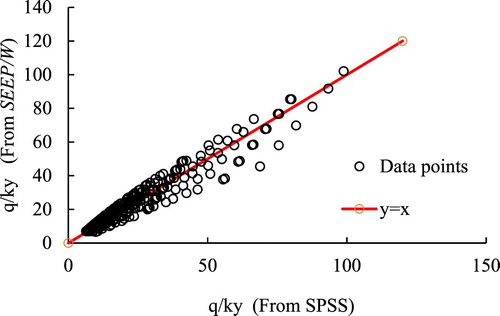
In Figure , the changes of qs/Ky calculated by SEEP/W are presented compared to qs/Ky calculated by Equation (17) using SPSS. As in Figure , it is shown that, the regression equation is fitted in such a way that it estimates the value of qs/Ky close to the value of numerical simulation. The points around the y = x line and near to it are scattered, which indicates the correctness of the regression model.
Figure 19. The comparison between qs/Ky with the two methods, SEEP/W versus regression relation (17).
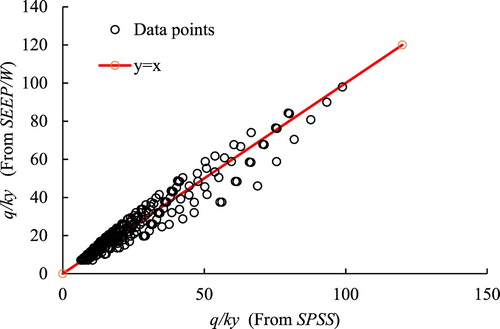
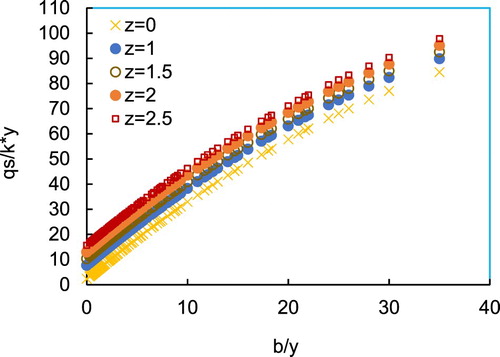
Figure shows the relation between b/y and qs/Ky in different values of z for different trapezoidal, triangular and rectangular cross sections based on Equation (18). Equation (18) is a nonlinear regression relation with a coefficient of determination of 0.929.
(18)
(18) As shown in Figure , by increasing the b/y ratio for a constant side slope, the relative seepage discharge (qs/Ky) increases in nonlinear form. Additionally, the slighter the side slope becomes, the more the seepage rate increase; that is, the seepage for the value z = 2.5 is greater than the seepage for z = 0. This was already proved in Figure , which is also in accordance with the study of Subramania. According to Subramania’s study, for a given amount of b/y, while the bed is with lining but the side walls are unlined, the side slope has a huge impact on the seepage discharge, in such a way that, the less the channel angle β is (steeper side slope, z), the greater the seepage discharge would be. Angle ß is the angle between the channel sidewall and the channel floor (Bayrami, Citation2009).
Figure 20. The relationship between b/y and qs/Ky via z in different channel sections.
3.4 Comparison with other studies
Many equations and experimental methods have been provided to estimate the amount of the water seepage from the channels in different countries. In this study, the results obtained through the calculation of the seepage discharge applying some of these relations comparing to the results of the trapezoidal cross-sectional simulation have been investigated. The reason for choosing a trapezoidal section is that the relationship by Swamee et al. (Citation2000), as well, has discussed the seepage in a trapezoidal shape (underground water at the infinite depth).
Table shows the comparison of the statistical parameters, obtained from the experimental methods of Swamee et al. (Citation2000) and Muskat (Fotouhi & Hosseini, Citation2007), with the linear regression (Equation 14). According to the Table , the correlation coefficient of the linear regression obtained from this study is equal to 0.925 and also has a lower RMSE (4.978), which indicates the high accuracy of this equation.
Table 10. The statistical parameters obtained from different methods of estimating the seepage in the trapezoidal cross sections
The other comparison is based on available data from 5 channels in Akkuzu (Citation2012) studies. These channels are located in western Turkey in the Gediz watershed. The geometric and hydraulic characteristics of these channels are presented in the Table . In the last column of the Table , the seepage measured by the basin method of these 5 channels is presented. Additionally, the seepage discharge in the Table is based on three methods of the linear Equation (14) obtained from this study: the method of Swamee et al. (Citation2000), Muskat’s (Citation1937) method, and their relative error rate.
Table 11. The geometric and hydraulic properties of 5 channels in Akkuzu (Citation2012)’s studies
The hydraulic conductivity of the sub-channel soil is presented in the second column of the Table for 5 sections of the main channels of Turkey. The soil texture varied from medium to medium-heavy. Meanwhile, the hydraulic conductivity for the two equations between Swamee et al. (Citation2000) and Muskat (1982) and the proposed Equation (14) are assumed to be the same.
In the Table , the relative error is the value obtained from subtracting the seepage amount generated by the equation from the measured amount divided into the measured seepage amount. The maximum error in estimating the seepage discharge from the channel using Equation (14) of this study is 12.5%, for Swamee et al. (Citation2000) it is 62.6%, and for Muskat’s method it is 64.9%. This shows the higher accuracy of the Equation (14) in this study. It seems that one of the most effective factors for the higher accuracy of the proposed relation (Equation 14), in this study, is a dampened channel environment parameter which is not existing in other two equations.
Table 12. The seepage rate calculated and error based on 3 methods: the linear equation obtained from this study, the method of Swamee et al. (Citation2000), and Muskat (1982).
However, a more inclusive measurement database is required in order to have finer assessment regarding the matching of regression relations with the real time, in which the accuracy of the mathematical relations is evaluated in various regions with different soils. In this research, the authors had only access to two field measurements of Akkuzu’s (Citation2012) studies in Turkey and Rustamian and Abedi Kupayi’s (Citation2012) studies on the Zayandeh-Rud irrigation network in Isfahan, Iran.
4. Conclusions
In this study, the method of finite elements (FE) is employed to determine the seepage discharge from the earthen channels. Field data are also used for the numerical simulation verification. A total of 246 numerical models are constructed for trapezoidal, rectangular and triangular sections. These are the common and regular shapes for water conveyance with channels. The results are as follows:
In order to prevent the impact of the lateral boundaries on the seepage discharge, a width range of 15 times wider than the width of the water surface in the channel will be required for numerical simulation with FE. This much of extending the right and left boundaries distance guarantees the accuracy of the numerical simulation.
The comparison of the seepage discharge with the empirical relationships showed that the empirical relationships have too much error in the seepage estimation, although the Moritz’s relation with the smaller RMSE (12.356) and the larger determination coefficient (0.373) were better than the rest. This proves that every empirical relationship, principally, depends on its local condition.
The numerical simulation shows that there is a strong linear relationship with the coefficient of determination of 0.98 between the wetted perimeters (P) and the seepage discharge from the bottom and the walls of the channels.
The linear multivariate regression relationship provides a suitable match for estimating the seepage flow. In the linear equation, the coefficient of determination (R2) is 0.925 and the root mean square error (RMSE) equals to 4.978 for different trapezoidal, rectangular and triangular sections of the irrigation channels. The provided linear regression relationship correlates qs as a dependent variable vs. P, R, b, and K as the independent variables.
Hydraulic conductivity (K) plays a critical role in estimating the amount of the seepage from the channel.
The comparison between the numerical simulation (or the derived regression equation) with the measured field data showed that the average difference between these two methods is 5.42% (Table ). This value is less than the existing empirical relationships.
This study considers the main essential hydraulic parameters in the seepage from the unlined channels. Other minor parameters are groundwater depth and non-isotropy of the soil. For the future studies, the effect of groundwater depth (under the channel bed) and also non-isotropy of the soil on the seepage discharge from the channel are recommended. Kx ≠ Ky is the case with the recent study and it will have the impact on the amount of seepage. The comparison between the derived regression equations with more field measurements would be helpful.
Disclosure statement
No potential conflict of interest was reported by the authors.
Related Research Data
References
- Ahmed, A., McLoughlin, S., & Johnston, H. (2015). 3D analysis of seepage under hydraulic structures with intermediate filters. Journal of Hydraulic Engineering, Technical Note, 141(1), 06014019, 1–6. doi: 10.1061/(ASCE)HY.1943-7900.0000944
- Akkuzu, E. (2012). Usefulness of empirical equations in Assessing canal losses through seepage in concrete-lined canal. Journal of Irrigation and Drainage Engineering, 138(5), 455–460. doi: 10.1061/(ASCE)IR.1943-4774.0000414
- Bahramlu, R. (2011). Evaluation of leakage losses in irrigated irrigation channels in cold regions and its effect on water resources reserves (case study in Hamadan province). Iranian Journal of Water Research, 5(9), 141–150. (in Persian).
- Bayrami, M. (2009). Water conveyance structures, Isfahan University of Technology (in Persian).
- Chahar, B. R. (2007). Analysis of seepage from Polygon channels. Journal of Hydraulic Engineering, 133(4), 451–460. doi: 10.1061/(ASCE)0733-9429(2007)133:4(451)
- Eshetu, B. D., & Alamirew, T. (2018). Estimation of seepage loss in irrigation canals of Tendaho sugar estate, Ethiopia. Irrigation & Drainage Systems Engineering, 7(3), 220. doi: 10.4172/2168-9768.1000220
- Farhadi, A., Mayrhofer, A., Tritthart, M., Glas, M., & Habersack, H. (2018). Accuracy and comparison of standard k-ϵ with two variants of k-ω turbulence models in fluvial applications. Engineering Applications of Computational Fluid Mechanics, 12(1), 216–235. doi: 10.1080/19942060.2017.1393006
- Fotouhi, M., & Hosseini, S. M. (2007). Sensitivity analysis of flood routing parameters and transmission losses in rivers of arid regions. Journal of Watershed Management Sciences and Engineering, 1(1), 12–23. (in Persian).
- Gabl, R., & Righetti, M. (2018). Design criteria for a type of asymmetric orifice in a surge tank using CFD. Engineering Applications of Computational Fluid Mechanics, 12(1), 397–410. doi: 10.1080/19942060.2018.1443837
- Iqbal, Z., MacLean, R. T., Taylor, B. D., Hecker, F. J., & Bennett, D. R. (2002). Seepage losses from irrigation canals in southern Alberta. Canadian Biosystems Engineering, 44, 1.21–1.27.
- Jafari, F., Salmasi, F., & Abraham, J. (2019). Numerical investigation of granular filter under the bed of a canal. Applied Water Science, 9(137), 1–15. doi: 10.1007/s13201-019-1023-8
- Jain, A. K., & Reddi, L. N. (2011). Finite-depth seepage below flat aprons with equal end cutoffs. Journal of Hydraulic Engineering, 137(12), 1659–1667. doi: 10.1061/(ASCE)HY.1943-7900.0000459
- Kacimov, A. R. (2003). Discussion of “design of Minimum seepage-loss Nonpolygonal canal sections” by Prabhata K. Swamee and Deepak Kashyap. Journal of Irrigation and Drainage Engineering, 129(1), 68–69. doi: 10.1061/(ASCE)0733-9437(2003)129:1(68.2)
- Kinzli, K. D., Martinez, M., Oad, R., Prior, A., & Gensler, D. (2010). Using an ADCP to determine canal seepage loss in an irrigation district. Agricultural Water Management, 97(6), 801–810. doi: 10.1016/j.agwat.2009.12.014
- Kraatz, D. B., & Mahajan, V. I. K. (1975). Small hydraulic structures. Rome: Irrigation and Drainage, FAO.
- Martin, C. A., & Gates &, T. K. (2014). Uncertainty of canal seepage losses estimated using flowing water balance with acoustic Doppler devices. Journal of Hydrology, 517, 746–761. doi: 10.1016/j.jhydrol.2014.05.074
- Muskat, M. (1937). The flow of homogeneous fluids through porous media. New York: McGraw-Hill.
- Noori Mohammadiyeh, M., Sohrabi, T., & Rahimi, H. (2010). Evaluation of experimental methods for determination of leakage in earthen channels (case study: Ghazvin plain), Iranian. Journal of Water Research, 4(7), 125–128. (in Persian).
- Nourani, B., Salmasi, F., Abbaspour, A., & Oghati Bakhshayesh, B. (2017). Numerical investigation of the optimum location for vertical drains in gravity dams. Geotechnical and Geological Engineering, 35(2), 799–808. doi: 10.1007/s10706-016-0144-1
- Pognant, D., Canone, D., Previati, M., & Ferraris, S. (2013). Using EM equipment to verify the presence of seepage losses in irrigation canals. Procedia Environmental Sciences, 19, 836–845. doi: 10.1016/j.proenv.2013.06.093
- Quezada, M., Tamburrino, A., & Niño, Y. (2018). Numerical simulation of scour around circular piles due to unsteady currents and oscillatory flows. Engineering Applications of Computational Fluid Mechanics, 12(1), 354–374. doi: 10.1080/19942060.2018.1438924
- Rustamian, R., & Abedi Kupayi, C. (2012). Evaluation of SEEP/W software model for estimating water Leakage from soil channels (case study: Zayandeh Rood irrigation network). Water and Soil Science (Science and Technology of Agriculture and Natural Resources), 15(58), 13–21. (in Persian).
- Salemi, H., & Sepaskhah, A. (2006). Modification of experimental equations of water leakage from channels in Rudasht area of Isfahan. Science and Technology of Agriculture and Natural Resources, 10(1), 29–42. (in Persian).
- Salmasi, F., & Jafari, F. (2019). A simple direct method for prediction of safety factor of homogeneous finite slopes. Geotechnical and Geological Engineering, 37(5), 3949–3959. doi: 10.1007/s10706-019-00884-3
- Salmasi, F., Khatibi, R., & Nourani, B. (2017). Investigating reduction of uplift forces by longitudinal drains with underlined canals. ISH Journal of Hydraulic Engineering, 23(1), 57–62. doi:10.1080/09715010.2017.1350605
- Salmasi, F., & Mansuri, B. (2014). Effect of homogeneous earth dam hydraulic conductivity ratio (Kx/Ky) with horizontal drain on seepage. Indian Geotechnical Journal, 44(3), 322–328. doi: 10.1007/s40098-013-0087-x
- Salmasi, F., Mansuri, B., & Raoufi, A. (2015). Use of numerical simulation to measure the effect of relief wells for decreasing uplift in a homogeneous earth dam. Civil Engineering Infrastructures Journal, 48(1), 35–45. 2423–6691. doi: 10.7508/CEIJ.2015.01.004
- Salmasi, F., & Nouri, M. (2019). Effect of upstream semi-impervious blanket of embankment dams on seepage. ISH Journal of Hydraulic Engineering, 25(2), 143–152. doi: 10.1080/09715010.2017.1381862
- Swamee, P. K., & Kashyap, D. (2001). Design of minimum seepage-loss nonpolygonal canal sections. Journal of Irrigation and Drainage Engineering, 127(2), 113–117. doi: 10.1061/(ASCE)0733-9437(2001)127:2(113)
- Swamee, P. K., Mishra, G. C., & Chahar, B. R. (2000). Design of minimum seepage loss canal sections. Journal of Irrigation and Drainage Engineering, 126(1), 28–32. doi: 10.1061/(ASCE)0733-9437(2000)126:1(28)
- Wachyan, E., & Rushton, K. R. (1987). Water losses from irrigation canals. Journal of Hydrology, 92(3), 275–288. doi: 10.1016/0022-1694(87)90018-7
- Zhang, Q., Chai, J., Xu, Z., & Qin, Y. (2017). Investigation of irrigation canal seepage losses through use of four different methods in Hetao irrigation district, China. Journal of Hydrologic Engineering, 22(3), 05016035. doi: 10.1061/(ASCE)HE.1943-5584.0001470