
 ?Mathematical formulae have been encoded as MathML and are displayed in this HTML version using MathJax in order to improve their display. Uncheck the box to turn MathJax off. This feature requires Javascript. Click on a formula to zoom.
ABSTRACT
The effect of urban form on energy consumption has been the subject of various studies around the world. Having examined the effect of buildings on energy consumption, these studies indicate that the physical form of a city has a notable impact on the amount of energy consumed in its spaces. The present study identified the variables that affected energy consumption in residential buildings and analyzed their effects on energy consumption in four neighborhoods in Tehran: Apadana, Bimeh, Ekbatan-phase I, and Ekbatan-phase II. After extracting the variables, their effects are estimated with statistical methods, and the results are compared with the land surface temperature (LST) remote sensing data derived from Landsat 8 satellite images taken in the winter of 2019. The results showed that physical variables, such as the size of buildings, population density, vegetation cover, texture concentration, and surface color, have the greatest impacts on energy usage. For the Apadana neighborhood, the factors with the most potent effect on energy consumption were found to be the size of buildings and the population density. However, for other neighborhoods, in addition to these two factors, a third factor was also recognized to have a significant effect on energy consumption. This third factor for the Bimeh, Ekbatan-I, and Ekbatan-II neighborhoods was the type of buildings, texture concentration, and orientation of buildings, respectively.
1. Introduction
The rapid growth of cities, in combination with fast technological advancement, has created many challenges for the management of urban environments. Today’s cities consume natural resources, generate heat, and produce pollution in amounts that far exceed those of past decades (Feigenwinter et al., Citation2018; Ng & Ren, Citation2018). The world’s population and energy consumption have been steadily increasing since the Industrial Revolution. During this time, the urban proportion of the global population has also been increasing. In 2007, the world’s rural and urban populations became roughly equal in size for the first time in history, and today, more than half of the world’s population lives in cities. It has been estimated that by 2030, nearly 60% of the world’s population will live in cities all around the globe (Alhamwi, Medjroubi, Vogt, & Agert, Citation2017; Kamal-chaoui & Robert, Citation2009).
Built environments have an impact on urban climate, and, acknowledging the importance of this issue, many urban designers and architects believe that designs should be in harmony with the local climate and environment. Cities consist of countless small elements, whose interactions and the way they influence each other and their surroundings can create a variety of local microclimates (Aram, Solgi, & Holden, Citation2019; Baker, Citation2018; Dwivedi, Citation2019; Echarri, Espinosa, & Rizo, Citation2017). In the past, energy performance analyses of urban environments involved comparing urban forms with quantitative measures such as total energy consumption or carbon dioxide emission, but recent studies have chosen to focus on specific aspects of the urban energy system such as buildings or transportation for such analyses. Although macro approaches are convenient and straightforward, they are more challenging to use in practice because of the complexity of the urban energy system (Fox, Osmond, & Peters, Citation2018; Kasmaee & Tinti, Citation2018; Kaza, Citation2010).
The particular climate of each part of a city is a factor of the characteristics of its own and surrounding environments, and specifically the materials, geometry, structure, and surface characteristics of its build spaces. The characteristics of city air at higher altitudes usually vary from site to site, as they are affected not only by the height of buildings but also the heat condition of the area underneath. Further, thermal comfort and energy consumption in buildings of any given area are influenced by the climate of that area, which can differ from the condition in the city air (Aram, Solgi, Higueras García, Mosavi, & Várkonyi-Kóczy, Citation2019; Dwivedi, Khire, Mohan, & Shah, Citation2019; Li, Zhou, Asrar, & Zhu, Citation2018; Oke, Citation1988; Osborne & Alvares-Sanches, Citation2019; Ye et al., Citation2018).
Energy consumption in cities and its relation to urban design and form has been the subject of many studies. Some of these studies have proposed some methods and models for assessing the relationship of energy consumption in both buildings and transportation with urban form and shape. For example, in a study by Oh and Kim, the authors discussed the impact of geographical parameters on the energy efficiency of buildings and introduced 13 types of urban blocks for the studied area. In this study, data analysis was performed with the help of GIS, EnergyPlus and Openstudio software (Oh & Kim, Citation2019). In another study, Yang et al. analyzed 530 buildings in mid-sized US cities to determine the impact of a building’s surroundings on its energy consumption, and ultimately introduced a data-driven urban energy analysis methodology (DUE-A) (Yang, Gupta, & Jain, Citation2019). Javanroodi et al. introduced a multi-objective optimization framework based on a genetic algorithm called Energy Efficient Form-finder (EEF), and used it to study the form combination of five reference buildings in five different urban areas, based on a new technique called ‘Building Modular Cell’ (Javanroodi, Nik, & Mahdavinejad, Citation2019). A summary of the studies conducted in this field and their proposed methods is provided in the following table (Table ).
Table 1. Summary of research on the relationship between urban form and energy consumption.
Despite their many merits, none of these studies has focused on a specific part of a city. This lack of focus can increase the degree of error in estimations and conclusions, because energy consumption in a city, especially in a large city, can be influenced by a wide variety of factors dependent upon its geographical, social, economic and other characteristics. To minimize this error, the present study was conducted on specific parts of the city of Tehran that are very similar in terms of geographical, social, economic, and other characteristics. Using the land surface temperature estimates taken from satellite images, this study analyzed the relationship between energy consumption and the form of urban blocks.
In several urban studies, the effects of either urban heat island (UHI) or the cooling effect of urban green spaces have been measured from land surface temperature data stemmed from the Remote Sensing method (Aram, Higueras García, Solgi, & Mansournia, Citation2019). However, to date, none of these studies have investigated the relationship between the city form and its energy consumption. Thus, this paper, using land surface temperature sourced from satellite images, aims to investigate the impact of the urban form and the arrangement of buildings on energy consumption.
2. Materials and methods
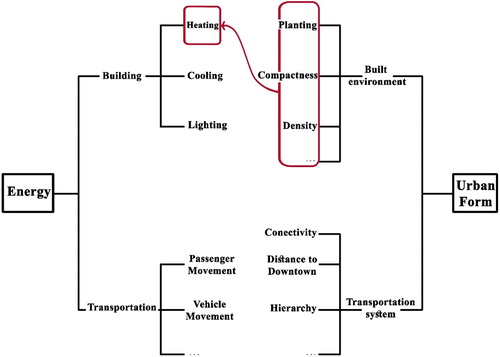
Studies on the impact of urban form and texture on energy consumption can be divided into two broad categories: the studies focused on transportation networks and the related variables that may affect energy consumption, and those focused on buildings, whether individual buildings from the architectural perspective or blocks of buildings from the urban development point of view. In this study, we tried to identify the variables that affect energy consumption in buildings (mainly residential) with attention to their placement in urban texture and to analyze the impact of these variables on energy consumption (Figure ).
Figure 1. Conceptual framework for the research.
The first step of the study was to extract research variables from the literature. Then, the effect of each variable on heating energy consumption in winter was investigated. This investigation was performed using the buildings of four neighborhoods in Tehran: Apadana, Bimeh, and Ekbatan Phases I, Ekbatan Phases I (hereafter referred to Ekbatan-I and Ekbatan-II for the sake of brevity). Using the Morgan’s table, the sample size was calculated to 40 for the Apadana neighborhood and 260 for the Bimeh neighborhood, but for the Ekbatan neighborhoods (both phases I and II), which contain a relatively small number of buildings, all buildings were examined. Ultimately, the land surface temperature data derived from Landsat 8 satellite images of the area were used to investigate the effect of variables.
In this study, the term building refers to the entire built proportion of a plot of land that has an official deed with a registration plate. The deed shows the ownership of the building by one person or by several persons, who have built or purchased the building individually or together and divided the apartment units. Therefore, this study uses the term building to describe a built structure with common spaces (staircase and elevator) where one or more households live. Since the ultimate goal is to analyze the rate of energy consumption in each building, the energy consumption data of each building has not been considered, because the scale of the building has a direct impact on consumption (the larger the building the more energy consumption). Therefore to get reasonable results, the percentage increase in energy consumption of each building was calculated in the winter (as a period of time that consumption increasing) compared to the summer (as the period of time that consumption decreasing).
In this study, land surface temperature (LST) was considered to be equivalent to the temperature below the urban atmosphere and to be the primary factor in the analysis of surface radiation and energy variations, the inner climate of buildings, and human comfort in the urban environment. Physical features and color of urban surfaces, sky-view factor, street geometry, traffic lines, and human-made changes in nature are some of the essential factors that determine LST in urban environments (Deo & Şahin, Citation2017; Jiang & Weng, Citation2017; Karimi, Pahlavani, & Bigdeli, Citation2017). In this study, the data needed to model LST, were extracted from Landsat 8 satellite images.
This information was obtained by analyzing images in GIS software. The data regarding natural gas consumption during the 2019 winter were gathered from the District 4 office of Tehran Gas Company. The effect of variables on energy consumption was then analyzed in SPSS using a multivariate linear regression equation. The focus on gas consumption in winter is because, given the widespread use of natural gas-burning heaters and heating systems in Iran, this consumption is a practice measure for examining the increase in heating energy consumption in different areas and analyzing the influential variables. The remaining household consumption of gas is almost constant throughout the year.
2.1. Study site
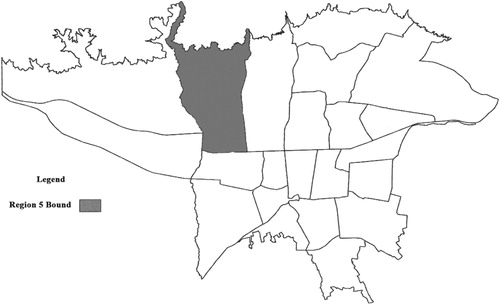
Tehran with an area of 750 km2 is known as the largest city of Iran. The rapid growth of this megacity has given rise to serious urban environmental issues such as UHI and energy demand (Sodoudi, Shahmohamadi, Vollack, Cubasch, & Che-Ani, Citation2014). According to Köppen classification, the climate of this area classifies as Csa (Kottek, Grieser, Beck, Rudolf, & Rubel, Citation2006). The negative environmental impacts of cities are on the rise which threatens the natural environment. Cities are the largest consumer of raw materials and energy and the largest producer of pollutions, solid and liquid wastes. The use of non-renewable energies contaminates land, air, and water, resulting in instability. Provided that the energy consumption is not reduced, it can lead to the destruction of many urban areas and their associated centers (Bokaie, Zarkesh, Arasteh, & Hosseini, Citation2016). Tehran, with a population of 8.5 million, is not exceptional, thereby finding practical solutions and urban design theory to reduce energy consumption is essential. The studied area is located in District 5 of Tehran municipality at 35°42′00″N and 51°25′00″E. District 5 covers more than 5287 hectares of land in the northwest of Tehran. The studied neighborhoods are located in Zone 6 of District 5, which mostly consists of densely concentrated residential complexes in the Ekbatan, Apadana and Fakouri neighborhoods. The only exception in this regard is the Bimeh neighborhood, which consists of smaller land lots with buildings of up to 4 floors on average (Figure ).
Figure 2. Location of District 5 in Tehran (Source: the detailed plan of Tehran, 2006).
Land uses in the studied area are mainly residential with a few dispersed commercial plots. However, there are also a few industrial plots in the southern parts of the Bimeh neighborhood. The population density and total population of the studied neighborhoods are given in the following table (Table ).
Table 2. Total population and population density of the studied neighborhoods.
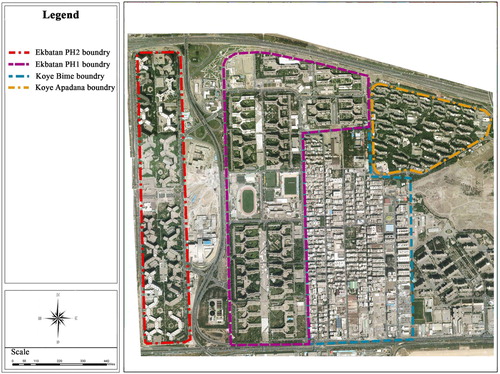
The Apadana, Ekbatan-I and Ekbatan-II neighborhoods all have relatively dispersed spatial patterns, with the difference that the first two neighborhoods consist of regularly spaced buildings in similar blocks, but the same cannot be said for the last one. In contrast, the Bimeh neighborhood has a checkered pattern with the most neatly arranged blocks and the most compact texture among the neighborhoods. Because of having better vegetation cover around the buildings, The Apadana, Ekbatan-I, and Ekbatan-II neighborhoods have more favorable summer conditions than the Bimeh neighborhood. Buildings in the Bimeh and Ekbatan-I neighborhoods have a north–south orientation and those in the Apadana neighborhood have a northeast-southwest orientation, but buildings in the Ekbatan-II neighborhood do not have any specific dominant orientation. In the Apadana, Ekbatan-I and Ekbatan-II neighborhoods, green patches are scattered between the buildings, providing functional spaces for relaxation and serving as children playground. In the Bimeh neighborhood, green spaces are sparser than in other areas. In this neighborhood, vegetated areas are mostly restricted to the edge of sidewalks and courtyards of buildings, though there are also a few patches of greenery in the area. The trees planted in these areas are mostly deciduous (70%) but are combined with evergreen trees (20%) in some areas (Figure ).
Figure 3. Aerial map of the studied area.
3. Results
This section examines the findings obtained from satellite imagery and LST data and their relationship with energy consumption in winter. The Tehran Gas Company collects the gas consumption data of buildings periodically (every two months) in cubic meters.
Landsat 8 satellite crosses every point on Earth once every 16 days, taking images from the target ground surfaces as it passes. To determine the mean LST and air temperature in the area of interest, we used the six images taken in February and another six taken in March. After obtaining LST with GIS software, the lowest LST, the highest LST, and the mean LST in degrees Celsius were calculated. After calculating the air temperature in degrees Celsius, the neighborhoods were compared in terms of the degree of warmness and coldness and the average increase in energy consumption relative to hot months. Then, the analysis of research variables continued with aerial images. In the following figures (Figure –), the LST maps obtained for the study area are compared with the corresponding aerial images.
Figure 4. Land surface temperature (LST) map, Winter, 21 February 2019.
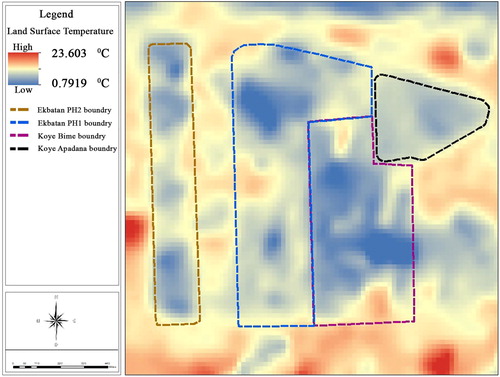
Figure 5. Comparison of LST in the Apadana neighborhood with aerial images (21 February 2019).
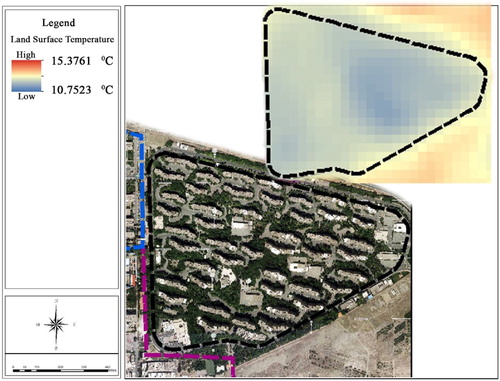
Figure 6. Comparison of LST in the Bimeh neighborhood with aerial images (21 February 2019).
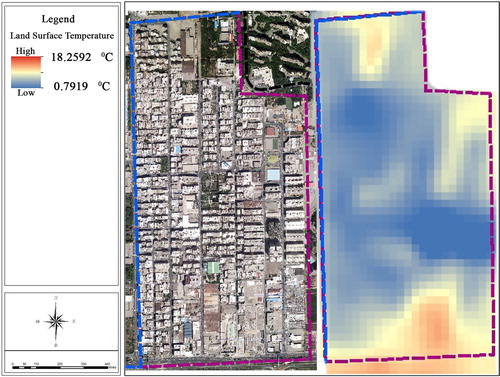
Figure 7. Comparison of LST in the Ekbatan-I neighborhood with aerial images (21 February 2019).
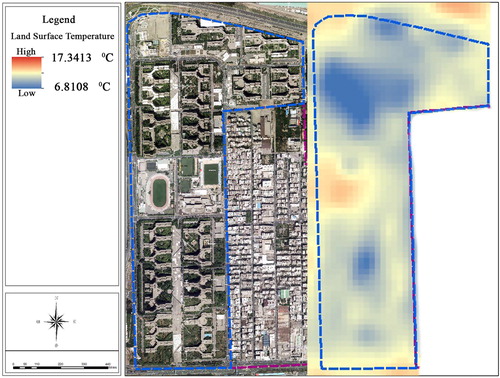
Figure 8. Comparison of LST in the Ekbatan-II neighborhood with aerial images (21 February 2019).
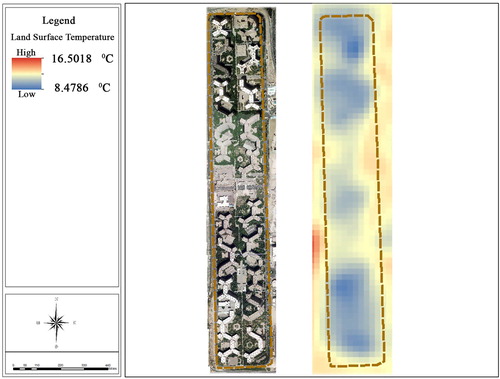
From the above figures, it can be concluded places with more abundant and denser green spaces have lower LST, and this contributes to the moderation of air temperature (research has shown that vegetation cover can reduce the air temperature by 1.4–6.1 degrees Celsius). In the southern part of the Bimeh neighborhood, there is a low-density industrial zone where LST is 9 degrees higher than other areas of the same neighborhood. This shows that the density of zones as well as green spaces can affect LST, thereby moderating the local microclimate. This microclimate is significantly more noticeable near the ground and under the tree canopies.
Table shows the average gas consumption in winter and summer in each examined neighborhood and the difference between these averages. According to these results, in winter, the Ekbatan-II neighborhood has the highest (1830815) and the Bimeh neighborhood has the lowest gas consumption (673969). The same is also true for summer. To better understand the extent of the increase in gas consumption in the cold season compared to the hot season, the difference between the two seasons was also examined. This examination showed that the difference between the two seasons was highest for the Ekbatan-II neighborhood (1471724) and lowest for the Bimeh neighborhood (588591). This comparison is based on the total consumption of the entire population.
Table 3. Comparison of energy consumption of examined neighborhoods and the average consumption of each building in hot and cold seasons.
Given the scale of the research and the considered variables, the next step was to examine the energy consumption in the building dimension. Using the results of the above table, the average consumption of each building in summer and winter was calculated and the difference between these averages (the increased consumption in winter relative to summer) was determined. According to these results, the Bimeh neighborhood has the lowest (2264) and the Ekbatan-I neighborhood has the highest gas consumption (78481).
While the above results provide a general view of the state of energy consumption, to obtain reliable results in this regard, the percentage increase in energy consumption in the cold season relative to the warm season had to be determined. According to the above table, the highest percentage increase in energy consumption (689.39%) belongs to the Bimeh neighborhood and the lowest (334.44%) is related to the Apadana neighborhood. Therefore, the Bimeh neighborhood has the highest energy consumption and the Apadana neighborhood has the lowest energy consumption in the building dimension. For a closer examination of the effect of each variable on energy consumption, the variables related to each neighborhood were analyzed.
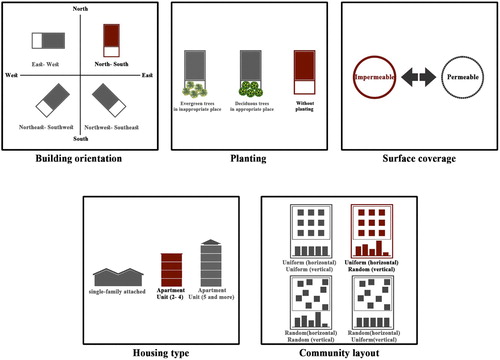
The variables used in this study were derived from the studies of Ko (Citation2013) on factors affecting energy consumption in the residential sector. After reviewing the relevant research literature, Ko introduced nine main variables that have a notable influence on energy consumption in the residential sector. These variables are the type of buildings, size of buildings, population density, texture concentration, the orientation of buildings, spatial arrangement of buildings, vegetation cover, surface coverage, and surface color.
In the initial examination, the size of buildings, type of building, population density, and texture concentration were found to have the greatest effect on gas consumption. After more careful investigation and examination of aerial imagery of LST, two variables, namely the condition of open spaces (referring to the effect of vegetation cover, presence of water ponds, etc.), and the condition of the site’s surrounding area (warmer or cooler surface covers, land uses affecting air temperature, etc.) were added to the aforementioned list of variables. Then, the effects of the resulting 11 independent variables on gas consumption were investigated.
4. Discussion
Factors that can influence energy consumption in cities have also been variously studied, investigating the variables affecting energy usage in buildings as well as transportation. According to these studies, in areas where public transportation is more widely used, buildings constitute a more substantial proportion and transportation makes up a smaller proportion of total energy consumption (Anderson et al., Citation2015; Crawford et al., Citation2018; Garcia-Santos et al., Citation2019; Urquizo, Calderón, & James, Citation2018).
For the first time in 1986, Owens studied urban form variables that influenced the energy consumption of a building on a regional scale. This includes: residential area patterns, interconnected networks, the size of residential areas, the shape and form of residential areas, residential interconnection networks, density, functionality distributions, activity centralization, building patterns, orientation, positioning, and building construction plans (Owens & Rickaby, Citation1992).
It has been estimated that energy-inefficient design, equipment, and behavior can raise the energy consumption of a building by respectively, 250, 200, and 200%. Since these effects stack, a poorly designed building that is equipped with an inefficient system and whose residents do not partake in energy-efficient behaviors can have up to 10 times higher energy consumption (Baker & Steemers, Citation2000). The effects of urban form characteristics on energy consumption can be examined at different scales, namely an individual building, an urban block, a neighborhood, and the entire city (Silva, Oliveira, & Leal, Citation2017; Solgi, Hamedani, Sherafat, Fernando, & Aram, Citation2019; Wang, Hu, Chen, & Yu, Citation2019). Elements of urban form that affect energy consumed in buildings include type and size of buildings, building density (physical concentration of residential units and population), spatial structure (building shape and street orientation), vegetation cover (trees and other plants), and surface cover (permeable/impermeable) (Chun & Guldmann, Citation2018; Dyce & Voogt, Citation2018; Hu & Wendel, Citation2019; Khamchiangta & Dhakal, Citation2019; Wetherley, McFadden, & Roberts, Citation2018). Other non-spatial variables that may affect energy consumption include building design, heating efficiency, HVAC efficiency, and residents’ behavior. Urban planning and design factors are associated with microclimate variables, including daylight exposure, sunlight direction (affecting the heating), wind current (affecting wind protection as well as optimal ventilation), and local temperature (heat island effect) (Aram, Solgi, García et al., Citation2019; Ayanlade, Citation2017; Barile, Leoni, Pantoli, & Stornelli, Citation2018; Chen et al., Citation2019; Esau, Miles, Varentsov, Konstantinov, & Melnikov, Citation2019). These microclimate variables, in turn, affect the energy consumption of residential units. Neighborhood density is strongly dependent on housing size and type and is associated with sunlight exposure, natural ventilation, and heat island effect. Street grid design determines the direction of streets and the shape of buildings, which are essential for sunlight exposure and airflow. Landscape planning, tree planting, and surface cover also have profound impacts on urban climate, primarily through sunlight exposure and heat island effect (Ko, Citation2013).
In 2014, urban form factors affecting energy consumption were studied in Paris, New York, and Barcelona. These factors include; mass composition and structure (built-up areas, FAR, building height, building density, neighborhoods), street openings (sun blockage and outward appearance), street network (intersection and collision points, the distance between intersection points, the mean number of interconnections to measure the amount of communication and access to spaces, traffic flow and traffic congestion, fuel use and its impact on air pollution), active volume (refers to the volume of the building up to a depth of 6 meters, which reduces energy consumption by receiving natural light and ventilation) (Salat, Bourdic, & Labbe, Citation2014). Mitchell (Citation2005), in a study, examines the role of city form and energy in urban development. As a result of this study, in the era of climate change and the goal of reducing CO2 emissions, energy efficiency in urban development is one of the most important factors in urban sustainability. Sattrup and Strømann-Andersen (Citation2013) conducted a study titled ‘Building typologies in Northern European cities: Daylight, solar access, and building energy use.’ They presented some geometrical parameters for designing sustainable building patterns in the Nordic area by asking how different urban forms, as well as the density of different types of building can influence energy consumption and daylight availability. The results of his research, which focused on new and old varieties of urban textures, indicted a 16% impact of pattern selections and typology on energy consumption, as well as a 48% impact on daylight intake at a constant city density.
In this study, the investigation of the effect of variables on the increase in energy consumption shows that the size of buildings and the population density have the most significant impacts on energy consumption in the residential sector. The effect of research variables on energy consumption was found to differ from neighborhood to neighborhood because of their physical differences. In the Apadana neighborhood, only two variables, namely the size of buildings and the population density, influenced energy consumption. For the Bimeh neighborhood, six variables, including of the size of buildings, population density, type of buildings, texture concentration, surface coverage, and vegetation, had direct effects on energy consumption, and other variables (orientation of buildings, spatial arrangement of buildings, surface color, condition of open spaces, and condition of surrounding areas) had either no effect on energy consumption or were affecting it indirectly through another variable. In the Ekbatan-I neighborhood, also, six variables including the size of buildings, population density, texture concentration, the orientation of buildings, surface color, and condition of surrounding areas, had direct impacts on energy usage. Finally, for the Ekbatan-II neighborhood, only three variables, namely the size of buildings, population density, and texture concentration were found to affect energy consumption. The lack of effect of individual variables on energy consumption can be attributed to the uniformity of neighborhood in terms of that variable (e.g. the type of buildings in the Apadana neighborhood, where all buildings are apartments with 5 or more residential units) or very small variations of the variable across the neighborhood (e.g. the color of surfaces in the Apadana neighborhood, where all surfaces are bright-colored and have very similar albedos). Therefore, the magnitude of the effect of each variable on energy consumption in each neighborhood, both direct and indirect, depends on how much it has changed in that neighborhood.
In the following, we will discuss how and to what extent the variables have affected the amount of energy consumed in each neighborhood and why some variables have had no effect whatsoever. Given the length of the analysis, this section only provides the path analysis of the effect of variables on energy consumption in the Bimeh neighborhood as an example (Figure ).
Figure 9. Path analysis of the effect of variables on energy consumption in the Bimeh neighborhood.
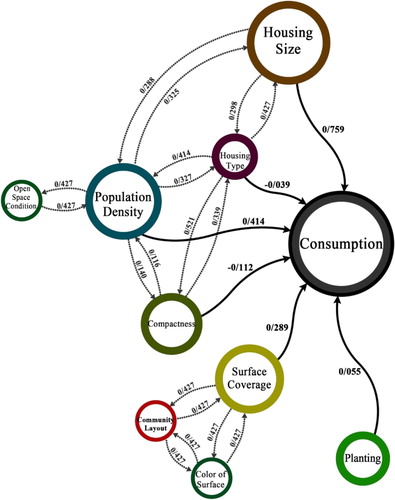
The above diagram shows that the orientation of buildings and the condition of surrounding areas have had no effect on energy consumption in this neighborhood and also three variables including surface color, the spatial arrangement of buildings, and condition of open spaces have had indirect effects on this matter.
According to Table , for the Bimeh neighborhood, the size of buildings and the population density have had the greatest effect on energy consumption, and this relationship is direct (meaning that energy consumption increases with the increase in the size of buildings and the population density). It can be seen that with the change in building type from single-story and two-story houses to apartments with five or more units, energy consumption increases. Energy consumption also increases with the surface cover becoming more impermeable. The color of surfaces and the open spaces have minimal effect on energy consumption but directly affect the surface cover. In this neighborhood, impermeable surfaces are much more frequent than permeable surfaces and their color is also darker. Thus, with the increase in the area of impermeable surfaces, the neighborhood as a whole has become darker in color (most surfaces of this neighborhood are dark-colored) and has attained a low albedo (percentage of sunlight reflected from the surfaces), which means absorbing more solar radiation. This feature may be favorable in the cold seasons but it is extremely undesirable in the summer.
Table 4. path analysis table for the Bimeh neighborhood.
According to the study conducted by Ebrahimpour et al., using light colors on the exterior of a building can reduce its annual energy consumption by about 9%. In this regard, the most energy-efficient design would be to make the exterior darker in winter and brighter in summer, but in practice this is impossible. Since this study focuses on the amount of energy consumed in winter, the surface color effect that is of interest to this paper is that as the surface color becomes brighter, the albedo of surface increases and sunlight absorption decreases, which leads to higher energy consumption (in winter).
In the context of this study, density refers to two notions: population density from planning perspective and texture concentration from a physical and architectural perspective. The higher the texture concentration is, the greater will be the population density and the smaller will be the vegetation cover. This results in a higher frequency of solid surfaces of different materials and colors, which, depending on the type of materials, can increase the day-time heat absorption and the night-time discharge of the absorbed heat, which leads to increased temperature in open spaces. Therefore, an increase in texture concentration results in increased energy consumption. Also, energy consumption becomes lower the more irregular the spatial arrangement is in the vertical direction. Regarding vegetation, having less and smaller vegetated areas directly increases the amount of energy consumption (Figure ). For this neighborhood, since buildings have the same orientation and there is not much change in the condition of surrounding areas, these two variables have not affected energy consumption (Figure ).
Figure 10. Changes in the quantitative variables in the Bimeh neighborhood.
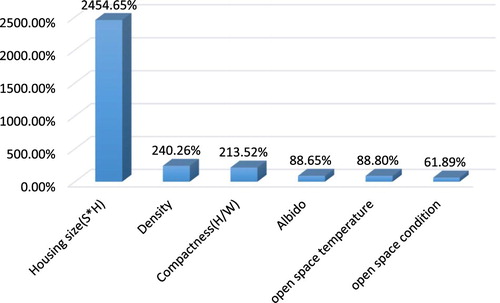
Figure 11. Changes in the qualitative variables in the Bimeh neighborhood.
The path analysis tables developed for other neighborhoods are provided below (Table ). These tables can be analyzed in the same way as was done for the Bimeh neighborhood. But to avoid prolonged repetition, these analyses are not included in the paper.
Table 5. path analysis table for the Apadana neighborhood, Ekbatan-I neighborhood, Ekbatan-II neighborhood.
What is constant in all of the examined neighborhoods is the size of buildings and the population density having the most significant impacts on energy consumption. A change in any of these variables has an impact on the other and they jointly have the greatest direct effect on energy consumption. In Table , the changes in these variables in each neighborhood relative to the Bimeh neighborhood (the neighborhood with the highest energy consumption) are compared with each other. In Table , it can be seen that the size of buildings and population density in the Apadana neighborhood are respectively 4.51 and 2.8 times higher than those in the Bimeh neighborhood, and the energy consumption of buildings in summer and winter in the Apadana neighborhood is respectively 19.5 and 10.75 times higher than those in the Bimeh neighborhood. Given the difference between winter and summer energy consumption in these neighborhoods, it can be concluded that the energy consumption of buildings in the Apadana neighborhood has been 51% lower than in the Bimeh neighborhood. These figures mean that the buildings of the Apadana neighborhood have been able to conserve 51% more energy than the buildings in the Bimeh neighborhood. The figures related to other neighborhoods can also be interpreted in the same way. Accordingly, the buildings in the Ekbatan-I and Ekbatan-II neighborhoods have managed to save respectively 20% and 40% more energy than those in the Bimeh neighborhood (Table ).
Table 6. Final comparison of the changes in energy consumption.
As Table compares the ratio of increases or decreases of the research variables in the three Apadana, Ekbatan-I and Ekbatan-II neighborhoods to Bimeh, it does not include a unit of measurement. For instance, the first cell represents the size of the building in Apadana neighborhood is 4.51 times that of Bimeh neighborhood (Table ).
Table 7. Comparison of LST, variables affecting energy consumption, and average energy consumption of each household by neighborhood.
5. Conclusion
The results of this study suggest that among the examined variables, the size of buildings, population density, vegetation cover, texture concentration, and surface color are the most important factors affecting energy consumption in the studied neighborhoods. Because of the many interior walls shared between units in large apartment buildings, the presence of these buildings reduces the average energy consumption of the area. However, the higher the number of people living in a building, the higher will be the energy consumption (because of the per-capita consumption added with the addition of each person). Texture concentration can have a significant effect on the temperature of open spaces and how natural energies such as wind and sunlight can be used to reduce energy consumption. Therefore, the presence of more scattered spaces (in terms of building arrangement) increases the need for heating energy in winter. Vegetation cover is one of the most critical factors that can moderate the microclimate and cool the nearby spaces. Depending on the type of trees planted and their location, vegetation cover can reduce the surface temperature in summer and contribute to increasing temperature in winter by letting sunlight through. The color of surfaces also has a significant effect on the proportion of sunlight to be reflected (albedo) and the heat energy to be received and absorbed. Brighter surfaces generally absorb a lower proportion of the incident heat energy and reflect a higher proportion away. The orientation of buildings, the condition of open spaces, the condition of the site’s surrounding areas, and surface coverage were also found to affect energy use, but not as strongly as other variables.
Neighborhoods with high population density where buildings are large-scale and have a uniform spacing and a regular spatial arrangement, buildings orientation is designed for local climate, and green spaces are scattered between buildings have lower energy consumption than neighborhoods with checkered textures and north–south orientation, which have green patches in the form of neighborhood parks plus sidewalk trees.
Given the importance of rapid population growth and the rising energy demand of the present and future generations of urban populations as a significant global concern, urban planners and designers are recommended to conduct more extensive studies on the potentials for reducing energy consumption in urban spaces to ensure the sustainability of our cities in the future. The results of this study, which was conducted on the climate of Tehran, suggest that with proper planning for future developments and adoption of measures such as increasing the ratio of vegetation cover in the existing textures, it is indeed possible to decrease the energy consumed for heating in this city over the cold months of the year. Since the effects of examined variables on energy use are likely to vary with the climate, further research is needed to investigate these effects in different climates.
Disclosure statement
No potential conflict of interest was reported by the authors.
Related Research Data
References
- Alhamwi, A., Medjroubi, W., Vogt, T., & Agert, C. (2017). GIS-based urban energy systems models and tools: Introducing a model for the optimisation of flexibilisation technologies in urban areas. Applied Energy, 191, 1–9. doi: 10.1016/j.apenergy.2017.01.048
- Anderson, J. E., Wulfhorst, G., & Lang, W. (2015). Energy analysis of the built environment - A review and outlook. Renewable and Sustainable Energy Reviews, 44, 149–158. Elsevier Ltd. doi: 10.1016/j.rser.2014.12.027
- Aram, F., Higueras García, E., Solgi, E., & Mansournia, S. (2019). Urban green space cooling effect in cities. Green Space Cooling Effect in Cities. Heliyon, 5, e01339. doi: 10.1016/j.heliyon.2019
- Aram, F., Solgi, E., García, E. H., Mohammadzadeh, S. D., Mosavi, A., & Shamshirband, S. (2019). Design and validation of a computational program for analysing mental maps: Aram mental map analyzer. Sustainability (Switzerland), 11(14), doi: 10.3390/su11143790
- Aram, F., Solgi, E., Higueras García, E., Mosavi, A., & Várkonyi-Kóczy, A. R. (2019). The cooling effect of large-scale urban parks on surrounding area thermal comfort. Energies, 12(20), 3904. doi: 10.3390/en12203904
- Aram, F., Solgi, E., & Holden, G. (2019). The role of green spaces in increasing social interactions in neighborhoods with periodic markets. Habitat International, 84, 24–32. doi: 10.1016/j.habitatint.2018.12.004
- Ayanlade, A. (2017). Variations in urban surface temperature: An assessment of land use change impacts over Lagos metropolis. Weather, 72(10), 315–319. doi: 10.1002/wea.2925
- Baker, N., & Steemers, K. (2000). Energy and environment in architecture; A tehcnical design guide. Taylor.&.Francis. Taylor & Francis Group. doi: 10.1017/CBO9781107415324.004
- Baker, R. (2018). Heat reduction capabilities of urban tree species. Geographical Bulletin - Gamma Theta Upsilon, 59(2), 75–86.
- Barile, G., Leoni, A., Pantoli, L., & Stornelli, V. (2018). Real-time autonomous system for structural and environmental monitoring of dynamic events. Electronics (Switzerland), 7(12), doi: 10.3390/electronics7120420
- Bitelli, G., Conte, P., Csoknyai, T., Franci, F., Girelli, V. A., & Mandanici, E. (2015). Aerial thermography for energetic modelling of cities. Remote Sensing, 7(2), 2152–2170. doi: 10.3390/rs70202152
- Bokaie, M., Zarkesh, M. K., Arasteh, P. D., & Hosseini, A. (2016). Assessment of urban heat island based on the relationship between land surface temperature and land use/ land cover in Tehran. Sustainable Cities and Society, 23, 94–104. doi: 10.1016/j.scs.2016.03.009
- Chen, S., Hu, D., Wong, M. S., Ren, H., Cao, S., Yu, C., & Ho, H. C. (2019). Characterizing spatiotemporal dynamics of anthropogenic heat fluxes: A 20-year case study in Beijing–Tianjin–Hebei region in China. Environmental Pollution, 249, 923–931. doi: 10.1016/j.envpol.2019.03.113
- Chun, B., & Guldmann, J. M. (2018). Impact of greening on the urban heat island: Seasonal variations and mitigation strategies. Computers, Environment and Urban Systems, 71, 165–176. doi: 10.1016/j.compenvurbsys.2018.05.006
- Crawford, B., Grimmond, S. B., Gabey, A., Marconcini, M., Ward, H. C., & Kent, C. W. (2018). Variability of urban surface temperatures and implications for aerodynamic energy exchange in unstable conditions. Quarterly Journal of the Royal Meteorological Society, 144(715), 1719–1741. doi: 10.1002/qj.3325
- de Lemos Martins, T. A., Faraut, S., & Adolphe, L. (2019). Influence of context-sensitive urban and architectural design factors on the energy demand of buildings in Toulouse, France. Energy and Buildings, 190, 262–278. doi: 10.1016/j.enbuild.2019.02.019
- Deo, R. C., & Şahin, M. (2017). Forecasting long-term global solar radiation with an ANN algorithm coupled with satellite-derived (MODIS) land surface temperature (LST) for regional locations in Queensland. Renewable and Sustainable Energy Reviews, 72, 828–848. Elsevier Ltd. doi: 10.1016/j.rser.2017.01.114
- Dwivedi, A. (2019). Macro- and micro-level studies using Urban Heat Islands to simulate effects of greening, building materials and other mitigating factors in Mumbai city. Architectural Science Review, 62(2), 126–144. doi: 10.1080/00038628.2019.1578193
- Dwivedi, A., Khire, M. V., Mohan, B. K., & Shah, S. (2019). The role of structure cooling to reduce the effect of urban heat island in Mumbai. Advances in Building Energy Research, 13, 174–192. doi: 10.1080/17512549.2018.1488611
- Dyce, D. R., & Voogt, J. A. (2018). The influence of tree crowns on urban thermal effective anisotropy. Urban Climate, 23, 91–113. doi: 10.1016/j.uclim.2017.02.006
- Echarri, V., Espinosa, A., & Rizo, C. (2017). Thermal transmission through existing building enclosures: Destructive monitoring in intermediate layers versus non-destructive monitoring with sensors on surfaces. Sensors (Switzerland), 17(12), doi: 10.3390/s17122848
- Esau, I., Miles, V., Varentsov, M., Konstantinov, P., & Melnikov, V. (2019). Spatial structure and temporal variability of a surface urban heat island in cold continental climate. Theoretical and Applied Climatology, 137, 2513–2528. doi: 10.1007/s00704-018-02754-z
- Ewing, R., & Rong, F. (2008). The impact of urban form on U.S. residential energy use. Housing Policy Debate, 19(1), 1–30. doi: 10.1080/10511482.2008.9521624
- Feigenwinter, C., Vogt, R., Parlow, E., Lindberg, F., Marconcini, M., Del Frate, F., & Chrysoulakis, N. (2018). Spatial Distribution of Sensible and Latent Heat Flux in the City of Basel (Switzerland). IEEE Journal of Selected Topics in Applied Earth Observations and Remote Sensing, 11(8), 2717–2723. doi: 10.1109/JSTARS.2018.2807815
- Fox, J., Osmond, P., & Peters, A. (2018). The effect of building facades on outdoor microclimate-Reflectance recovery from terrestrial multispectral images using a robust empirical line method. Climate, 6(3), doi: 10.3390/cli6030056
- Garcia-Santos, V., Cuxart, J., Jimenez, M. A., Martinez-Villagrasa, D., Simo, G., Picos, R., & Caselles, V. (2019). Study of temperature heterogeneities at Sub-Kilometric scales and influence on surface-atmosphere energy interactions. IEEE Transactions on Geoscience and Remote Sensing, 57(2), 640–654. doi: 10.1109/TGRS.2018.2859182
- Hu, L., & Wendel, J. (2019). Analysis of urban surface morphologic effects on diurnal thermal directional anisotropy. ISPRS Journal of Photogrammetry and Remote Sensing, 148, 1–12. doi: 10.1016/j.isprsjprs.2018.12.004
- Javanroodi, K., Nik, V. M., & Mahdavinejad, M. (2019). A novel design-based optimization framework for enhancing the energy efficiency of high-rise office buildings in urban areas. Sustainable Cities and Society, 49, doi: 10.1016/j.scs.2019.101597
- Jiang, Y., & Weng, Q. (2017). Estimation of hourly and daily evapotranspiration and soil moisture using downscaled LST over various urban surfaces. GIScience and Remote Sensing, 54(1), 95–117. doi: 10.1080/15481603.2016.1258971
- Kamal-chaoui, L., & Robert, A. (2009). Competitive cities and climate change. Development, 172 (October). Retrieved from http://www.forum15.org.il/art_images/files/103/COMPETITIVE-CITIES-CLIMATE-CHANGE.pdf
- Kanters, J., & Horvat, M. (2012). Solar energy as a design parameter in urban planning. In Energy Procedia (Vol. 30, pp. 1143–1152). Elsevier Ltd. doi: 10.1016/j.egypro.2012.11.127
- Karimi, A., Pahlavani, P., & Bigdeli, B. (2017). Land use analysis on land surface temperature in urban areas using a geographically weighted regression and Landsat 8 imagery, a case study: Tehran, Iran. In International archives of the photogrammetry, remote sensing and spatial information Sciences - ISPRS Archives (Vol. 42, pp. 117–122). International Society for Photogrammetry and Remote Sensing. doi: 10.5194/isprs-archives-XLII-4-W4-117-2017
- Kasmaee, S., & Tinti, F. (2018). A method to evaluate the impact of urbanization on ground temperature evolution at a regional scale. Rudarsko Geolosko Naftni Zbornik, 33(5), 1–12. doi: 10.17794/rgn.2018.5.1
- Kaza, N. (2010). Understanding the spectrum of residential energy consumption: A quantile regression approach. Energy Policy, 38(11), 6574–6585. doi: 10.1016/j.enpol.2010.06.028
- Khamchiangta, D., & Dhakal, S. (2019). Physical and non-physical factors driving urban heat island: Case of Bangkok Metropolitan Administration, Thailand. Journal of Environmental Management, 248, 109285. doi: 10.1016/j.jenvman.2019.109285
- Ko, Y. (2013). Urban form and residential energy use: A review of design principles and research findings. Journal of Planning Literature, 28(4), 327–351. doi: 10.1177/0885412213491499
- Kottek, M., Grieser, J., Beck, C., Rudolf, B., & Rubel, F. (2006). World Map of köppen-Geiger climate classification - (updated with CRU TS 2.1 temperature and VASClimO v1.1 precipitation data 1951 to 2000). Meteorologische Zeitschrift, 15(3), 259–263. Retrieved from http://koeppen-geiger.vu-wien.ac.at/shifts.htm. doi: 10.1127/0941-2948/2006/0130
- Li, X., Zhou, Y., Asrar, G. R., & Zhu, Z. (2018). Developing a 1 km resolution daily air temperature dataset for urban and surrounding areas in the conterminous United States. Remote Sensing of Environment, 215, 74–84. doi: 10.1016/j.rse.2018.05.034
- Mitchell, G. (2005). Mapping hazard from urban non-point pollution: A screening model to support sustainable urban drainage planning. Journal of Environmental Management, 74(1), 1–9. doi: 10.1016/j.jenvman.2004.08.002
- Ng, E., & Ren, C. (2018). China’s adaptation to climate & urban climatic changes: A critical review. Urban Climate, 23, 352–372. doi: 10.1016/j.uclim.2017.07.006
- Oh, M., & Kim, Y. (2019). Identifying urban geometric types as energy performance patterns. Energy for Sustainable Development, 48, 115–129. doi: 10.1016/j.esd.2018.12.002
- Oke, T. R. (1988). Street design and urban canopy layer climate. Energy and Buildings, 11(1–3), 103–113. doi: 10.1016/0378-7788(88)90026-6
- Osborne, P. E., & Alvares-Sanches, T. (2019). Quantifying how landscape composition and configuration affect urban land surface temperatures using machine learning and neutral landscapes. Computers, Environment and Urban Systems, 76, 80–90. doi: 10.1016/j.compenvurbsys.2019.04.003
- Owens, S. E., & Rickaby, P. A. (1992). Settlements and energy revisited. Built Environment, 18(4), 247–252.
- Resch, E., Bohne, R. A., Kvamsdal, T., & Lohne, J. (2016). Impact of urban density and building height on energy use in cities. In Energy Procedia (Vol. 96, pp. 800–814). Elsevier Ltd. doi: 10.1016/j.egypro.2016.09.142
- Rodríguez-Álvarez, J. (2016). Urban energy index for buildings (UEIB): A new method to evaluate the effect of urban form on buildings’ energy demand. Landscape and Urban Planning, 148, 170–187. doi: 10.1016/j.landurbplan.2016.01.001
- Salat, S., Bourdic, L., & Labbe, F. (2014). Breaking symmetries and emerging scaling urban structures: A morphological tale of 3 cities: Paris, New York and Barcelona. Archnet-IJAR, 8(2), 77–93. doi: 10.26687/archnet-ijar.v8i2.445
- Sattrup, P. A., & Strømann-Andersen, J. (2013). Building typologies in Northern European cities: Daylight, solar access, and building energy use. Journal of Architectural and Planning Research, 30(1), 56–76.
- Silva, M., Oliveira, V., & Leal, V. (2017). Urban form and energy demand: A review of energy-relevant urban attributes. Journal of Planning Literature, 32(4), 346–365. doi: 10.1177/0885412217706900
- Sodoudi, S., Shahmohamadi, P., Vollack, K., Cubasch, U., & Che-Ani, A. I. (2014). Mitigating the urban heat island effect in megacity Tehran. Advances in Meteorology, 2014, 1–19. doi: 10.1155/2014/547974
- Solgi, E., Hamedani, Z., Sherafat, S., Fernando, R., & Aram, F. (2019). The viability of energy auditing in Countries with low energy cost: A case study of a residential building in cold climates. Designs, 3(3), 42. doi: 10.3390/designs3030042
- Urquizo, J., Calderón, C., & James, P. (2018). Modelling the spatial energy diversity in sub-city areas using remote sensors. In ECOS 2018 - Proceedings of the 31st International Conference on Efficiency, Cost, Optimization, Simulation and Environmental Impact of Energy Systems. University of Minho.
- Wang, S., Hu, D., Chen, S., & Yu, C. (2019). A partition modeling for anthropogenic heat flux mapping in China. Remote Sensing, 11(9), doi: 10.3390/rs11091132
- Wetherley, E. B., McFadden, J. P., & Roberts, D. A. (2018). Megacity-scale analysis of urban vegetation temperatures. Remote Sensing of Environment, 213, 18–33. doi: 10.1016/j.rse.2018.04.051
- Yang, Z., Gupta, K., & Jain, R. K. (2019). Due-A: Data-driven urban energy analytics for understanding relationships between building energy use and urban systems. In Energy Procedia (Vol. 158, pp. 6478–6483). Elsevier Ltd. doi: 10.1016/j.egypro.2019.01.114
- Ye, H., Ren, Q., Shi, L., Song, J., Hu, X., Li, X., … Xue, X. (2018). The role of climate, construction quality, microclimate, and socio-economic conditions on carbon emissions from office buildings in China. Journal of Cleaner Production, 171, 911–916. doi: 10.1016/j.jclepro.2017.10.099
- Zhou, Y., Li, Z., & Tao, X. (2016). Urban mixed use and its impact on energy performance of Micro Gird system. In Energy Procedia (Vol. 103, pp. 339–344). Elsevier Ltd. doi: 10.1016/j.egypro.2016.11.296