
 ?Mathematical formulae have been encoded as MathML and are displayed in this HTML version using MathJax in order to improve their display. Uncheck the box to turn MathJax off. This feature requires Javascript. Click on a formula to zoom.
Abstract
The cavitation development process in regulating valve under different inlet pressures is investigated experimentally and numerically in our paper. The influence of inlet pressure Pin on cavitation location, shape, area and intensity is studied in axial and radial directions, and the axial and radial pressure distributions are also analyzed. The cavitation is generally annular in shape radially and irregular polygon in shape axially. Cavitation bubbles occur at the throat entrance when the inlet pressure increases. The bubbles then accumulate, and a bubble ring is formed. The cavitation development process under different inlet pressures is separated into three stages, no-cavitation, initial cavitation and steady-cavitation stages. During the no-cavitation stage, no bubbles exist. During the initial cavitation stage, bubbles occur and the area and intensity of cavitation increase in the radial and axial directions with increasing inlet pressure. During the steady-cavitation stage, the calculation area and intensity of bubble rings reach their maximum values and then remain stable. The cavitation bubbles extend downstream, and the area of cavitation ring and cavitation intensity increase with increasing inlet pressure. A slit exists between the upper and lower parts of bubbles in the cavitation process, both parts touch each other forming a whole.
1. Introduction
A regulating valve is a key part of direct coal liquefaction, which often suffers from severe shocks, cavitation erosion and damage (Han, Liu, Wu, Zhao, & Tan, Citation2017; Liu, Jiang, & Zheng, Citation2012; Zheng, Ou, Ye, et al., Citation2016). Surveys show that the lifetime of a regulating valve is less than half a year, which seriously affects safety performance and the long-term stable operation of coal chemical systems (Jin et al., Citation2015). The flow characteristics of fluid in the regulating valve have a significant effect on its performance. Therefore, understanding the complex flow characteristics inside the valve thoroughly is important, and the details of flow characteristics are helpful for optimizing the valve structure.
Many studies have focused on the main factors that influence flow characteristics, such as opening degree, medium, velocity, geometry configuration, and pressure difference (Akbarian et al., Citation2018; Amirante, Distaso, & Tamburrano, Citation2014; Ramezanizadeh, Alhuyi Nazari, Ahmadi, & Chau, Citation2019; Zheng, Ou, Ye, et al., Citation2016). Mou, He, Zhao, and Chau (Citation2017); Mosavi, Shamshirband, Salwana, Chau, and Tah (Citation2019); and Ghalandari, Mirzadeh Koohshahi, Mohamadian, Shamshirband, and Chau (Citation2019) studied internal flow characteristics based on computational fluid dynamics. Cui, Lin, Zhu, Wang, and Ma (Citation2017) investigated internal flow characteristics, and discussed the flow rate under varying opening degrees, which is affected by cavitation. Forder, Thew, and Harrison (Citation1998) presented a numerical erosion model that could predict erosion rates, and they indicated that velocity was a major reason for erosion. Jin, Gao, Zhang, and Qian (Citation2017) emphasized that inlet velocity has an important effect on pressure drop and determined the pressure distribution with variable inlet velocities. Liu, Zhao, and Qian (Citation2017) analyzed the flow characteristics, such as water volume fraction, flow rate and turbulent intensity, and then obtained the effect of these factors on the flow features of fluid.
Many researchers have discussed the flow performance under different inlet boundaries and its different developing process (Long et al., Citation2017; Yang, Wang, & Lu, Citation2019). Chern, Wang, and Ma (Citation2007) visualized the performance and pattern of flow inside a valve with different opening degrees and inlet velocities experimentally. The cavitation index was defined to predict the inception of cavitation based on experimental data. Abdulaziz (Citation2014) captured the dynamic behavior of cavitation bubbles under different pressure ratios and obtained the change in cavitation morphology. Yuan, Song, and Liu (Citation2019) observed the morphologies of cavitation bubbles and identified the growth process of bubbles from cavitation nuclei to bubble cluster with increasing pressure drop.
The literature has focused on the characteristics of flow with different operating conditions, but few reports exist on the cavitation characteristics in regulating valves used in direct coal liquefaction. Only a few papers (Zheng, Ou, & Jin, Citation2017; Zheng, Ou, Ye, et al., Citation2016) reported the cavitation erosion of high-pressure letdown valve. They investigated cavitation-flow-induced valve spool failure, and a cavitation flow test rig was developed to observe cavitation on the valve model. However, the valve model in their papers was not strictly similar to the actual geometry but was only a combination of venturi and turbulent flow. The internal flow structure of the regulating valve is more complicated than that in their papers. Understanding the cavitation flow in the regulating valve under different inlet pressures is important owing to the noticeable differences. A 3D computation model is built, and a visualization experimental method is designed to capture cavitation flow characteristics with different inlet pressures in the regulating valve. A transparent model valve with a flow channel similar to the actual geometry in every aspect is machined in our test; thus, the cavitation development process is close to the flow field in a real scale. In addition, the cavitation flow under different inlet pressures is presented in our paper, and the cavitation area and length are determined by image processing. Not only the cavitation bubble location and cavitation shape (the outer extent of cavitation zones) but also the cavitation bubble ring and cavitation development process under different inlet pressures Pin in axial and radial directions are discussed in our paper.
2. Experimental investigation system
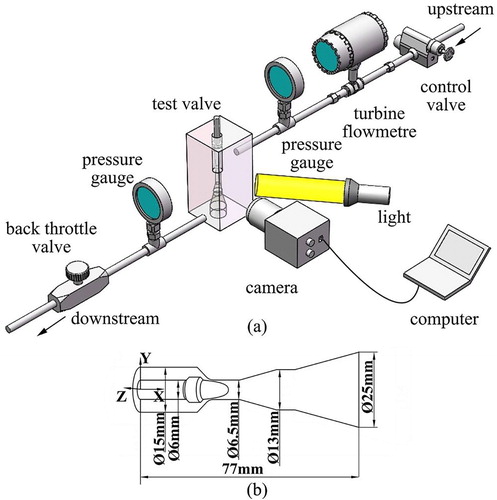
The instruments and experimental setup are presented in Figure (a). The pressure gauge is used to measure the inlet and outlet pressures, and the turbine flowmeter upstream is used to measure liquid flow. The geometrical structure of the regulating valve is designed in accordance with the actual one used in direct coal liquefaction. The size of the transparent valve is at one-tenth scale of the original geometry, which is made of polymethyl methacrylate and transparent for good visualization observation. The experimental valve has a length of 77 mm, a width of 25 mm and a minimum diameter of 3 mm, as shown in Figure (b). An optical fiber light (LA-100USW) is used as the illumination light, and a high-speed camera is used to observe the cavitation flow (Phantom VEO-710L). The optical fiber source and high-speed camera are mounted on the same side.
Figure 1. (a) Schematic of experimental setup; (2) Geometrical structure of regulating valve.
3. Numerical simulation
The commercial software Ansys Fluent 15.0 is employed for numerical calculation of the cavitation flow in the regulating valve. The fluid inside the regulating valve is a complex multiphase flow (Zheng, Ou, Ye, et al., Citation2016; Zheng, Ou, Yi, et al., Citation2016), and a transformation from liquid to vapor exists when bubbles occur. Based on the Navier–Stokes equation, the gas–liquid phase is considered continuous, and the mixture model is often selected to describe multiphase flow (Qiu et al., Citation2018b; Yin, Yu, Jia, & Yu, Citation2016).
3.1. Governing equations
The continuity equation for the mixture is:
(1)
(1) The momentum equation for the mixture can be expressed as:
(2)
(2)
Here, is the viscosity of the mixture;
is the mixture density defined as
;
,
are the vapor and liquid densities, respectively;
is the mass-averaged velocity;
,
are the vapor and liquid volume fractions, respectively; and
is the gradient of pressure
.
The net mass transfer from liquid to vapor is often described by the Schnerr–Sauer cavitation model, which can be expressed as:
(3)
(3)
(4)
(4)
In the formula, is the bubble radius,
;
and
is the cell center pressure and saturation vapor pressure; and
is the number of bubbles per volume of liquid, and the model takes
.
In our paper, the Reynolds number ranges from 1052 to 1590, which is much larger than the critical Reynolds number of cone valve; the standard k-ε turbulence model is suggested to describe turbulence effects (Andriotis, Gavaises, & Arcoumanis, Citation2008; Margot, Hoyas, Gil, & Patouna, Citation2014). The bubbles’ movement greatly affects the liquid-phase turbulent kinetic energy, and dissipation effect is also considered (Laı´n, Bröder, Sommerfeld, & Göz, Citation2002). The mixture, standard k-ε turbulence and Schnerr–Sauer models are used in our calculation.
3.2 Geometry and mesh modeling of regulating valve
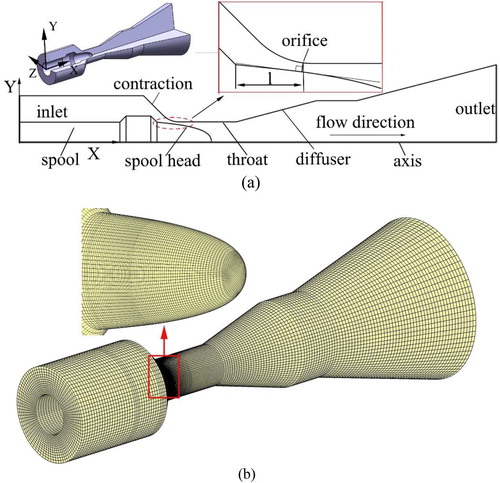
Figure (a) shows the axisymmetric model of the regulating valve, which consists of a spool and a valve seat. Three different sections of the flow channel exist in this regulating valve, which are called contraction, throat and diffuser sections. We can change the opening degree of the regulating valve by changing the relative position of the spool and valve seat. The flow direction is consistent with the positive X direction. The computed geometry is discretized by using the hexahedron mesh, as shown in Figure (b). The throttling zone has the finest mesh density due to the great pressure or velocity gradients caused by the contracted flow area. Encryption in the throttling zone is important.
Figure 2. (a) Axisymmetric model of regulating valve; (b) Mesh modeling.
The relative opening degree of the regulating valve is defined as:
(5)
(5) where
is the displacement of the regulating valve at a certain opening, and
is the total stroke of the regulating valve.
The inlet boundary condition is defined using inlet pressure (Pin), and the outlet boundary condition is defined using outlet pressure (Pout). No. 46 antiwear hydraulic oil is used in our system, which is assumed to be isothermal and incompressible. The density is 889 kg/m3, and the viscosity is 4.6 × 10⁻⁵(m2/s).
3.3 Grid independence analysis
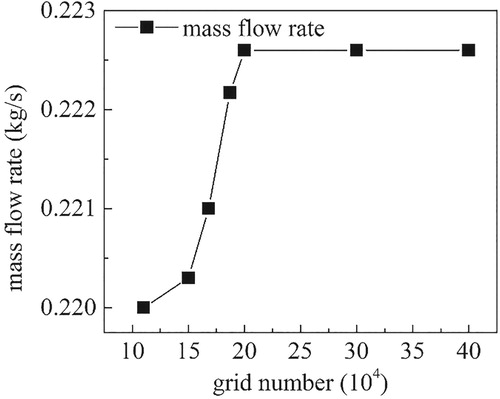
The grid independence analysis is depicted in Figure when Pin = 2.5 MPa and Pout = 1 MPa. The data show that the mass flow rate increases rapidly with increasing grid numbers. When the grid number is greater than 200,000 and the minimum size is 0.08*0.08 mm, the curve of mass flow rate remains stable. The tendency of mass flow rate demonstrates that the results are grid-independent. Thus, the amount of grid 200,000 is used in our simulation to save computation time, whilst the precision is guaranteed.
Figure 3. Grid independence.
4. Result
When cavitation bubbles occur, almost all lights are reflected at the interface between the cavitation bubbles and oil. The corresponding zones of the bubbles are bright, whereas those of the oil are dark. Thus, the cavitation and non-cavitation bubbles can be easily distinguished. The digital image-processing techniques based on gray-level detection on the images are widely used in two-phase mixture identification (de Graaf, Brandner, & Pearce, Citation2017; Soyama & Hoshino, Citation2016), and the principle of calculating cavitation bubble length is shown in Figure . Firstly, the image is tailored to the proper area to reduce the number of pixels needed to be calculated. The average gray value G is determined by calculating the gray value of the same abscissa, and an average value is obtained. Then, the gray value λ is defined as:
(6)
(6)
Figure 4. The method of cavitation length calculation.
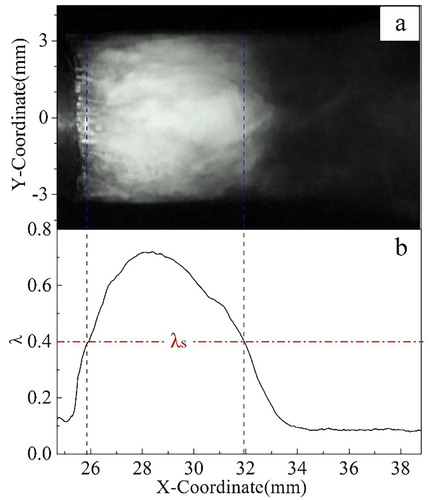
Figure (b) shows the variation in the gray value λ. A criterion should be introduced to calculate the cavitation because the cavitation boundary is distinct but not neat. As discussed by (Wang et al., Citation2018), the average of the gray value is employed as the threshold, which is used to define the initial and the collapse end point of the cavitation. If the distance
, then the distance from the collapse to start boundary is the cavitation length.
Figure shows the growing trend of cavitation length under increasing Pin at a relative opening degree of 50%. The images in the left column are the experimental results (A1–A6) captured by a high-speed camera, and those in the right column are the corresponding numerical results (B1–B6). When the backpressure is set as 1 MPa, cavitation bubbles occur at the throat entrance and develop downstream with increasing Pin. When the oil flows to the contraction section of the flow passage, the flow direction changes because of the decrease in geometric area, which induces increasing velocity and decreasing liquid pressure (Yin et al., Citation2016). If the liquid pressure is below the saturated vapor pressure (Pv), then cavitation incepts can be found (Qiu et al., Citation2016b). Based on the digital image-processing methods mentioned, the white dot in image A1 shows the starting position of cavitation, and the moving distance of white dots in images A2–A6 shows the changing trend of cavitation length. The numerical results imply that cavitation length increases as Pin increases from 2.1 to 4 MPa. Figure also demonstrates that the value of vapor volume fraction becomes larger with increasing Pin. The cavitation bubbles become stronger when the input pressure increases. The reasons are as follows: the pressure difference increases as Pin rises and a monotonic increase in the mass flow rate can be found (Qiu et al., Citation2016b). The larger the mass flow rate is, the more energy is converted into kinetic energy, thereby inducing more cavitation bubbles. With increasing Pin, the high-speed zones near the orifice and at the contraction section exit expands the scope, causing larger low-pressure regions. Then, a larger amount of dissolved gas nuclei in the low-pressure regions are formed to the cavitation bubbles. Furthermore, increasing input pressure generates more flow vortexes and much stronger turbulence in the channel (Wei et al., Citation2017). The highly strengthened vortexes and more intense mixing rate in the valve could cause stronger cavitation (Dai et al., Citation2019). Similar phenomena can be found elsewhere in the literature (Dai et al., Citation2019; Qiu et al., Citation2016b; Wei et al., Citation2017).
Figure 5. Growing trend of cavitation length under different Pin (Pout = 1 MPa).
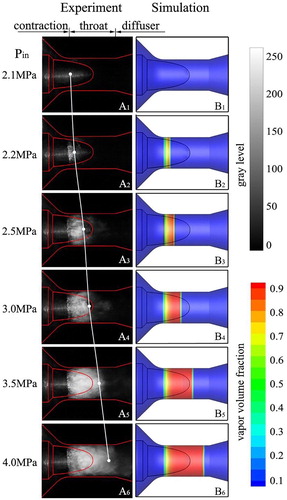
Figure shows the cavitation length obtained from Figure , which indicates that the cavitation length increases with increasing Pin. Good agreement between the predicted and measured lengths is obtained. The maximum relative error between the simulation and experimental data is approximately 3%. This error is probably due to the non-condensable gases not considered in our simulation model. Several factors, such as liquid compressibility, temperature rise and machining tolerance, are also among the main reasons for the differences between the computed results and experimental data.
Figure 6. Cavitation length obtained by numerical and experimental methods.
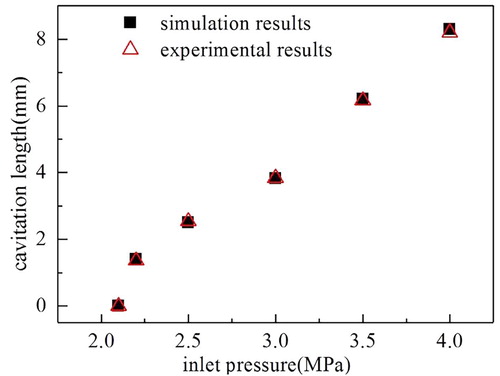
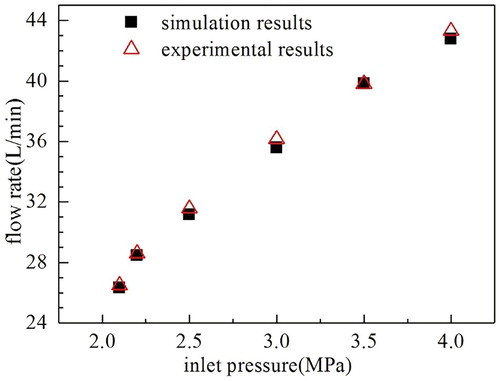
Figure shows the variation in flow rate with increasing Pin. When Pin increases, the flow rate increases, as obtained from the experimental and numerical results. When Pin increases from 2.1 to 4 MPa, the flow rate increases from 26 to 43.3 L/min. Cavitation bubbles occupy part of the flow passage, thereby reducing the actual flow area greatly and increasing the pressure loss. The experimental and simulation results have good consistency, and the maximum error between them is 2%. Comparison of the cavitation lengths and flow rates obtained by simulation and experimental methods shows that the model in our study proves its correctness for use to investigate the flow characteristic of cavitation in regulating valves.
Figure 7. The flow rate obtained from simulation and the experimental results.
5. Discussion
5.1 Cavitation development process in radial direction
Figure (a) illustrates the cavitation development stage at the throat of the regulating valve with variable inlet pressures. Bubbles appear near the throat, grow along the inner surface of the throat and form bubble rings. Five planes (named A, B, C, D, and E), which are spaced with equal distances from one another, are shown in Figure to discuss the distribution of vapor volume fraction radially. The average intervals are 1.5 mm. The bubbles can be found on the planes, and bubble rings occur. The bubble rings are attached to the inner and outer boundaries of the plane and extend towards its center. With increasing Pin, bubbles could also be found on planes B, C, D, and E. The vapor volume fraction on each plane becomes stronger with rising Pin. In the radial direction, the vapor–liquid interface in the planes is close to each other and finally intersects.
Figure 8. Numerical results of cavitation development process under different inlet pressures (a) inside the regulating valve, (b) on plane C, and (c) on five different planes.
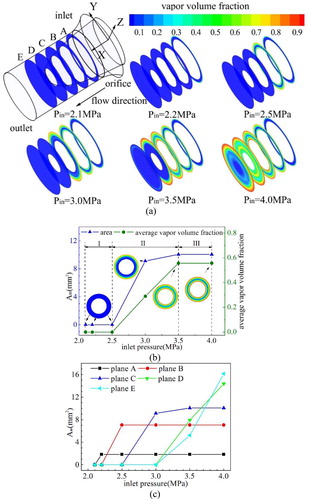
To interpret the cavitation development process, a new coefficient Am being used is expressed as.
(7)
(7) Ai is defined as the region of vapor volume fraction that is over 1% in the radial direction (Li, Liu, Wei, Liang, & Tang, Citation2018; Qiu et al., Citation2016a). Figure (b) shows the relationship between Am and Pin on plane C, which is the central position of five planes. The cavitation development process can be separated into three periods (Qiu, Wang, Lei, Wu, & Guo, Citation2018a; Qiu et al., Citation2018b). Period I is the no-cavitation stage (Pin≤2.5 MPa) in which no bubbles occur (Am = 0). Period II is the initial cavitation stage (2.5 MPa < Pin≤3.5 MPa). During this stage, the curve of Am rises with increasing Pin. The bubble rings seem to increase with the accumulation of cavitation bubbles. Oil and vapor mixture can be found inside the bubble rings. The bubbles grow in the inner and outer boundaries of plane C, extend towards one another and finally intersect in the middle as Pin increases. Coefficient Am and the vapor volume fraction on plane C increase as Pin rises. The cavitation becomes stronger with increasing input pressure (Qiu et al., Citation2016a; Qiu et al., Citation2016b). Period III is called the steady cavitation (Pin>3.5 MPa), in which coefficient Am and the vapor volume fraction on plane C reach their maximum value and remain stable even if Pin continues to increase. Figure (c) shows coefficient Am on planes A, B, C, D, and E with increasing Pin. The bubbles appear in sequential order on planes A, B, C, D, and E as Pin increases. The farther away from the throttling zone, larger Pin is needed for the cavitation inception. The cavitation inception occurs on plane A as Pin reaches 2.1 MPa. On plane D or E, the critical pressure of the cavitation inception rises to Pin=3.0 MPa. Am on planes rises to its maximum value and stabilizes with rising Pin. The maximum value of Am is 1.83 mm2 when Pin=2.1 MPa. When Pin = 4.0 MPa, the maximum value of Am on plane E is greater than 17. The plane far from the throttling zone is covered by substantial bubbles, and the effective flow area reaches its minimum.
As shown in Figure , the bubbles occur near the throttling orifice and attach on the walls of contraction and spool. The fluid accelerates through the contraction section, and the pressure gradient is consistent with the flow. When the local pressure is lower than Pv, bubbles occur and attach on the inner surface of the throat and the outer surface of the spool head, as shown in Figure (a). Then, the flow velocity decreases, and the pressure gradually recovers with a wide flow channel. The pressure gradient is contrary to the flow direction (Jin et al., Citation2015). With this adverse pressure gradient, backflow zones can be found around the top of the head of the valve spool as a result of fluid viscosity. As affected by the high-speed backflow, the area of the upper bubbles is larger than that on the lower side (Zheng, Ou, Yi, et al., Citation2016).
Figure 9. Numerical results: (a) model schematic of cavitation flow in the valve (not to scale), (b) cavitation intensity on plane A, (c) cavitation intensity on plane C, and (d) cavitation intensity on plane E.
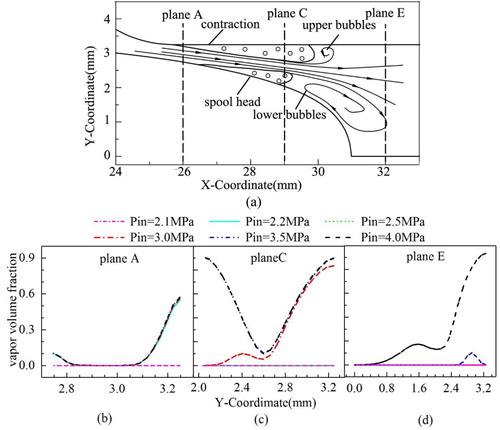
The density of bubbles in the cavitation region (cavitation intensity) can also be represented by using the vapor volume fraction on planes A, C, and E, as presented in Figure (b–d). If bubbles occur, then the vapor volume fraction on plane A decreases firstly, and then remains stable and finally increases along the Y-axis. This condition illustrates that the cavitation intensity on the surface of the throat and spool head is the strongest, and the minimum value is located near the slit between the valve spool and seat. The reason is that cavitation is firstly generated on the surfaces and then developed into the gaps. With Pin≥2.5 MPa, the distribution of cavitation intensity and area on plane A occurs in the same manner, which shows that the cavitation process comes into the steady-cavitation stage. The distribution of volume fraction on plane C is a typical case representing the entire cavitation development process, as shown in Figure (c). When Pin≤2.5 MPa, it is in the no-cavitation stage because the pressure is higher than Pv. When Pin=3.0 MPa, the change in cavitation intensity on plane C is complex, namely, firstly rises, then falls and finally rises again. The first rising point locates at the reflux region and the end of the lower bubbles. With increasing Y-coordinates, cavitation intensity decreases, which corresponds to the position of the channel center. Subsequently, the position extends to the interior of the upper bubbles. The vapor volume fraction rises again and reaches the maximum value on the surface of the contraction section. When Pin>3.0 MPa, the vapor volume fraction reaches the maximum near the walls and the minimum values locate near the gap. The change trend of vapor volume fraction is almost the same, which shows that the cavitation process has entered the steady cavitation stage, as discussed above. Figure (d) shows the developing process of vapor on plane E. When Pin = 3.5 MPa, the fluctuation in vapor volume fraction is influenced by the upper bubbles. The curves of vapor volume fraction at Pin = 4.0 MPa on plane E have a similar tendency with that at Pin = 3.5 MPa on plane C. This condition demonstrates that cavitation bubbles are in the initial cavitation stage with a developing process similar to each other.
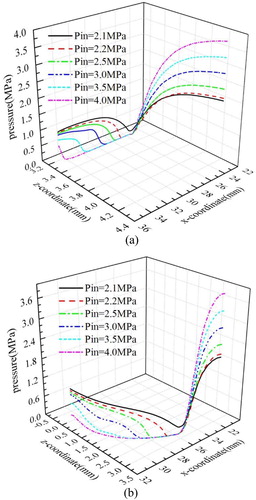
Figure (a,b) show the distribution of pressure in the throat along the surface of the valve seat and the spool head under different inlet pressures. When the oil flows to the contraction section with decreasing flow area, the pressure decreases and the velocity increases. With increasing Pin, the pressure drop gradient in the contraction section increases. In Figure (a), Pin is 2.1 MPa, and the minimum pressure along the valve seat surface on the throat surface is larger than Pv. When Pin increases to 2.2 MPa, the pressure is lower than Pv, and cavitation occurs in the throat. Considerable energy is converted into kinetic energy with increasing Pin, and high-speed and low-pressure zones enlarge. Thus, the larger the input pressure is, the larger the low-pressure area becomes. Figure (b) shows the pressure distribution on the outer surface of the head of the valve spool, which is similar to the distribution of pressure along the valve seat surface. The pressure drop mainly happens at the orifice with the smallest area. Whilst the oil moves downstream, the flow area increases again, the velocity decreases and the pressure rebounds slightly. The pressure rebound is located near the throat exit with high Pin. If Pin rises up to 4.0 MPa, the spool head is covered by low pressure. Consequently, no pressure rebound phenomenon occurs on the spool surface. The pressure distribution fluctuates on the surface of the spool head in the throat due to the geometric characteristics of the spool head.
Figure 10. Numerical results of pressure distribution in the throat: (a) along the valve seat surface, and (b) on the surface of the spool head.
5.2 Cavitation development process in axial direction
The area of vapor volume fraction greater than 1% on the rotating surface is defined as Ac in the axial direction. Figure (a) presents the cavitation isograms with vapor volume fraction equal to 1%. When Pin<2.2 MPa, no bubbles occur. At Pin = 2.2 MPa, cavitation can be found, and a slit exists between the upper and lower parts of the cavitation bubble. The upper and lower parts of bubbles touch each other and form a concave geometry later when Pin = 2.5 MPa. With the continuous development of the cavitation process, the value of Ac becomes larger. The increase rate of cavitation area becomes larger, and the cavitation bubble propagates downstream, when Pin further increases. When Pin increases to 4.0 MPa, the cavitation bubbles nearly fill the throat of the regulating valve and form a smooth outline shape in the flow passage (Long et al., Citation2017).
Figure 11. Numerical results: (a) cavitation isograms with 1% vapor volume fraction and (b) influence of Pin on Ac.
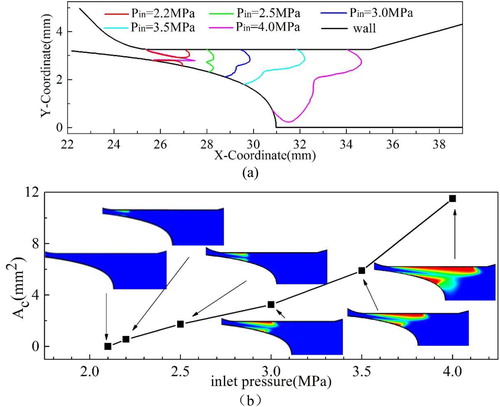
Figure shows the distribution of cavitation intensity or vapor volume fraction on the throat surface. Whilst Pin increases, the maximum of the vapor volume fraction becomes higher, and the length of the vapor–liquid mixing section is also extended. Substantial pressure energy is converted into kinetic energy, and the maximum value of flow velocity increases with increasing Pin. Therefore, the high-velocity zone has the tendency of radial expansion and the velocity gradient between the valve seat and the center of the flow passage increases. This larger velocity gradient enhances the shear strength, the maximum of the vapor volume fraction becomes larger (Zhang et al., Citation2014), and the cavitation strengthens with increasing input pressure. When Pin = 2.1 MPa, no cavitation can be found, and the vapor volume fraction equals 0. As Pin approaches 4.0 MPa, the peak value of the vapor volume fraction at 33.2 mm is close to 0.95, which demonstrates that the inner surface of the throat is almost covered by pure vapor. Figure (b) shows the cavitation intensity distribution along the outer surface of the spool head. Cavitation intensity and length increase with increasing Pin. The maximum vapor volume fraction is nearly 0.95 at Pin = 4.0 MPa, and the maximum value is approximately 0.30 at Pin = 2.2 MPa. During the initial cavitation stage, the rising tendency of vapor volume fraction on the spool head under different inlet pressures is smooth, which illustrates that the growing degree of the cavitation intensity is slower than that on the surface of the valve seat. Nonetheless, a sudden drop in cavitation intensity happens on the inner surface of the valve seat and the outer surface of the spool head. The cavitation intensity starts to increase near the throttling zone and rises to its maximum values at the position of the minimum effective flow cross-section. The fluctuation in drop line, as shown in circles in Figure (b), is due to the unsmooth transition of contour lines on the spool head.
Figure 12. Numerical results: (a) vapor volume fraction on inner surface of valve seat and (b) vapor volume fraction on outer surface of spool head in the throat.
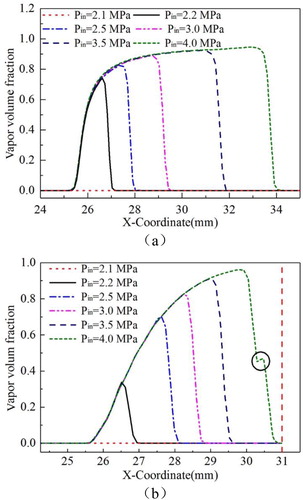
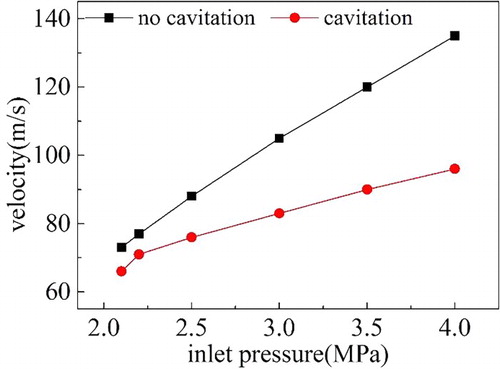
Figure shows the maximum velocity under variable inlet pressures obtained numerically when the Schnerr–Sauer cavitation model is employed or not. The maximum velocity rises with increasing Pin because substantial pressure energy is converted into kinetic energy. A velocity difference exists between the single and mixing fluid. The maximum velocity is smaller when the cavitation model is employed. As the fluid flows through the contraction section of the valve, the bubbles occur once the pressure reduces to the saturated pressure. The re-entrant flow near the end of the cavitation bubbles greatly increases the turbulence intensity, consuming a substantial part of mechanical energy (Jin et al., Citation2016). The appearance of cavitation bubbles also changes the position of the actual minimum effective flow of the cross-section and decreases its effective flow area. The shrinking cross-section area increases the pressure loss and reduces the regulating capacity of the valve. Therefore, the cavitation produces a negative effect on the flow capacity of the regulating valve.
Figure 13. Numerical maximum velocity when the Schnerr–Sauer cavitation model is either employed or not.
6. Conclusion
The cavitation development process under different inlet pressures is investigated in our study. An experimental system is set up to capture cavitation images, and the digital image-processing techniques based on gray-level detection on the images are used to calculate the cavitation length. A 3D numerical model is built to calculate the cavitation characteristic inside the regulating valve. The numerical and experimental results show that bubbles appear near the throat, grow along the inner surface of the throat and form a bubble ring. The cavitation development process is separated into no-cavitation, initial cavitation and steady-cavitation stages. In the initial cavitation stage, the cavitation area and intensity increase with increasing Pin in the radial and axial directions. During the steady-cavitation stage, the cavitation area and intensity remain stable even if Pin increases further. The increasing Pin also affects the outline of cavitation bubbles. A slit exists between the upper and lower bubbles when Pin is small. With the continuous development of Pin, the cavitation area enlarges, and the upper and lower parts of bubbles touch each other and form as a whole. The inlet pressure influences the growth rate of cavitation intensity, maximum velocity and flow capacity in the regulating valve.
Although beneficial results have been obtained in our study, we only focus on the steady-state characteristics of the cavitation development process of the regulating valve. The regulating valve usually works under high temperature and pressure; consequently, the cavitation flow in the valve is a challenging issue. We need to optimize relative interpretative mechanisms in the future.
Acknowledgements
Xiumei Liu designed, supervised the project and revised the manuscript. Zihong Wu performed experiments and wrote the draft. Beibei Li analyzed and Jiyun Zhao discussed the data. Chi Zhang helped to carry out experiments. Li Wei gave some advices about interpreting data. Fangwei Xie gave some advice about revision. All authors discussed the results, implications and commented on the manuscript at all stages.
Disclosure statement
No potential conflict of interest was reported by the authors.
Additional information
Funding
References
- Abdulaziz, A. M. (2014). Performance and image analysis of a cavitating process in a small type venturi. Experimental Thermal and Fluid Science, 53, 40–48. doi: 10.1016/j.expthermflusci.2013.10.010
- Akbarian, E., Najafi, B., Jafari, M., Faizollahzadeh Ardabili, S., Shamshirband, S., & Chau, K.-W. (2018). Experimental and computational fluid dynamics-based numerical simulation of using natural gas in a dual-fueled diesel engine. Engineering Applications of Computational Fluid Mechanics, 12(1), 517–534. doi: 10.1080/19942060.2018.1472670
- Amirante, R., Distaso, E., & Tamburrano, P. (2014). Experimental and numerical analysis of cavitation in hydraulic proportional directional valves. Energy Conversion and Management, 87, 208–219. doi: 10.1016/j.enconman.2014.07.031
- Andriotis, A., Gavaises, M., & Arcoumanis, C. (2008). Vortex flow and cavitation in diesel injector nozzles. Journal of Fluid Mechanics, 610, 195–215. doi: 10.1017/S0022112008002668
- Chern, M.-J., Wang, C.-C., & Ma, C.-H. (2007). Performance test and flow visualization of ball valve. Experimental Thermal and Fluid Science, 31(6), 505–512. doi: 10.1016/j.expthermflusci.2006.04.019
- Cui, B., Lin, Z., Zhu, Z., Wang, H., & Ma, G. (2017). Influence of opening and closing process of ball valve on external performance and internal flow characteristics. Experimental Thermal and Fluid Science, 80, 193–202. doi: 10.1016/j.expthermflusci.2016.08.022
- Dai, X., Wang, Z., Liu, F., Wang, C., Sun, Q., & Xu, C. (2019). Simulation of throttling effect on cavitation for nozzle internal flow. Fuel, 243, 277–287. doi: 10.1016/j.fuel.2019.01.073
- de Graaf, K. L., Brandner, P. A., & Pearce, B. W. (2017). Spectral content of cloud cavitation about a sphere. Journal of Fluid Mechanics, 812, R1-1–13. doi:10.1017/jfm.2016.819.
- Forder, A., Thew, M., & Harrison, D. (1998). A numerical investigation of solid particle erosion experienced within oilfield control valves. Wear, 216(2), 184–193. doi: 10.1016/S0043-1648(97)00217-2
- Ghalandari, M., Mirzadeh Koohshahi, E., Mohamadian, F., Shamshirband, S., & Chau, K. W. (2019). Numerical simulation of nanofluid flow inside a root canal. Engineering Applications of Computational Fluid Mechanics, 13(1), 254–264. doi: 10.1080/19942060.2019.1578696
- Han, M., Liu, Y., Wu, D., Zhao, X., & Tan, H. (2017). A numerical investigation in characteristics of flow force under cavitation state inside the water hydraulic poppet valves. International Journal of Heat and Mass Transfer, 111, 1–16. doi: 10.1016/j.ijheatmasstransfer.2017.03.100
- Jin, Z., Chen, F., Qian, J., Zhang, M., Chen, L., Wang, F., & Fei, Y. (2016). Numerical analysis of flow and temperature characteristics in a high multi-stage pressure reducing valve for hydrogen refueling station. International Journal of Hydrogen Energy, 41(12), 5559–5570. doi: 10.1016/j.ijhydene.2016.02.013
- Jin, Z. Y., Gao, Z. X., Zhang, M., & Qian, J. Y. (2017). Pressure drop analysis of pilot-control globe valve with different structural parameters. Journal Of Fluids Engineering-Transactions Of the Asme, 139(9), 12. doi: 10.1115/1.4036268
- Jin, H., Zheng, Z., Ou, G., Zhang, L., Rao, J., Shu, G., & Wang, C. (2015). Failure analysis of a high pressure differential regulating valve in coal liquefaction. Engineering Failure Analysis, 55, 115–130. doi: 10.1016/j.engfailanal.2015.05.004
- Laı´n, S., Bröder, D., Sommerfeld, M., & Göz, M. F. (2002). Modelling hydrodynamics and turbulence in a bubble column using the Euler–lagrange procedure. International Journal of Multiphase Flow, 28(8), 1381–1407. doi: 10.1016/S0301-9322(02)00028-9
- Li, D., Liu, S., Wei, Y., Liang, R., & Tang, Y. (2018). Numerical investigation on transient internal cavitating flow and spray characteristics in a single-hole diesel injector nozzle: A 3D method for cavitation-induced primary break-up. Fuel, 233, 778–795. doi: 10.1016/j.fuel.2018.06.103
- Liu, C. B., Jiang, S. L., & Zheng, Y. G. (2012). Experimental and computational failure analysis of a valve in a nuclear power plant. Engineering Failure Analysis, 22, 1–10. doi: 10.1016/j.engfailanal.2011.12.001
- Liu, B., Zhao, J., & Qian, J. (2017). Numerical analysis of cavitation erosion and particle erosion in butterfly valve. Engineering Failure Analysis, 80, 312–324. doi: 10.1016/j.engfailanal.2017.06.045
- Long, X., Zhang, J., Wang, J., Xu, M., Lyu, Q., & Ji, B. (2017). Experimental investigation of the global cavitation dynamic behavior in a venturi tube with special emphasis on the cavity length variation. International Journal of Multiphase Flow, 89, 290–298. doi: 10.1016/j.ijmultiphaseflow.2016.11.004
- Margot, X., Hoyas, S., Gil, A., & Patouna, S. (2014). Numerical modelling of cavitation: Validation and Parametric studies. Engineering Applications of Computational Fluid Mechanics, 6(1), 15–24. doi: 10.1080/19942060.2012.11015399
- Mosavi, A., Shamshirband, S., Salwana, E., Chau, K.-W., & Tah, J. H. M. (2019). Prediction of multi-inputs bubble column reactor using a novel hybrid model of computational fluid dynamics and machine learning. Engineering Applications of Computational Fluid Mechanics, 13(1), 482–492. doi: 10.1080/19942060.2019.1613448
- Mou, B., He, B.-J., Zhao, D.-X., & Chau, K.-W. (2017). Numerical simulation of the effects of building dimensional variation on wind pressure distribution. Engineering Applications of Computational Fluid Mechanics, 11(1), 293–309. doi: 10.1080/19942060.2017.1281845
- Qiu, T., Song, X., Lei, Y., Dai, H., Cao, C., Xu, H., & Feng, X. (2016a). Effect of back pressure on nozzle inner flow in fuel injector. Fuel, 173, 79–89. doi: 10.1016/j.fuel.2016.01.044
- Qiu, T., Song, X., Lei, Y., Liu, X., An, X., & Lai, M. (2016b). Influence of inlet pressure on cavitation flow in diesel nozzle. Applied Thermal Engineering, 109, 364–372. doi: 10.1016/j.applthermaleng.2016.08.046
- Qiu, T., Wang, K., Lei, Y., Wu, C., & Guo, P. (2018a). Investigation on effects of upstream flow on submerged jet flow from short cylindrical orifice in common-rail injector. International Journal of Heat and Mass Transfer, 127, 16–20. doi: 10.1016/j.ijheatmasstransfer.2018.08.010
- Qiu, T., Wang, K., Lei, Y., Wu, C., Liu, Y., Chen, X., & Guo, P. (2018b). Investigation on effects of back pressure on submerged jet flow from short cylindrical orifice filled with diesel fuel. Energy, 162, 964–976. doi: 10.1016/j.energy.2018.08.012
- Ramezanizadeh, M., Alhuyi Nazari, M., Ahmadi, M. H., & Chau, K.-W. (2019). Experimental and numerical analysis of a nanofluidic thermosyphon heat exchanger. Engineering Applications of Computational Fluid Mechanics, 13(1), 40–47. doi: 10.1080/19942060.2018.1518272
- Soyama, H., & Hoshino, J. (2016). Enhancing the aggressive intensity of hydrodynamic cavitation through a venturi tube by increasing the pressure in the region where the bubbles collapse. Aip Advances, 6(4), 045113. doi: 10.1063/1.4947572
- Wang, J., Xu, S., Cheng, H., Ji, B., Zhang, J., & Long, X. (2018). Experimental investigation of cavity length pulsation characteristics of jet pumps during limited operation stage. Energy, 163, 61–73. doi: 10.1016/j.energy.2018.08.035
- Wei, M., Gao, Y., Yan, F., Chen, L., Feng, L., Li, G., & Zhang, C. (2017). Experimental study of cavitation formation and primary breakup for a biodiesel surrogate fuel (methyl butanoate) using transparent nozzle. Fuel, 203, 690–699. doi: 10.1016/j.fuel.2017.05.022
- Yang, H., Wang, W., & Lu, K. (2019). Numerical Simulations on flow characteristics of a Nozzle-Flapper Servo valve With Diamond Nozzles. Ieee Access, 7, 28001–28010. doi: 10.1109/ACCESS.2019.2896702
- Yin, B., Yu, S., Jia, H., & Yu, J. (2016). Numerical research of diesel spray and atomization coupled cavitation by Large Eddy simulation (LES) under high injection pressure. International Journal of Heat and Fluid Flow, 59, 1–9. doi: 10.1016/j.ijheatfluidflow.2016.01.005
- Yuan, C., Song, J. C., & Liu, M. H. (2019). Comparison of compressible and incompressible numerical methods in simulation of a cavitating jet through a poppet valve. Engineering Applications Of Computational Fluid Mechanics, 13(1), 67–90. doi: 10.1080/19942060.2018.1552202
- Zhang, J., Mao, J.-R., Wang, S.-S., Wu, B., Yuan, H., Wang, K.-G., … Sun, P. (2014). Experimental study on the cavitation characteristics of an oil jet pump with multiple nozzles for the lubrication system in a Steam turbine. Journal of Engineering for Gas Turbines and Power, 136(12), 122605. doi: 10.1115/1.4027832
- Zheng, Z., Ou, G. F., & Jin, H. Z. (2017). Numerical-experimental study on the erosion-cavitation wear of coal oil slurry valve. In B. Li, R. Baliga, & S. Finneran (Eds.), Proceedings of the asme pressure vessels and piping conference (Vol. 3A, pp. 65237-1–7). Waikoloa, Hawaii, USA: Amer Soc Mechanical Engineers, Three Park Avenue, New York, NY 10016-5990 USA.
- Zheng, Z., Ou, G., Ye, H., Zhang, L., Wang, C., Jin, H., & Shu, G. (2016). Investigation on failure process and structural optimization of a high pressure letdown valve. Engineering Failure Analysis, 66, 223–239. doi: 10.1016/j.engfailanal.2016.04.023
- Zheng, Z., Ou, G., Yi, Y., Shu, G., Jin, H., Wang, C., & Ye, H. (2016). A combined numerical-experiment investigation on the failure of a pressure relief valve in coal liquefaction. Engineering Failure Analysis, 60, 326–340. doi: 10.1016/j.engfailanal.2015.11.055