
 ?Mathematical formulae have been encoded as MathML and are displayed in this HTML version using MathJax in order to improve their display. Uncheck the box to turn MathJax off. This feature requires Javascript. Click on a formula to zoom.
Abstract
Augmenting the thermal conductivity (TC) of fluids makes them more favorable for thermal applications. In this regard, nanofluids are suggested for achieving improved heat transfer owing to their modified TC. The TC of the base fluid, the volume fraction and mean diameter of particles, and the temperature are the main elements influencing the TC of nanofluids. In this article, two approaches, namely multivariate adaptive regression splines (MARS) and group method of data handling (GMDH), are applied for forecasting the TC of ethylene glycol-based nanofluids containing SiC, Ag, CuO, ,
and MgO particles. Comparison of the data forecast by the models with experimental values shows a higher level of confidence in GMDH for modeling the TC of these nanofluids. The
values determined using MARS and GMDH for modeling are 0.9745 and 0.9332, respectively. Moreover, the importance of the inputs is ranked as volume fraction, TC of the solid phase, temperature and particle dimensions.
1. Introduction
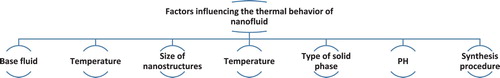
A nanofluid is a colloidal suspension composed of a base fluid and particles with sizes in the range of 1–100 nm. The suspension of solid particles leads to augmented thermal conductivity (TC) (Jiang, Zhang, & Shi, Citation2015); consequently, the heat transfer features are improved. Owing to their enhanced thermal properties, nanofluids are promising options for utilization in heat exchangers, thermal media and energy systems to improve the heat transfer rate and modify the thermal management of devices with high heat flux (Gandomkar, Saidi, Shafii, Vandadi, & Kalan, Citation2017; Ramezanizadeh, Nazari, Ahmadi, & Açıkkalp, Citation2018; Ramezanizadeh, Nazari, Ahmadi, & Chen, Citation2019). Several research studies have shown the superior performance of nanofluids in thermal media and their ability to increase heat transfer. Heat transfer augmentation of thermal media achieved by employing nanofluids is mainly attributed to their modified TC (Nazari, Ghasempour, Ahmadi, Heydarian, & Shafii, Citation2018). The contribution of nanofluids in heat transfer modification is controlled by their specification, such as the type and structure of solid particles, fraction of nanostructures, TC of the fluid containing dispersed particles and temperature of the nanofluid. Some of the main parameters with an impact on the features of nanofluids are presented in Figure .
Figure 1. Some of the factors affecting the thermal features of nanofluids.
Because of the significant role of TC in the heat transfer ability of nanofluids, numerous studies have focused on this field of research. In a study by Izadkhah, Erfan-Niya, and Heris (Citation2019), the impact of the dispersion of graphene oxide nanostructures on the TC of a water–ethylene glycol (EG) mixture was investigated. They observed that the existence of the nanosheets in the base fluid at a concentration of 5% led to up to 33% augmentation in the TC. In other research (Gao, Wang, Sasmito, & Mujumdar, Citation2018), graphene nanoplatelets were added to various base fluids such as water, EG and their mixture to evaluate their TC. The results showed that enhancement of the TC was dependent on the type of base fluid in a constant fraction of the solid phase. Omrani, Esmaeilzadeh, Jafari, and Behzadmehr (Citation2019) measured the TC of multi-walled carbon nanotube/water nanofluid in 0.5% volume concentration and observed up to 36% enhancement in the TC of the fluid in the presence of the nanostructure. Michael, Zagabathuni, Ghosh, and Pabi (Citation2019) investigated the influence of adding boron nitride nanoparticles on the TC of EG and EG–water mixture. It was observed that the existence of these particles in 3% volume fraction in EG and EG–water mixture resulted in up to approximately 15.5% and 12.5% augmentation in the TC, respectively. In addition to single-type nanostructures, multiple nanostructures can be added to fluid to obtain hybrid nanofluids. Similarly to conventional nanofluids, the TC of these kinds of nanofluids is enhanced by the addition of solid structures. Taherialekouhi, Rasouli, and Khosravi (Citation2019) measured the TC of graphene oxide–aluminum oxide/water nanofluid in various volume fractions and concentrations. They noticed that the maximum enhancement in TC occurred at the highest temperature (50°C) and concentration (1%), and was equal to 33.9%. The impacts of the features of nanofluids on their TC can be different. For instance, according to Jiang et al. (Citation2015), the TC of carbon nanotube/water nanofluid increased nonlinearly with the concentration of the solid phase, while it was linear with the temperature.
Various algorithms have been tested to forecast the TC of nanofluids. Correlations obtained by curve fitting are used to predict the TC of nanofluids. Despite the simplicity in their utilization, their confidence is lower compared with the models designed on the basis of intelligence methods (Esfe, Esfande, & Rostamian, Citation2017; Ramezanizadeh, Ahmadi, Nazari, Sadeghzadeh, & Chen, Citation2019). In most cases, the proposed models based on intelligence approaches are applicable for a specific type of nanofluid (Ramezanizadeh, Nazari, Ahmadi, Lorenzini, & Pop, Citation2019). For instance, Ahmadi, Nazari, et al. (Citation2018) modeled the TC of /water nanofluid using three different intelligent models. The highest correlation of the coefficient obtained by the employed methods was 0.899. Alhuyi Nazari et al. (Citation2018) used an artificial neural network (ANN) to estimate the TC of CuO/EG nanofluid. The determined
value in their study was approximately 0.992. The group method of data handling (GMDH) is among the attractive techniques in TC estimation of nanofluids owing to its efficient performance and appropriate structure. Ramezanizadeh and Nazari (Citation2019) assessed the performance of GMDH in forecasting the TC of Ag/water nanofluid compared with a quadratic polynomial. They concluded that the GMDH-based model was much more accurate and its
value was 0.99. Ahmadi, Hajizadeh, et al. (Citation2018), used GMDH to model the TC of
/EG and
/water nanofluids, and observed the high accuracy of this method when considering all the influential parameters in the inputs of the model.
EG and EG-based nanofluids have various applications in energy systems, such as in heat exchangers, solar collectors and the thermal management of fuel cells (Islam & Shabani, Citation2019). For instance, Niranjan, Chilambarasan, Raja Sekhar, and Vikranthreddy (Citation2017) utilized ZnO/EG nanofluid in a flat-plate solar collector. In another study (Arya, Sarafraz, & Arjomandi, Citation2018), MgO/EG nanofluid was used in a heat exchanger in different solid phase concentrations. It was observed that the addition of the nanoparticles remarkably improved the thermal performance of the heat exchanger. Zamzamian, Oskouie, Doosthoseini, Joneidi, and Pazouki (Citation2011) used CuO and nanoparticles in EG and tested this as the operating fluid in double pipe and plate heat exchangers. They observed that by using the nanofluids, up to 50% increase in the convective heat transfer coefficient could be achieved. In research by Goudarzi and Jamali (Citation2017),
/EG nanofluid was used in a car radiator integrated with wire coil. It was noticed that using nanofluid could improve the thermal performance by up to 5% compared with the case using pure EG.
As mentioned previously, most of the studies concerning the TC of nanofluids have focused on special types, which limits their application. In this regard, more comprehensive forecasting models, with applicability to various solid materials as nanoparticles, need to be developed. In this regard, two efficient methods, the group method of data handling (GMDH) and multivariate adaptive regression splines (MARS), are utilized in this study to model the TC of EG-based nanofluids. The MARS algorithm is applied owing to its simple structure, accuracy and ease of use, while GMDH is selected as the secondary approach since it has a simpler structure than other ANN methods. In this regard, more than 300 items of data, in various conditions and with different concentrations, sizes and particle material, are gathered from experimental research. Finally, the confidence of the models is assessed with regard to different statistical values.
2. Methods
Interactions with various complexities, such as nonlinearities of the system, can be analyzed by the MARS model approach. In this method, various basis functions are implemented. This approach is employed owing to its ability to prognosticate the continuous dependent variable values, , based on a group of independent illustrative variables,
. The multivariate adaptive regression is presented as (Oduro, Metia, Duc, & Ha, Citation2015)
(1)
(1) where function
is the summation of weighted basis functions, which varies based on
diversification; and
is an
array vector that represents the error function.
The MARS method creates an adaptive environment to connect the nonlinearities of the system’s response and predictor elements. This goal is achieved by appointing the gain data to piecewise linear regression functions. Another advantage of the MARS method is that it does not demand a priori presumptions regarding elemental correlations among dependent and independent factors. This correlation is revealed by a group of coefficients and the order of polynomials as the basis functions, which are completely acquired from the regression data. This method is built based on coupling the basis functions into the discrete gaps of the independent elements. It should be noted that these piecewise polynomials possess sections which are associated uniformly with each other, and the joint points of these pieces, named knots or nodes, are expressed here as
.
Each proportion of the mentioned polynomials that are of degree is a polynomial function. A two-sided truncated power function is given in Equations (Equation2
(2)
(2) ) and (Equation3
(3)
(3) ). This function is implemented by the MARS method as the polynomial basis function (Oduro et al., Citation2015; Xu et al., Citation2004):
(2)
(2)
(3)
(3) In Equations (Equation2
(2)
(2) ) and (Equation3
(3)
(3) ),
represents the power to which the polynomials are raised. This parameter also determines the order to which the result function is smoothed. Furthermore, the two-sided truncated functions for dependent elements are considered as the basis functions.
The MARS global method has been studied by Put, Xu, Massart, and Vander Heyden (Citation2004) and is defined as
(4)
(4) where
is the predicted response, and
performs as the coefficient of the basis function. The
th basic function is expressed as
and can be either a single polynomial function or a combination of two or more polynomial functions, and
is the coefficient related to the
th basis function.
counts the number of basis functions that the MARS algorithm takes into account.
The MARS method carries out three major steps to be fitted. The first step is called the constructive step, in which the basis functions are added by implementing a forward stepwise approach. Furthermore, in this stage of the MARS method, two vital parameters (i.e. the predictor and locations of nodes) which have a significant impact on the accuracy of the results are selected. Interactions are also presented to investigate whether they have any relationship with the model fit improvement. The second step is devoted to eradicating the superfluous basis functions to enhance the prediction. This goal is achieved using a backward stepwise approach. Generalized cross-validation (GCV) is used by the MARS method as a criterion to determine the most efficient model among a series of presented models. A greater value of GCV creates a smaller model, and a lower value of GCV produces a bigger model. Equation (Equation5(5)
(5) ) presents the GCV criterion (Oduro et al., Citation2015; Xu et al., Citation2004):
(5)
(5) where the complexity function is denoted by
.
can be defined as
, in which
is the cost of each basis function and is decided on by the user. This parameter can determine the smoothing of the approach, and
is the number of elements that need to be fitted. The parameter
determines the number of basis functions that can be eradicated, i.e. the greater the cost, the more basis functions are expunged.
Finally, the third step determines the optimized MARS model based on assessing the features of the introduced fitted models. More details on this method can be found in Oduro et al. (Citation2015) and Xu et al. (Citation2004). To obtain the importance score of the input variables, the GCV function is used. The importance of the input variables indicates the increment in the value of GCV once the applied basis functions with specific variables have been dropped, and the remaining basis functions are refitted to the target in the original form, using ordinary least squares regression.
In addition to the MARS approach, GMDH is tested for TC modeling. In general, Volterra–Kolmogorov–Gabor (VKG) polynomials (Equation Equation6(6)
(6) ) can be applied to model complex systems that contain a set of data with numerous independent and dependent variables (Ahmadi, Sadeghzadeh, Raffiee, & Chau, Citation2019; Zoqi, Ghamgosar, Ganji, & Fallahi, Citation2016).
(6)
(6) where
is the vector representing the independent variables, y denotes the model outputs, and
are the coefficients of the polynomials. These types of polynomials are estimated by employing second degree polynomials. These quadratic polynomials are based on the binary combinations of the inputs. GMDH algorithms have been proposed by utilizing this method as the training approach for complicated relationship modeling (Ahmadi, Ahmadi, Mehrpooya, & Rosen, Citation2015; Zoqi et al., Citation2016).
GMDH is a multilayered, structured and feed-forward system, comprising a set of neurons that are generated by the coupling of different input pairs via the above-mentioned polynomials. The layers of the networks are composed of one or more processing units. These units are the components of the model and are assumed to be second degree polynomials (Equation Equation7(7)
(7) ) (Ahmadi et al., Citation2015; Zoqi et al., Citation2016):
(7)
(7) The coefficients of the applied relationship presented in Equation (Equation7
(7)
(7) ) are unknown parameters of this method. To determine the quantity of each vector,
, on the basis of Equation (Equation7
(7)
(7) ), the mean of the squares of the error (Equation Equation8
(8)
(8) ) should be minimized (Ahmadi et al., Citation2015; Zoqi et al., Citation2016):
(8)
(8) Equation (Equation8
(8)
(8) ) can be used to achieve the lowest value of error. By inserting Equation (Equation7
(7)
(7) ) into this partial derivative, a matrix equation (Aa = Y) will be obtained, where
,
, and matrix A is shown as (Komeilibirjandi, Raffiee, Maleki, Nazari, & Shadloo, Citation2019):
(9)
(9) One method that can be used to solve equation (Aa = Y) is singular value decomposition. In this case, the unknown value of a can be determined by implementing Equation (Equation10
(10)
(10) ) (Komeilibirjandi et al., Citation2019):
(10)
(10)
In Equation (Equation10(10)
(10) ),
the matrix A is transposed. Using this approach, the unknown value of a can be determined for any case. If (
) cannot be inverted, the Tikhonov method can be used to obtain the solution to the equation. In GMDH design, the purpose is to avoid the growth of divergence and to associate the network structure with some numerical parameters, so that by changing a parameter the structure of the network will also vary. Evolutionary methods, including the genetic algorithm (GA), are widely used in different steps of the design of the network because of their ability to achieve the optimal quantities and to explore spaces with unpredictable features. In general, the GA is adopted for designing the structure and shape of GMDH and determining its coefficients. In this research, GMDH Shell is used to perform this algorithm for modeling the TC of EG-based nanofluids.
Finally, for the assessment and comparison of the models, three criteria, namely the relative error (RE), R-squared () and mean square error (MSE), are applied. Values of
closer to 1 mean a higher confidence level of the model, whereas lower values of the RE and MSE are more favorable in terms of model accuracy. These statistical criteria are determined as follows:
3. Results and discussion
The freezing point of EG is approximately −12°C, which makes it appropriate for use in temperature ranges where the possibility of water freezing exists. EG is used as a heat transfer fluid in systems such as car radiators, solar (Ahmed, Baig, Sundaram, & Mallick, Citation2019; Shu et al., Citation2019) and geothermal technologies (Talluri, Manfrida, & Fiaschi, Citation2019), and in the evaporator section of absorption systems (Vasudev & Dondapati, Citation2017). In the present article, MARS and GMDH are applied to forecast the TC of EG-based nanofluids. To propose comprehensive models, different experimental studies were selected for data extraction. The EG-based nanofluids considered in the present research contain , CuO, MgO, SiC, Ag and
nanoparticles. The studies used for data extraction have been carried out over a wide range of temperatures, volume fractions and mean particle diameters; therefore, these parameters are used as inputs to develop more confident and comprehensive models. The ranges of inputs are presented in Table .
Table 1. Minimum and maximum values of inputs.a
The proposed models have four inputs, namely the temperature, size and volume fraction, and TC of the solid phase. Several studies have been carried out to investigate the impact of temperature and volume fraction on the TC and it is concluded that increases in the values of these parameters lead to increased TC. An increase in temperature results in an increment in the TC of the nanofluids, which is mostly attributed to the Brownian motion of the particles (Ahmadi, Mirlohi, Nazari, & Ghasempour, Citation2018). In general, the TC of the solid phase is higher than that of the liquids; therefore, improved TC is expected with the increment in the volume fraction of solids in the base fluid.
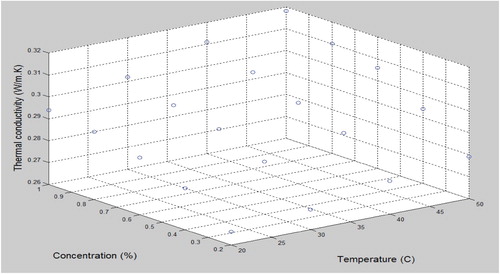
More than 300 items of data were extracted from various experimental data sets to take all of the influential factors into account. According to the previous studies, the temperature and nanostructure volume fraction have remarkable impacts on the TC. Augmentation in both of these parameters leads to augmentation in the TC, as shown in Figure for a sample of SiC/EG nanofluid. In contrast to the clear impact of temperature and volume fraction on the TC of nanofluids, the reported data on the impact of particle diameter are different (Li & Peterson, Citation2007; Warrier & Teja, Citation2011). The impact of particle size on the TC may be dependent on the type of particles and other variables. Models with complex structures, such as ANNs, are able to consider the possible interaction of inputs and provide appropriate relationships among the variables.
Figure 2. Thermal conductivity of SiC/ethylene glycol nanofluid vs volume fraction and temperature.
In the first stage of the current research, the MARS method is used to model the TC. In this regard, the TC, mean size and volumetric concentration of the particles, in addition to temperature, were defined as the inputs of the model. The relationship between the considered inputs and outputs is determined as:
(11)
(11) The basis functions of this relationship are shown in Table , where
,
,
and
denote the temperature, volume fraction of solids, particle size and TC of the nanoparticles, respectively. In Figure , the outputs determined by the model are compared with the data measured in experimental works (i.e. actual data). For the MARS model,
is 0.9332, which means appropriate prediction of the actual data using the presented model.
Figure 3. Model prediction vs actual data using the multivariate adaptive regression splines (MARS) model.
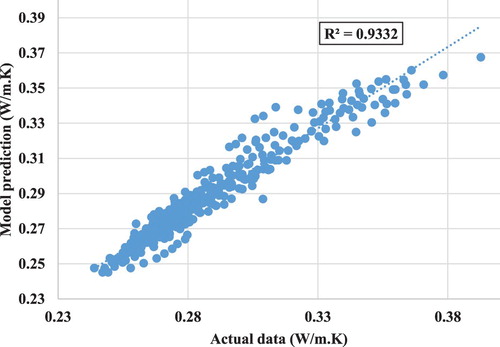
Table 2. Basis functions of the model for predicting the thermal conductivity of ethylene glycol-based nanofluids.
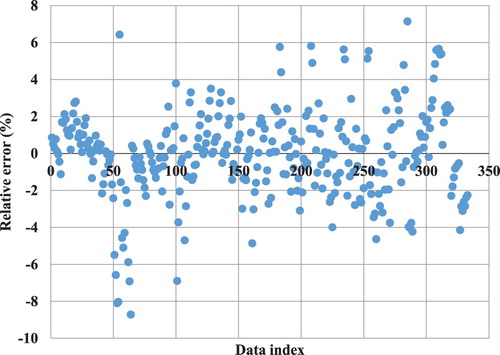
In addition to the values of , the REs of the model for the data were determined. As shown in Figure , the maximum absolute RE of the MARS model is approximately 8.7%, while in the majority of cases, the RE value is in the range of
. The value of the average absolute RE when MARS is used for modeling is approximately 1.76%. The low values of the model RE prove the confidence of this method in forecasting the TC of the considered nanofluids.
Figure 4. Relative error of the multivariate adaptive regression splines (MARS) model in forecasting the thermal conductivity of nanofluids.
In the second model, GMDH was used to estimate the TC of the EG-based nanofluids on the basis of the previously indicated inputs. It should be noted that 70% of the experimental sets, which were chosen randomly, were employed for network training and the remainder for testing. The relationship between the output, TC of the nanofluid and the inputs is presented in Appendix 1. As in the MARS model, ,
,
and
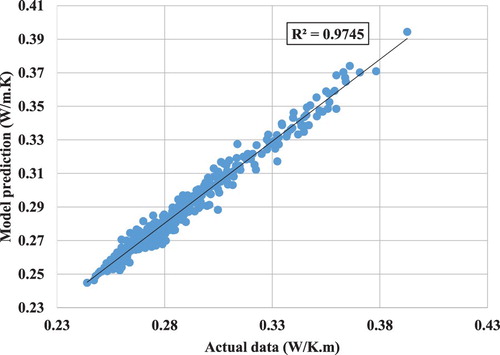
refer to the temperature, volume fraction of solids, particle size and TC of the nanoparticles, respectively. In Figure , outputs calculated by the GMDH are compared with the corresponding experimental values (actual data). For the GMDH model,
equals 0.9745, which is closer to 1 in comparison with the corresponding value in the MARS model. The increased value of
reveals the improved confidence of the model in the case of applying GMDH.
Figure 5. Model prediction vs actual data using the group method of data handling (GMDH) model.
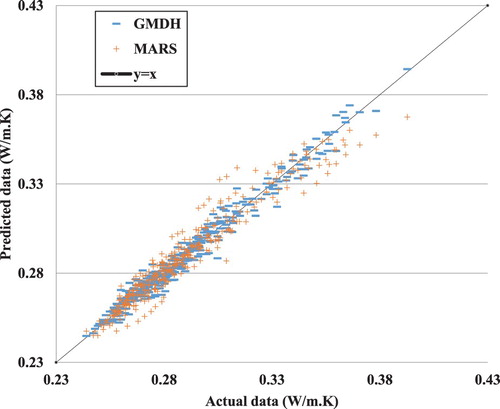
Similarly to the previous model, the model is assessed on the basis of RE. When adopting GMDH to estimate the TC, the maximum absolute value of RE was approximately 5.4%, while in the majority of the modeled cases, the value of RE is in the range of . The average absolute RE in this case is about 1.21% (Figure ). The closeness of the REs to zero demonstrates the appropriateness of both the approach and considered inputs for predicting the TC of the nanofluids. To facilitate comparison of the proposed models, the data forecast by the models and their corresponding values are shown in Figure . As illustrated in this figure, applying GMDH resulted in closer data between the actual and predicted conditions (nearer to the y = x line).
Figure 6. Relative error of the group method of data handling (GMDH) model in forecasting the thermal conductivity of nanofluids.
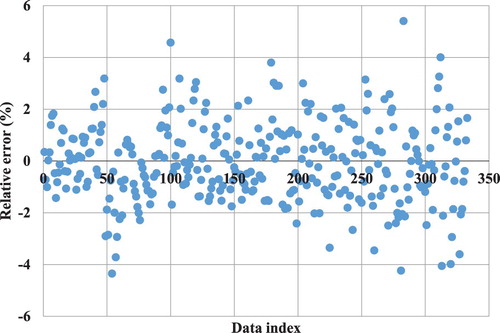
Figure 7. Thermal conductivity predicted by the group method of data handling (GMDH) and multivariate adaptive regression splines (MARS) models vs actual values.
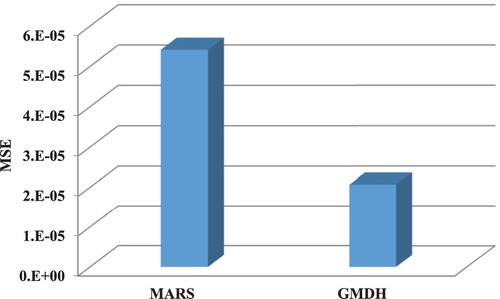
The MSE is another criterion which is applicable for the assessment of regressions. As shown in Figure , the MSE value of the GMDH-based model is much lower than for the MARS-based model, which is further evidence of the more favorable confidence of GMDH.
Figure 8. Mean square error (MSE) values of the multivariate adaptive regression splines (MARS) and group method of data handling (GMDH) models.
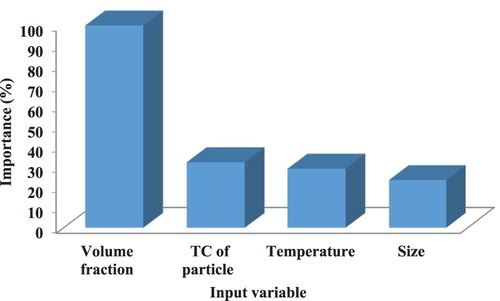
Finally, the importance of the inputs was defined. According to the analysis performed on the inputs and their impacts on the output value, the most important input was the volume fraction of the particles, followed by the TC of the particles, temperature and the dimension of the particles, as shown in Figure .
Figure 9. Importance of input variables in the thermal conductivity (TC) of ethylene glycol-based nanofluids.
4. Conclusion
In the present article, two methods (MARS and GMDH) were used to forecast the TC of EG-based nanofluids. The case studies presented in this article assessed nanofluids containing Ag, MgO, CuO, SiC, and
particles in nanometer dimensions. The models used the size, volume fraction and TC of the particles and temperature as the inputs. The key results of the models can be summarized as follows:
Both models were able to confidently forecast the TC of the nanofluids, with maximum deviations of 8.71% and 5.4% for MARS and GMDH, respectively.
The
values of the MARS- and GMDH-based models were equal to 0.9332 and 0.9745, respectively.
The average absolute REs of the MARS- and GMDH-based models were 1.76% and 1.21%, respectively.
Among the considered inputs, the volume fraction of the solid phase had the greatest impact on the TC value, followed by the TC of solids, temperature and dimensions of the particles.
Nomenclature
| = | Vector of coefficients | |
| = | ith coefficient of a polynomial | |
| = | ith basis function | |
| = | Number of parameters to be fitted | |
| = | Sum of the square errors | |
| GCV | = | Generalized cross-validation |
| MSE | = | Mean square error |
| RE | = | Relative error |
| = | Temperature (°C) | |
| = | Volume fraction of solid phase | |
| = | Particle size | |
| = | Thermal conductivity of the particles | |
| = | Coefficient of the mth basis function |
Disclosure statement
No potential conflict of interest was reported by the authors.
References
- Agarwal, R., Verma, K., Agrawal, N. K., Duchaniya, R. K., & Singh, R. (2016). Synthesis, characterization, thermal conductivity and sensitivity of CuO nanofluids. Applied Thermal Engineering, 102, 1024–1036. doi: 10.1016/j.applthermaleng.2016.04.051
- Ahmadi, M. H., Ahmadi, M. A., Mehrpooya, M., & Rosen, M. A. (2015). Using GMDH neural networks to model the power and torque of a Stirling engine. Sustainability (Switzerland), 7(2), 2243–2255. doi: 10.3390/su7022243
- Ahmadi, M. H., Hajizadeh, F., Rahimzadeh, M., Shafii, M. B., Chamkha, A. J., Lorenzini, G., & Ghasempour, R. (2018). Application GMDH artificial neural network for modeling of Al2O3/water and Al2O3/ethylene glycol thermal conductivity. International Journal of Heat and Technology, 36(3), 773–782.
- Ahmadi, M. H., Mirlohi, A., Nazari, M. A., & Ghasempour, R. (2018). A review of thermal conductivity of various nanofluids. Journal of Molecular Liquids, 265(September), 181–188. doi: 10.1016/J.MOLLIQ.2018.05.124
- Ahmadi, M. H., Nazari, M. A., Ghasempour, R., Madah, H., Shafii, M. B., & Ahmadi, M. A. (2018). Thermal conductivity ratio prediction of Al2O3/water nanofluid by applying connectionist methods. Colloids and Surfaces A: Physicochemical and Engineering Aspects, 541(March), 154–164. doi: 10.1016/J.COLSURFA.2018.01.030
- Ahmadi, M. H., Sadeghzadeh, M., Raffiee, A. H., & Chau, K.-w. (2019). Applying GMDH neural network to estimate the thermal resistance and thermal conductivity of pulsating heat pipes. Engineering Applications of Computational Fluid Mechanics, 13(1), 327–336. doi: 10.1080/19942060.2019.1582109
- Ahmed, A., Baig, H., Sundaram, S., & Mallick, T. K. (2019). Use of nanofluids in solar PV/thermal systems. International Journal of Photoenergy, 2019(June), 1–17. doi: 10.1155/2019/8039129
- Akilu, S., Baheta, A. T., Minea, A. A., & Sharma, K. V. (2017). Rheology and thermal conductivity of non-porous Silica (SiO2) in viscous glycerol and ethylene glycol based nanofluids. International Communications in Heat and Mass Transfer, 88(November), 245–253. doi: 10.1016/J.ICHEATMASSTRANSFER.2017.08.001
- Alhuyi Nazari, M., Ahmadi, M. H., Lorenzini, G., Maddah, H., Alavi, M. F., & Ghasempour, R. (2018). Modeling thermal conductivity ratio of CuO/ethylene glycol nanofluid by using artificial neural network. Defect and Diffusion Forum, 388(October), 39–43. doi: 10.4028/www.scientific.net/DDF.388.39
- Arya, H., Sarafraz, M. M., & Arjomandi, M. (2018). Heat transfer and fluid flow of MgO/ethylene glycol in a corrugated heat exchanger. Journal of Mechanical Science and Technology, 32(8), 3975–3982. doi: 10.1007/s12206-018-0748-x
- Esfe, M. H., Esfande, S., and Rostamian, S. H. (2017, November). Experimental evaluation, new correlation proposing and ANN modeling of thermal conductivity of ZnO-DWCNT/EG hybrid nanofluid for internal combustion engines applications. Applied Thermal Engineering, 133, 452–463. doi: 10.1016/j.applthermaleng.2017.11.131
- Gandomkar, A., Saidi, M. H., Shafii, M. B., Vandadi, M., & Kalan, K. (2017). Visualization and comparative investigations of pulsating Ferro-fluid heat pipe. Applied Thermal Engineering, 116(April), 56–65. doi: 10.1016/J.APPLTHERMALENG.2017.01.068
- Gao, Y., Wang, H., Sasmito, A. P., & Mujumdar, A. S. (2018). Measurement and modeling of thermal conductivity of graphene Nanoplatelet water and ethylene glycol base nanofluids. International Journal of Heat and Mass Transfer, 123(August), 97–109. doi: 10.1016/J.IJHEATMASSTRANSFER.2018.02.089
- Goudarzi, K., & Jamali, H. (2017). Heat transfer enhancement of Al2O3-EG nanofluid in a car radiator with wire coil inserts. Applied Thermal Engineering, 118(May), 510–517. doi: 10.1016/J.APPLTHERMALENG.2017.03.016
- Hemmat Esfe, M., Saedodin, S., Bahiraei, M., Toghraie, D., Mahian, O., & Wongwises, S. (2014). Thermal conductivity modeling of MgO/EG nanofluids using experimental data and Artificial Neural network. Journal of Thermal Analysis and Calorimetry, 118(1), 287–294. doi: 10.1007/s10973-014-4002-1
- Islam, R., & Shabani, B. (2019). Prediction of electrical conductivity of TiO2 water and ethylene glycol-based nanofluids for cooling application in low temperature PEM fuel cells. In Energy Procedia, 160:550–57. Elsevier Ltd. doi: 10.1016/j.egypro.2019.02.205
- Izadkhah, M.-S., Erfan-Niya, H., & Heris, S. Z. (2019). Influence of graphene oxide nanosheets on the stability and thermal conductivity of nanofluids. Journal of Thermal Analysis and Calorimetry, 135(1), 581–595. doi: 10.1007/s10973-018-7100-7
- Jiang, H., Zhang, Q., & Shi, L. (2015). Effective thermal conductivity of carbon nanotube-based nanofluid. Journal of the Taiwan Institute of Chemical Engineers, 55(October), 76–81. doi: 10.1016/j.jtice.2015.03.037
- Komeilibirjandi, A., Raffiee, A. H., Maleki, A., Nazari, M. A., and Shadloo, M. S. (2019, September). Thermal conductivity prediction of nanofluids containing CuO nanoparticles by using correlation and artificial neural network. Journal of Thermal Analysis and Calorimetry, 1–11. doi: 10.1007/s10973-019-08838-w
- Lee, S., Choi, S. U.-S., Li, S., & Eastman, J. A. (1999). Measuring thermal conductivity of fluids containing oxide nanoparticles. Journal of Heat Transfer, 121(2), 280–289. doi: 10.1115/1.2825978
- Li, C. H., & Peterson, G. P. (2007). The effect of particle size on the effective thermal conductivity of Al2O3-water nanofluids. Journal of Applied Physics, 101(4), 044312. doi: 10.1063/1.2436472
- Li, X., Zou, C., Lei, X., & Li, W. (2015). Stability and enhanced thermal conductivity of ethylene glycol-based SiC nanofluids. International Journal of Heat and Mass Transfer, 89(October), 613–619. doi: 10.1016/J.IJHEATMASSTRANSFER.2015.05.096
- Liu, M.-S., Lin, M. C.-C., Huang, I.-T., & Wang, C.-C. (2006). Enhancement of thermal conductivity with CuO for nanofluids. Chemical Engineering & Technology, 29(1), 72–77. doi: 10.1002/ceat.200500184
- Michael, M., Zagabathuni, A., Ghosh, S., & Pabi, S. K. (2019). Thermo-physical properties of pure ethylene glycol and water–ethylene glycol mixture-based boron nitride nanofluids. Journal of Thermal Analysis and Calorimetry, 137(2), 369–380. doi: 10.1007/s10973-018-7965-5
- Nazari, M. A., Ghasempour, R., Ahmadi, M. H., Heydarian, G., & Shafii, M. B. (2018). Experimental investigation of graphene oxide nanofluid on heat transfer enhancement of pulsating heat pipe. International Communications in Heat and Mass Transfer, 91, 90–94. doi: 10.1016/j.icheatmasstransfer.2017.12.006
- Niranjan, G., Chilambarasan, L., Raja Sekhar, Y., & Vikranthreddy, D. (2017). Performance studies on solar collector with grooved absorber tube configuration using aqueous ZnO–ethylene glycol nanofluids. Applied Solar Energy (English Translation of Geliotekhnika, 53(3), 215–221. doi: 10.3103/S0003701X17030082
- Oduro, S. D., Metia, S., Duc, H., and Ha, Q. P. (2015). Predicting carbon monoxide emissions with multivariate adaptive regression splines (MARS) and artificial neural networks (ANNs). In Proceedings of the 32nd International Symposium on Automation and Robotics in Construction and Mining (ISARC 2015). doi: 10.22260/ISARC2015/0122
- Omrani, A. N., Esmaeilzadeh, E., Jafari, M., & Behzadmehr, A. (2019). Effects of multi walled carbon nanotubes shape and size on thermal conductivity and viscosity of nanofluids. Diamond and Related Materials, 93(March), 96–104. doi: 10.1016/J.DIAMOND.2019.02.002
- Put, R., Xu, Q. S., Massart, D. L., & Vander Heyden, Y. (2004). Multivariate adaptive regression splines (MARS) in chromatographic quantitative structure-retention relationship studies. Journal of Chromatography A, 1055(1–2), 11–19. doi: 10.1016/j.chroma.2004.07.112
- Ramezanizadeh, M., Ahmadi, M. H., Nazari, M. A., Sadeghzadeh, M., & Chen, L. (2019). A review on the utilized machine learning approaches for modeling the dynamic viscosity of nanofluids. Renewable and Sustainable Energy Reviews, 114(October), 109345. doi: 10.1016/J.RSER.2019.109345
- Ramezanizadeh, M., and Nazari, M. A. (2019, August). Modeling thermal conductivity of Ag/water nanofluid by applying a mathematical correlation and artificial neural network. International Journal of Low-Carbon Technologies, 14, 468–474. doi: 10.1093/ijlct/ctz030
- Ramezanizadeh, M., Nazari, M. A., Ahmadi, M. H., & Açıkkalp, E. (2018). Application of nanofluids in thermosyphons: A review. Journal of Molecular Liquids, 272(December), 395–402. doi: 10.1016/J.MOLLIQ.2018.09.101
- Ramezanizadeh, M., Nazari, M. A., Ahmadi, M. H., & Chen, L. (2019). A review on the approaches applied for cooling fuel cells. International Journal of Heat and Mass Transfer, 139(August), 517–525. doi: 10.1016/J.IJHEATMASSTRANSFER.2019.05.032
- Ramezanizadeh, M., Nazari, M. A., Ahmadi, M. H., Lorenzini, G., & Pop, I. (2019, March). A review on the applications of intelligence methods in predicting thermal conductivity of nanofluids. Journal of Thermal Analysis and Calorimetry, 1–17. doi: 10.1007/s10973-019-08154-3
- Shu, L., Zhang, J., Fu, B., Xu, J., Tao, P., Song, C., … Deng, T. (2019). Ethylene glycol-based solar-thermal fluids dispersed with reduced graphene oxide. RSC Advances, 9(18), 10282–10288. doi: 10.1039/C8RA09533G
- Simpson, S., Schelfhout, A., Golden, C., & Vafaei, S. (2019). Nanofluid thermal conductivity and effective parameters. Applied Sciences, 9(1), 87. doi: 10.3390/app9010087
- Taherialekouhi, R., Rasouli, S., & Khosravi, A. (2019). An experimental study on stability and thermal conductivity of water-graphene oxide/aluminum oxide nanoparticles as a cooling hybrid nanofluid. International Journal of Heat and Mass Transfer, 145(December), 118751. doi: 10.1016/J.IJHEATMASSTRANSFER.2019.118751
- Talluri, L., Manfrida, G., & Fiaschi, D. (2019). Thermoelectric energy storage with geothermal heat integration – exergy and exergo-economic analysis. Energy Conversion and Management, 199(November), 111883. doi: 10.1016/J.ENCONMAN.2019.111883
- Vasudev, V., & Dondapati, R. S. (2017). Experimental and exergy analysis of ammonia/water absorption system using ethylene glycol [C2H4(OH)2] in the evaporator. Energy Procedia, 109(March), 401–408. doi: 10.1016/J.EGYPRO.2017.03.039
- Wang, X., Xu, X., & Choi, S. U. S. (1999). Thermal conductivity of nanoparticle – fluid mixture. Journal of Thermophysics and Heat Transfer, 13(4), 474–480. doi: 10.2514/2.6486
- Warrier, P., & Teja, A. (2011). Effect of particle size on the thermal conductivity of nanofluids containing metallic nanoparticles. Nanoscale Research Letters, 6(1), 247. doi: 10.1186/1556-276X-6-247
- Xie, H., Yu, W., & Chen, W. (2010). Mgo nanofluids: Higher thermal conductivity and lower viscosity among ethylene glycol-based nanofluids containing oxide nanoparticles. Journal of Experimental Nanoscience, 5(5), 463–472. doi: 10.1080/17458081003628949
- Xu, Q.-S., Daszykowski, M., Walczak, B., Daeyaert, F., de Jonge, M. R., Heeres, J., … Massarta, D. L. (2004). Multivariate adaptive regression splines – studies of HIV reverse transcriptase inhibitors. Chemometrics and Intelligent Laboratory Systems, 72(1), 27–34. doi: 10.1016/J.CHEMOLAB.2004.02.007
- Zamzamian, A., Oskouie, S. N., Doosthoseini, A., Joneidi, A., & Pazouki, M. (2011). Experimental investigation of forced convective heat transfer coefficient in nanofluids of Al2O3/EG and CuO/EG in a double pipe and plate heat exchangers under turbulent flow. Experimental Thermal and Fluid Science, 35(3), 495–502. doi: 10.1016/j.expthermflusci.2010.11.013
- Zoqi, M. J., Ghamgosar, M., Ganji, M., & Fallahi, S. (2016). Application of GMDH and genetic algorithm in fraction in biogas from landfill modeling. Journal of Environmental Science and Technology, 18(3), 1–12.
- Żyła, G. (2017). Viscosity and thermal conductivity of MgO–EG nanofluids. Journal of Thermal Analysis and Calorimetry, 129(1), 171–180. doi: 10.1007/s10973-017-6130-x
Appendix 1
where the coefficients are determined as: