
 ?Mathematical formulae have been encoded as MathML and are displayed in this HTML version using MathJax in order to improve their display. Uncheck the box to turn MathJax off. This feature requires Javascript. Click on a formula to zoom.
Abstract
Hydrological droughts are characterized based on their duration, severity, and magnitude. Among the most critical factors, precipitation, evapotranspiration, and runoff are essential in modeling the droughts. In this study, three indices of drought, i.e., Standardized Precipitation Index (SPI), Standardized Streamflow Index (SSI), and Standardized Precipitation Evapotranspiration Index (SPEI), are modeled using Support Vector Regression (SVR), Gene Expression Programming (GEP), and M5 model trees (MT). The results indicate that SPI delivered higher accuracy. Moreover, MT model performed better in predicting SSI by a CC of 0.8195 and a RMSE of 0.8186.
Abbreviations: ANFIS: adaptive neuro-fuzzy inference system; ANN: artificial neural network; ANN: artificial neural network; BS-SVR: boosted-support Vector Regression; CC: correlation coefficient; ELM: extreme learning machine; GEP: gene Expression Programming; GP: genetic Programming; GPR: Gaussian process regression; KNN: k-nearest neighbor; LSSVM: least squares Support Vector Machine; LSSVR: least support vector regression; MAE: mean absolute error; MARS: multivariate adaptive regression splines; MLP: multilayer perceptron; MLR: multiple linear regression; MT: M5 model tree; P: precipitation; PDSI: palmer drought severity index; PET: potential evapotranspiration; RAE: relative absolute error; RMSE: root mean square error; RVM: relevance vector machine; SAR: sodium absorption index; SDR: standard deviation reduction; SPEI: standardized precipitation evapotranspiration index; SPI: standardized precipitation index; SSI: standardized streamflow index; SVM: support vector machine; SVR: support vector regression; WAANN: Wavelet-ARIMA-ANN; WANFIS: Wavelet-Adaptive Neuro-Fuzzy Inference System; WN: wavelet network
Nomenclature
| ET0 | = | reference evapotranspiration (mm day−1) |
| Δ | = | slope of the saturation vapor pressure function (kPa°C−1) |
| γ | = | psychometric constant (kPa°C−1) |
| Rn | = | net radiation (MJ m−2 d−1) |
| G | = | Soil heat flux density (MJ m−2 d−1) |
| T | = | mean air temperature (°C) |
| U2 | = | average 24 h wind speed at 2 m height above ground level (m s−1) |
| es | = | saturation vapor pressure (kPa) |
| ea | = | actual vapor pressure (kPa) |
| λ | = | latent heat of evaporation (MJ Kg−1) |
| P | = | precipitation (mm) |
| PET0i | = | evapotranspiration |
| Di | = | difference between Precipitation (P) and evapotranspiration ( |
| L(y,f(x,a)) | = | ϵ-insensitive error function |
| SDR | = | standard deviation reduction |
| sd | = | standard deviation |
| Ti | = | subset of samples that have the nth result of the potential test |
| xi | = | predicted values of SSI |
| yi | = | observed values of SSI |
| n | = | number of observations |
Introduction
Drought is a periodic atmospheric event associated with a lack of sufficient available water resources in a geographical area with a significant duration of time. This environmental event is considered as an inseparable part of climatic changes and a recurring event in different climatic regions all over the world (Wilhite, Citation2000). Drought can affect natural habitats and ecosystems, as well as many economic and social sectors (Heim, Citation2002). Recently, in diverse parts of the world, drought frequently occurred, and its effects have been more harmful owing to increased water demand and climatic changes. Therefore, the phenomenon of drought has attracted the attention of many researchers, and studying the characteristics of this phenomenon from different angles has been the subject of high priority for researchers (Mishra & Singh, Citation2011). Moreover, among accidental and probable aspects, precipitation plays a vital role in arid and semi-arid regions. The drought happening in most parts of the world depends mostly on precipitation. So, lack of precipitation and increased temperature profoundly affect the scarcity of surface runoff. Furthermore, the lack of precipitation leads to a shortage of surface and groundwater resources.
Drought indices are an important part of the drought monitoring system. Researchers have developed different indices for monitoring drought conditions as well as studying its quantitative effects. Most drought indices have been developed for special geographical regions and special purposes, and as a result, their implementation to have an accurate and comprehensive analysis in other regions has been associated with considerable doubts due to the intrinsic complexities of the phenomenon of drought and different climatic conditions. Predicting drought can provide useful information which helps to reduce consequences resulting from drought. The Standardized Streamflow Index (SSI) with the merit of easiness and effectiveness is regarded as the most frequently employed method for quantifying the streamflow-based hydrological droughts. In other words, SSI allows precise comparisons of the hydrological conditions of a stream. Machine learning as a data-driven method is the most suitable alternative for predicting this phenomenon, for it requires the least information. Through employing M5 model tree and an efficient artificial neural network (ANN)-based model, Bhattacharya and Solomatine (Citation2005) predicted the stage-discharge rating curve in the Bhagirathi River in India. A comparison of conventional statistical models of the stage-discharge with artificial neural network method and M5 model tree indicated that the artificial neural network and M5 model tree were capable of predicting the stage-discharge rating curve. In an attempt to predict daily and monthly values of precipitation in Japan, Sumi, Zaman, and Hirose (Citation2012) implemented an ANN, multivariate adaptive regression splines (MARS), k-nearest neighbor (KNN), and Support Vector Regression (SVR). For modeling the monthly and daily rainfall, methods mentioned above, combined with moving average and principal component analysis as a pre-processing technique utilized (Choubin, Malekian, & Golshan, Citation2016; Faroughi et al., Citation2020; Hemmati-Sarapardeh et al., Citation2020; Shabani et al., Citation2020). The results showed that regarding daily precipitation forecasting, the hybrid methods provided better performances than standalone models. Additionally, regarding the values of monthly precipitation forecasting, the SVR method provided more accurate predictions than the hybrid method. Using the two methods of SVR and wavelet networks (WN), Adamowski and Prasher (Citation2012) predicted the daily runoff values in the mountainous Sianji drainage basin located in the Himalayan region of India. A comparison of the results showed that both methods had suitable accuracy for daily flow; however, the precision of wavelet networks was slightly higher. Choubin et al. (Citation2016) utilized adaptive neuro-fuzzy inference system (ANFIS), the M5P model tree and the multilayer perceptron (MLP) for predicting SPI 1–12 months in advance. The obtained findings confirmed that performance of the MLP is more superior to other implemented models. Deo, Kisi, and Singh (Citation2017) predicted the values of SPI in eastern Australia by using the drought models of least squares Support Vector Machine (LSSVM), M5 model tree and, MARS. Their findings showed the importance of predicting periodic drought as well as precise determination of model accuracy scales with geographic-seasonal factors. Oloruntade, Mohammad, Ghazali, and Wayayok (Citation2020) analyzed the SPI and SPEI meteorological drought indices and SRI hydrological drought index to study drought occurrence in the southern region of the Niger basin during the statistical period of 1970–2008. The obtained results indicated that hydrological drought is more affected by temperature (heating) than precipitation (drying) in the basin. Tirivarombo, Osupile, and Eliasson (Citation2018) carried out a study, comparing drought indices of SPI and SPEI in the Kafue River basin located in northern Zambia. Their study showed that change in temperature plays an important role in determining drought phenomena. In other studies, Adarsh and Janga Reddy, (Citation2019) analyzed drought occurrence using 3-month Standard Precipitation Index (SPI-3). The analysis of SPI-3 series using the Mann-Kendall method for the period of 1871–2012 showed a significant increasing trend in the regions of Kerala and Telangana and a decreasing trend in the regions of Ariasa. The results obtained from hybrid models compared with conventional prediction models based on various statistical criteria revealed the superiority of hybrid methods for predicting SPI3 in the mentioned regions. In a study by Sattari, Farkhondeh, and Abraham (Citation2018), the value of sodium absorption index (SAR) estimated with Support Vector Machine (SVM), M5 model tree, ANN, and gaussian process regression (GPR). Furthermore, after investigating several hydrocarbon parameters, they selected the most effective parameters. In their study, a combination of Sodium electrical conductivity and EC considered as input parameters, and the results showed that the M5 model had a better performance among data mining methods. This study indicated that the M5 model could be successfully used to estimate SAR values. They also showed that simple and optimized linear equations through the M5 model tree resulted in reduced time and expense. Sachindra, Ahmed, Rashid, Shahid, and Perera (Citation2018) developed statistical models for downscaling of monthly precipitation. In this study, by the usage of the four techniques of ANNs, Genetic Programming (GP), Relevance Vector Machine (RVM) and SVM, they calibrated downscaling models over the period 1950–1991 and accredited over the period 1992–2014 for every station. Based on their results, the use of RVM and ANN was recommended for downscaling and predicting flood, which involved considering high extremes of precipitation. Also, they identified that regardless of the climate regime, that model displayed a precise and acceptable performance with the Polynomial kernel. Yin et al. (Citation2018) conducted a study to predict river flow data in semi-arid areas. For this purpose, they used three models of MARS, SVR, and M5 model. Based on the results, the performance of the M5 model was better than the SVR and MARS models. Furthermore, it showed that the M5 model could be successfully implemented for predicting short-term river flows in semi-arid mountainous areas. Soh, Koo, Huang, and Fung (Citation2018) proposed Wavelet-ARIMA-ANN (WAANN) and the latest Wavelet-Adaptive Neuro-Fuzzy Inference System (WANFIS) models for predicting SPEI at the Langat River Basin. It was found that the WAANN model gives improved precision for both, the short-term and mid-term drought forecasting. Mouatadid, Raj, Deo, and Adamowski (Citation2018) implemented extreme learning machine (ELM) model for predicting SPEI in a region in eastern Australia and compared its enactment to that of a multiple linear regression (MLR), an artificial neural network (ANN), and a least support vector regression (LSSVR) models. The superior agreement between observed and predicted SPEI indicated the potential of the developed models for contributing more in understanding the potential future of drought-risks in eastern Australia. Fung, Huang, and Koo (Citation2018) studied the improvement of SVR-based drought forecasting models using wavelet preprocessing techniques in the Langat River basin. Prediction of the SPEIs of hybrid wavelet models compared with SVR and the Boosted-support Vector Regression (BS-SVR) models showed that hybrid wavelet BS-SVR model provided more accuracy for the prediction of drought in the Langat River basin. For modeling the evapotranspiration process, Parasuraman, Elshorbagy, and Carey (Citation2007) utilized GP technique and compare this model with the traditional Penman-Monteith (PM) as well as ANN method. The findings of their study indicated that both GP and ANN models performed better than the PM methods. Sahoo, Jha, Singh, and Kumar (Citation2019) studied the suitability of SVR for modeling monthly low-flow time series at three stations of India. In this study, the SVR model utilized as an accurate model for low-flow prediction.
North of Iran usually receives high amount of rainfall and water resources. However, mild and somehow severe droughts hits this mentioned area more regularly in recent years, which caused financial damages to its residents. Also, SSI was widely used in Europe and eastern parts of Asia, but there is not any reported in Iran. So, for investigating the possibility of predicting SSI in north of Iran, Navrood basin in the west of Gilan province was selected as the study area. Thus, the purpose of the present study is to predict an index of the hydrological drought of SSI for the Navrood drainage basin using SPI and SPEI through the implementation of data-driven models of SVR, GEP, and M5. Although hybrid artificial intelligent models are effective in hydrological modeling, these simple data driven models were selected based on their easy applications in predictive modeling and high capabilities for using in decision making processes. Besides, the most accurate model to predict the index of hydrological drought in the region under study was identified and presented among the models mentioned above. Finally, the finding results of the current paper could provide valuable information for developing the drought monitoring and forecasting systems of North of Iran and also the whole country.
Materials and method
Study area
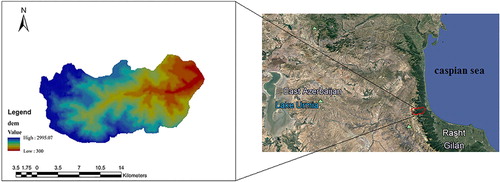
Navrood basin with a humid climate is a vital drainage basin in the west of Gilan province located within the city of Talesh between 48°35′ to 48°54′ east longitude and 37°36′ to 37°45′ north latitude. The longest tributary of Navrood River originates from eastern slopes of the Alborz mountain range, which is a part of the Talesh Mountains, and after other sub-tributaries join, it follows the course from the west to the east, going through the city of Asalem, and finally flowing down the Caspian Sea. The area of Navrood Basin is 274 square kilometers. The average height of the basin is 1573 m, and the average annual rainfall of the pool is 852.7. The yearly average temperature, the average relative humidity, the average wind speed, and the yearly average evaporation are 13.5°C, 73.36%, 3.32 km/h, and 750 mm, respectively. The maximum precipitation of this basin occurs in fall, spring, summer, and winter, respectively. Also, the climate of the region is humid in the plain and cold in the highlands. The drainage basin is considered a part of the forest basins with steep slopes, in which more than 50% of the basin area has a slope ranging between 30% and 60%, with an average basin slope of 31.16%. Figure shows the geographical location of the Navrood drainage basin.
Figure 1. The geographical location of Navrood drainage basin.
Standardized precipitation index (SPI)
SPI is an indicator that depends on the probability of precipitation for any time and used to calculate different time scales. This method was devised and developed by Mckee, Doesken, and Leist (Citation1993) in an attempt to study various effects of scarcity of precipitation on groundwater, surface water reserves and resources, soil moisture, and waterway flow. The implementation of the SPI indicator is increased globally due to its advantages such as simplicity and small amount of data in the calculation, and being independent of mean precipitation. Moreover, it is used to compare a wide range of climates. The SPI calculation begins by fitting a probability density function. Usually, a two-parameter gamma and sometimes a Log Pearson type III, to the total precipitation over periods of 3–24 months.
Standardized precipitation evapotranspiration index (SPEI)
Penman-Monteith method (PM) was recommended as the standard method to calculate the reference crop evapotranspiration (Allen, Pereira, Raes, & Smith, Citation1998):
(1)
(1) The SPEI is established by Vicente-Serrano, Beguería, and López-Moreno (Citation2010), and studied in various researches. This method involves climate balance in its calculation, and the role of temperature studied in the evaluation of drought. The SPEI depends on the changes in the difference between precipitation and potential evapotranspiration (P-PET). The Palmer Drought Severity Index (PDSI) (Palmer, Citation1965) had been presented concerning the changes in numerous source and demand variables of the hydrological cycle. Though, PDSI did not consist of multi-scale characteristics and is not a standard index. Different methods recommended for calculating PET. Sheffield, Wood, and Roderick (Citation2012) studied different calculation methods and compared them with each other; it is obvious that the Penman-Monteith method achieved more accurate results, for it is more based on atmospheric evaporation demand (Allen et al., Citation1998). Thus, the calculation of SPEI in this study is based on the Penman-Monteith equation as it is described in FAO56 (Allen et al., Citation1998). PM method selected by the World Meteorological Organization (WMO) as a standard method for the calculation of PET, and its accuracy proved without requiring more data. The monthly values of reference crop evapotranspiration are calculated based on climatic information and using equation 1. In the next step, the difference between Precipitation (P) and evapotranspiration (
) calculated for the ith month:
(2)
(2)
Standardized streamflow index (SSI)
Most researchers applied standardized indices to hydrological droughts similar to indices of meteorological drought. Flow drought indices and standardized runoff indices (Shukla & Wood, Citation2008), which have similar theoretical backgrounds, are two important standardized hydrological drought indices. Thus, calculations of SSI is the same as the process of calculating SPI, the only difference is that instead of precipitation data, surface run-off data are used. Like SPI, this index shows a proper gamma distribution. Therefore, the cumulative flow values are estimated individually for each month; then, the SSI is calculated.
Gene expression programming (GEP)
Gene expression programming (GEP) is an algorithm that utilizes populations of individuals and chooses them based on their fitness, and it can apply genetic changes by the usage of genetic operators (Ferreira, Citation2001a, Citation2001b). The first stage in the GEP algorithm concerns creating a primary population of solutions. Through an accidental process or by the usage of some information about the problem, this stage can be completed. Next, the chromosomes represented as a tree expression, which assessed according to a fitting function. In general, the suitable function is evaluated through processing several target problems, also referred to as fitting problems. If a solution happens to have a satisfactory quality or the generations reach a specific number, the progress stops and, the best solution is reported. If the cases are not found for the best solution, the best one from the current generation is kept, and the rest of the solutions are left for the selection process. According to the selection, the best individuals have more chances of having children. The whole process is repeated for some generations, and as the new generations appear, it is expected that population quality improves on average.
To select the individuals, GEP uses the well-known method of Roulette Wheel. Unlike genetic algorithm and genetic programming, GEP has several genetic operators for reproducing individuals with modifications. Replication involves an operation whose purpose is to preserve some best individuals from the current generation for the next one. The goal of the mutation operator is to introduce random modifications into a specific chromosome. This operator performs some of the flawless operations to prevent creating individuals who are defective regarding the rules. Like a genetic algorithm, GEP uses a one-point and two-point combination. GEP, similar to the genetic algorithm, uses a single-point and two-point combination. The type of two-point combination is somewhat more interesting since it can, to a great extent, turn on and off the regions within the chromosomes that have not been encoded. Furthermore, another type of combination, called gene combination, is also performed at GEP, in which genes are thoroughly combined. This operator randomly selects genes in an identical position on two-parent chromosomes to form two new offspring.
Support vector regression
Support Vector Machine (SVM) is introduced by Boser, Guyon, and Vapnik (Citation1992), who developed optimal hyperplane theory as a linear classifier during the following years. This method is based on statistical learning theory. Furthermore, they introduced nonlinear classifiers through kernel functions. Later, others implemented the results of Boser et al. (Citation1992) studies and developed the fundamental principles of SVM, and finally, Vapnik (Citation1995) developed SVM based on regression. In general, SVM models are classified into (a) classification model of SVM and (b) regression model of SVM. The classification model of SVM is used to classify the problems related to data which are placed in different classes, and regression model of SVM is employed in solving prediction problems. A hyperplane is achieved using regression on fitted data. The distance of a specified point from the hyperplane showed the error of that point. The least-squares method is the best method recommended for linear regression. However, for the regression problems, it is possible that the use of the least-squares estimator in the presence of outliers may not be wholly reasonable, and, as a result, the regression presents a poor performance. Therefore, a robust estimator should be developed to avoid poor performance, which is not sensitive to small changes in the model. As it stated, the SVM is based on minimizing the risk structure derived from the theory of statistical training (Vapnik, Citation1998). Vapnik (Citation1998) used an error function to use SVM in regression problems that ignore errors in a ϵ-insensitive called a specified distance from real values (Basak, Pal, & Patranabis, Citation2007). This function is defined as below.
(3)
(3) This error function does not consider error values below ϵ.
M5 model tree
M5 model tree is developed by Quinlan (Citation1992). This method is a subset of data mining and machine learning methods. Data mining methods discover various and suitable models then, find values from a set of known values. Data mining methods that developed for large datasets with many variables are different from statistical methods; therefore, they were designed for smaller datasets with fewer variables. Decision tree-based methods as one of the most well-known data mining techniques, predict or classify target characteristics as an output in the form of a model with a tree structure using input data. The M5 model tree is a decision tree which can be used to predict continuous numerical attributes, in which linear regression functions are represented in the leaves of this tree (Sattari, Pal, Apaydin, & Ozturk, Citation2013), which has recently triggered significant evolution concerning classification and prediction. The results of the tree model are easy to understand and simulate, and the model output has higher accuracy, and it is compared to other models. Four parts of root, branch, nodes, and leaves are formed a decision tree. Furthermore, the connection between the nodes showed with branches, and the circle represented the nodes. For ease of drawing, the decision tree is usually drawn from left to right or from top to bottom, in a way that the root (first node) is located at the top. The end of a chain is called the leaf. Splitting is performed by one of the predicting variables for minimizing the sum of the squared deviations from the mean data of each node. The first step to develop a tree model is to use a splitting criterion. The splitting criterion for the M5 algorithm is based on the performance of the standard deviation of the values belonging to each class or category, which has been obtained in each node. The splitting criterion indicates the level of error in that node, and calculates the least expected error model as the result of testing each attribute at that node. The model error is generally calculated by measuring the accuracy of predicting the target values of unseen cases. The standard deviation reduction (SDR) defined as
(4)
(4) Where sd is the standard deviation, Ti is a subset of samples that have the nth result of the potential test, and the set of samples entering each node is showed by T.
The splitting process is repeated many times at each node until it reaches the end node (leaf), and in the leaf, the sum of the squared deviations from the mean data is almost zero. A large tree will develop as a result. It will be challenging to work with this big tree as it has many branches and nodes; therefore, to have an optimal and efficient tree, unwanted branches should be pruned out. There are two methods for pruning: (1) Pruning before maximum tree formation (2) Pruning after maximum tree formation. In the first method, the pruning process does not allow the tree to produce extra branches, but in the second method, first, the maximum tree is formed, then the pruning process is performed. The selection of the optimal tree is based on minimizing prediction error (Bhattacharya & Solomatine, Citation2006).
Evaluation parameters
The error values among the predicted and observed data were studied by the root mean square error (RMSE), relative absolute error (RAE), mean absolute error (MAE) and correlation coefficient (CC) as follows (Choubin et al., Citation2020; Hauduc et al., Citation2015):
(5)
(5)
(6)
(6)
(7)
(7)
(8)
(8) where,
,
are the predicted and observed values of SSI, and
is the number of observations. The CC indicates complete correlation between observed and predicted values. Positive values signify direct correlation and negative values reveal an inverse correlation. Moreover, the RMSE and MAE values represent errors and their smaller values indicate lower errors in modeling.
Results and discussion
Prediction of runoff through the precipitation and evapotranspiration parameters is very useful in the management of water resources. The present paper investigates the performance of the three models, including SVM, GEP, and M5 in forecasting Standardized Streamflow Index using SPI and SPEI indices in Navrood station during six-time delays (a one-month to six-month). In this study, of different scales for predicting SSI, a 48-month scale was selected and investigated as it had a higher correlation, and predicted by the introduced models. Table presents statistical parameters of utilized drought indices in the study area and Figure shows SSI, SPI, and SPEI indices on a 48-month scale. Furthermore, the cross-correlation between SPI, SPEI meteorological indices, and SSI were studied simultaneously and with a delay of six months. The results of cross-correlation indicated that meteorological (SPI) and hydrological drought (SSI) in Navrood basin occurs with a 3-and 4-month delay, and the highest similarity about drought prediction has been in 48 months. In addition, the cross-correlation between meteorological (SPEI) and hydrological (SSI) drought in the basin occurs with a 1-and 2-month delay and also the highest similarity about drought prediction has been in 48 months. As can be seen from Figure , the SSI, SPEI, and SPI indices have been inconsistent since 2013–2014; the rainfall did not lead to surface flow, which can be due to changes in the type and amount of precipitation, increased temperature and evapotranspiration. An increase in temperature leads to increased evaporation and dryness of the surface, which in turn, results in increased intensity and duration of drought. Also, it can be concluded that surface flow has occurred with a delay of a few months. Also, since the SPEI index is affected by temperature and needs evapotranspiration calculation, it is more sensitive to climatic conditions than SPI. The Pearson correlation matrix and cross-correlation show that the SPI drought index has worked better than the SPEI drought index in the Navrood drainage basin, since the Navrood basin is wet and has lower evapotranspiration values. However, the SSI hydrological drought index had a faster response to the SPEI drought index (1-, 2-month delay) compared to the SPI index (3-, 4-month delay).
Figure 2 Trend of the SSI, SPI, and SPEI indices on a 48-month scale in the studied period.
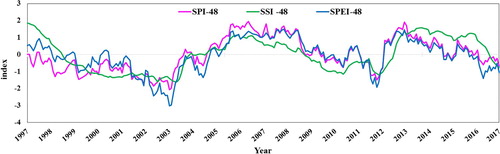
Table 1. Statistical characteristics of the utilized data.
There is no standard method for splitting training and testing data. For instance, the study of Kurup and Dudani (Citation2014) used a total of 63% of their data for model development, whereas Qasem et al. (Citation2019) utilized 67% of data and Samadianfard, Ghorbani, and Mohammadi (Citation2018), Deo et al. (Citation2018) and Samadianfard, Jarhan, et al. (Citation2019; Samadianfard, Majnooni-Heris, et al., Citation2019) used 70% and Zounemat-Kermani et al. (Citation2019) implemented 80% of total data to develop their models. So, in this study, approximately 70% of the data were used for training, and the remaining %30 were utilized for testing. Then, to compare the utilized methods, the corresponding statistical parameters were determined and shown in Tables and .
Table 2. Assessment criteria for predicting SSI using SPEI.
Table 3. Assessment criteria for predicting SSI using SPI.
In the case of using the SPEI index, GEP-4 has a better performance among GEP models as its CC, MAE, RMSE, and RAE were 0.650, 0.849, 0.961, and 1.08, respectively. Moreover, GEP-3 ranking second, had an acceptable performance with slightly higher error, whose CC, MAE, RMSE, and RAE were 0.642, 0.830, 0.967, and 1.056, respectively. Among tree models, M5-3 had the best performance, whose CC, MAE, RMSE and RAE were 0.659, 0.830, 0.964, and 0.780, respectively. Concerning the SVR method, SVR-1 had the best performance compared to other time delays, in which CC, MAE, RMSE, and RAE were 0.663, 0.879, 1.017, and 0.835, respectively. Also, overall results indicated that SVR-6, M5-6, and GEP-6 had the worst performance whose CC, MAE, RMSE, and RAE were 0.804, 0.924, 1.088, 0.844 and 0.520, 0.897, 1.057, 0.821 and 0.540, 0.903, 1.053, 1.159, separately. Therefore, they are not recommended for SSI prediction.
Additionally, in the case of using SPEI index, among GEP models, GEP-1 had an acceptable performance in which CC, MAE, RMSE and RAE were 0.644, 0.711, 0.837 and 0.904, respectively. Likewise, GEP-2 had also an acceptable performance in which CC, MAE, RMSE and RAE were 0.691, 0.718, 0.857, and 0.913, respectively. Furthermore, M5-5 and M5-4 had the best performance in tree model whose CC, MAE, RMSE and RAE were 0.819, 0.691, 0.819, 0.635; and 0.790, 0.703, 0.819, 0.658, respectively. Regarding SVR models, SVR-4 and SVR-3 had suitable performance CC, MAE, RMSE and RAE were 0.774, 0.720, 0.852, 0.673 and 0.768, 0.720, 0.852, 0.677, respectively.
After comparing statistical parameters obtained from the presented results, it can be concluded that SPI has performed better in predicting SSI. Also, based on Pearson correlation and cross-correlation, it was identified that although SPEI is more sensitive to climatic conditions, the drought index of SPI was better, and hydrological drought index predicted SSI with a lower error. Figures and show the scatter plots of predicted and observed values of SSI.
Figure 3. scatter plots of predicted and observed SSI by SPEI values using the best models.
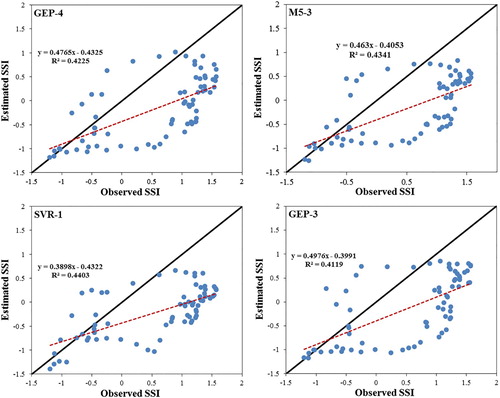
Figure 4. scatter plots of predicted and observed SSI by SPI values using the best models.
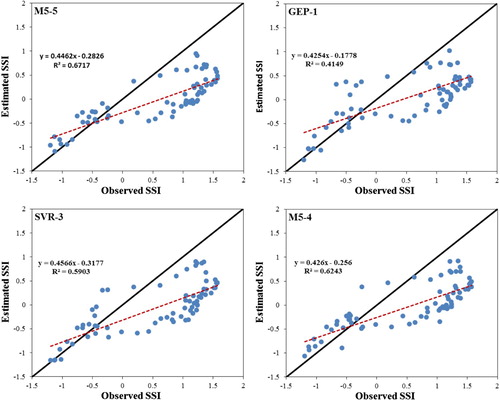
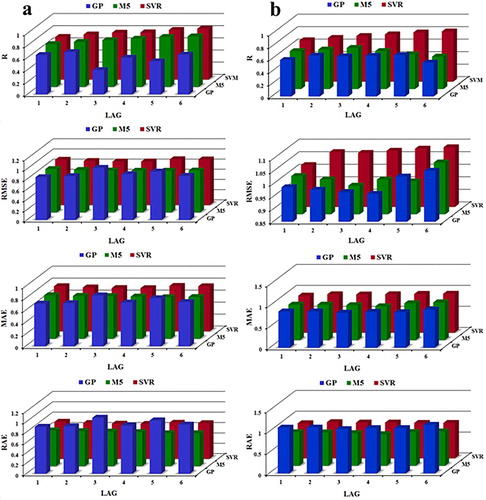
The approach as mentioned above, concerning increased accuracy of the superior models can be concluded for all three methods studied in Figures and . It is concluded that using SPEI, the predictions of GEP-3, GEP-4, M5-3, and SVR-1 were more consistent with the observed SSI values and the distribution of points drawn around the axis of the bisector is low. In addition, predictions of GEP-1, M5-4, and M5-5 and SVR-3 were more accurate using SPI data. In other words, SSI value can be predicted with acceptable accuracy in Navrood station using the above-mentioned models. Figure shows the assessment criteria of all three methods used in six-time delays through the use of SPEI and SPI data. As it can be seen from Figure , GEP-4 and M5-4 by lower RMSE values than other studied models, proved themselves as powerful models for predicting SSI index using SPEI and SPI values, respectively. In other words, SSI values may be predicted accurately using GEP-4 and M5-4 models.
Figure 5. Assessment criteria of all considered models using (a) SPEI and (b) SPI data.
Conclusion
Drought has adverse effects on different communities, and it occurs in various climates. Therefore, considering the importance of studying drought and the critical role that drought indices have in forecasting this phenomenon, this study investigated predicting SSI hydrological drought index through meteorological indices of SPI and SPEI using the three models of support vector regression, gene expression programming, and tree model. In general, the results of the study indicated that SPI meteorological index had predicted SSI more accurately. Also, SPEI and SPI had the best prediction for SSI using GEP and M5 models, respectively. In other words, SSI values in Navrood can be predicted with the least error and an acceptable accuracy through gene expression programming and tree models by using SPEI and SPI data. Due to the fact that only current and past monthly lagged values of SPI and SPEI were utilized as inputs of machine learning models, they had limited capability for predicting SSI index in different climatic conditions. Further studies can examine the implementation of other drought indices and their influence on the precision of machine learning models.
Disclosure statement
No potential conflict of interest was reported by the authors.
Related Research Data
References
- Adamowski, J., & Prasher, S. O. (2012). Comparison of machine learning methods for runoff forecasting in mountainous watersheds with limited data. Journal of Water and Land Development, 17(1), 89–97.
- Adarsh, S., & Janga Reddy, M. (2019). Evaluation of trends and predictability of short-term droughts in three meteorological subdivisions of India using multivariate EMD-based hybrid modelling. Hydrological Processes, 33(1), 130–143.
- Allen, R. G., Pereira, L. S., Raes, D., & Smith, M. (1998). Crop evapotranspiration- Guidelines for computing crop water requirements-FAO Irrigation and drainage paper 56. FAO, Rome. 300(9).
- Basak, D., Pal, S., & Patranabis, D. C. (2007). Support vector regression. Neural Information Processing, 11, 203–225.
- Bhattacharya, B., & Solomatine, D. P. (2005). Neural networks and M5 model trees in modeling water level-discharge relationship for an Indian river. Neurocomputing, 63, 381–396.
- Bhattacharya, B., & Solomatine, D. P. (2006). Machine learning in sedimentation modeling. Neural Networks, 19(2), 208–214.
- Boser, B. E., Guyon, I. M., & Vapnik, V. N. (1992). A training algorithm for optimal margin classiers. In D. Haussler (Ed.), 5th annual ACM Workshop on COLT (pp. 144–152). Pittsburgh, PA: Wiley.
- Choubin, B., Abdolshahnejad, M., Moradi, E., Querol, X., Mosavi, A., Shamshirband, S., & Ghamisi, P. (2020). Spatial hazard assessment of the PM10 using machine learning models in Barcelona, Spain. Science of The Total Environment, 701, 134474.
- Choubin, B., Malekian, A., & Golshan, M. (2016). Application of several data-driven techniques to predict a standardized precipitation index. Atmósfera, 29(2), 121–128.
- Deo, R. C., Ghorbani, M. A., Samadianfard, S., Maraseni, T., Bilgili, M., & Biazar, M. (2018). Multi-layer perceptron hybrid model integrated with the firefly optimizer algorithm for windspeed prediction of target site using a limited set of neighboring reference station data. Renewable Energy, 116, 309–323.
- Deo, R. C., Kisi, O., & Singh, V. P. (2017). Drought forecasting in eastern Australia using multivariate adaptive regression spline, least square support vector machine and M5Tree model. Atmospheric Research, 184, 149–175.
- Faroughi, M., Karimimoshaver, M., Aram, F., Solgi, E., Mosavi, A., Nabipour, N., & Chau, K. W. (2020). Computational modeling of land surface temperature using remote sensing data to investigate the spatial arrangement of buildings and energy consumption relationship. Engineering Applications of Computational Fluid Mechanics, 14(1), 254–270.
- Ferreira, C. (2001a). Gene expression programming in problem solving. 6th Online World Conf. on Soft Computing in Industrial Applications (invited Tutorial).
- Ferreira, C. (2001b). Gene expression programming, A new adaptive algorithm for solving problems. Complex Systems, 13(2), 87.
- Fung, K. F., Huang, Y. F., & Koo, C. H. (2018). Improvement of SVR-Based Drought Forecasting Models using Wavelet Pre-Processing Technique. In E3S Web of Conferences (Vol. 65, p. 07007). EDP Sciences.
- Hauduc, H., Neumann, M. B., Muschalla, D., Gamerith, V., Gillot, S., & Vanrolleghem, P. A. (2015). Efficiency criteria for environmental model quality assessment: A review and its application to wastewater treatment. Environmental Modelling & Software, 68, 196–204.
- Heim Jr., R. R. (2002). A review of twentieth-century drought indices used in the United States. Bulletin of the American Meteorological Society, 83(8), 1149–1166.
- Hemmati-Sarapardeh, A., Hajirezaie, S., Soltanian, M. R., Mosavi, A., Nabipour, N., Shamshirband, S., & Chau, K. W. (2020). Modeling natural gas compressibility factor using a hybrid group method of data handling. Engineering Applications of Computational Fluid Mechanics, 14(1), 27–37.
- Kurup, P. U., & Dudani, N. K. (2014). Neural networks for profiling stress history of clays from PCPT data. Journal of Geotechnical and Geoenvironmental Engineering, 128, 569–579.
- Mckee, T. B., Doesken, N. J., & Leist, J. (1993). The relationship of drought frequency and duration to time scales. Preprints 8th Conference on Applied Climatology, 17, 179–184.
- Mishra, A. K., & Singh, V. P. (2011). Drought modeling - a review. Journal of Hydrology, 403(1-2), 157–175.
- Mouatadid, S., Raj, N., Deo, R. C., & Adamowski, F. (2018). Input selection and data-driven model performance optimization to predict the standardized precipitation and evaporation index in a drought-prone region. Atmospheric Research, 212, 130–149.
- Nabipour, N. (2020). Short-Term Hydrological Drought Forecasting Based on Different Nature-Inspired Optimization Algorithms Hybridized with Artificial Neural Networks. IEEE Access, 155, 225–233. doi:10.1109/ACCESS.2020.2964584.
- Palmer, W. C. (1965). Meteorological drought. US Department of Commerce. Washington, DC, USA: Weather Bureau.
- Parasuraman, K., Elshorbagy, A., & Carey, S. K. (2007). Modelling the dynamics of the evapotranspiration process using genetic programming. Hydrological Sciences Journal, 52(3), 563–578.
- Qasem, S. N., Samadianfard, S., Kheshtgar, S., Jarhan, S., Kisi, O., Shamshirband, S., & Chau, K. W. (2019). Modeling monthly pan evaporation using wavelet support vector regression and wavelet artificial neural networks in arid and humid climates. Engineering Applications of Computational Fluid Mechanics, 13(1), 177–187.
- Quinlan, J. R. (1992). Learning with continuous classes. In Proc. AI’92 (Fifth Australian Joint Conference on Artificial Intelligence (pp. 343–348). Singapore: World Scientific.
- Sachindra, D. A., Ahmed, K., Rashid, M. M., Shahid, S., & Perera, B. J. C. (2018). Statistical downscaling of precipitation using machine learning techniques. Atmospheric Research, 212, 240–258.
- Sahoo, B. B., Jha, R., Singh, A., & Kumar, D. (2019). Application of Support Vector Regression for modeling low flow time series. KSCE Journal of Civil Engineering, 14, 1–12.
- Samadianfard, S., Ghorbani, M. A., & Mohammadi, B. (2018). Forecasting soil temperature at multiple-depth with a hybrid artificial neural network model coupled hybrid firefly optimizer algorithm. Information Processing in Agriculture, 5, 465–476.
- Samadianfard, S., Jarhan, S., Salwana, E., Mosavi, A., Shamshirband, S., & Akib, S. (2019). Support vector regression integrated with fruit fly optimization algorithm for river flow forecasting in Lake Urmia Basin. Water, 11, 1934.
- Samadianfard, S., Majnooni-Heris, A., Qasem, S. N., Kisi, O., Shamshirband, S., & Chau, K. W. (2019). Daily global solar radiation modeling using data-driven techniques and empirical equations in a semi-arid climate. Engineering Applications of Computational Fluid Mechanics, 13(1), 142–157.
- Sattari, M. T., Farkhondeh, A., & Abraham, J. P. (2018). Estimation of sodium adsorption ratio indicator using data mining methods: A case study in Urmia Lake basin, Iran. Environmental Science and Pollution Research, 25(5), 4776–4786.
- Sattari, M. T., Pal, M., Apaydin, H., & Ozturk, F. (2013). M5 model tree application in daily river flow forecasting in Sohu Stream, Turkey. Water Resources, 40(3), 233–242.
- Shabani, S., Samadianfard, S., Sattari, M. T., Mosavi, A., Shamshirband, S., Kmet, T., & Várkonyi-Kóczy, A. R. (2020). Modeling pan evaporation using Gaussian process regression K-nearest neighbors random forest and Support Vector machines; comparative analysis. Atmosphere, 11(1), 66.
- Sheffield, J., Wood, E. F., & Roderick, M. L. (2012). Little change in global drought over the past 60 years. Nature, 491(7424), 435–438.
- Shukla, S. H., & Wood, A. W. (2008). Use of a standardized runoff index for characterizing hydrologic drought. Geophysical Research Letters, 35(2), 41–46.
- Soh, Y. W., Koo, C. H., Huang, Y. F., & Fung, K. F. (2018). Application of artificial intelligence models for the prediction of standardized precipitation evapotranspiration index (SPEI) at Langat River Basin, Malaysia. Computers and Electronics in Agriculture, 144, 164–173.
- Sumi, S. M., Zaman, M., & Hirose, H. (2012). A rainfall forecasting method using machine learning models and its application to the Fukuoka city case. International Journal of Applied Mathematics and Computer Science, 22(4), 841–854.
- Tirivarombo, S., Osupile, D., & Eliasson, P. (2018). Drought monitoring and analysis: Standardised precipitation evapotranspiration index (SPEI) and standardised precipitation index (SPI). Physics and chemistry of the Earth. Parts A/B/C, 106, 1–10.
- Vapnik, V. (1995). The nature of statistical learning theory. New York: Springer.
- Vapnik, V. N. (1998). Statistical learning theory. New York: Wiley.
- Vicente-Serrano, S. M., Beguería, S., & López-Moreno, J. I. (2010). A multiscalar drought index sensitive to global warming: The standardized precipitation evapotranspiration index. Journal of Climate, 23(7), 1696–1718.
- Wilhite, D. A. (2000). Drought: A global assessment. Volume I. London and New York: Rutledge Press.
- Yin, Z., Feng, Q., Wen, X., Deo, R. C., Yang, L., Si, J., & He, Z. (2018). Design and evaluation of SVR, MARS and M5Tree models for 1, 2 and 3-day lead time forecasting of river flow data in a semiarid mountainous catchment. Stochastic Environmental Research and Risk Assessment, 32(9), 2457–2476.
- Zounemat-Kermani, M., Seo, Y., Kim, S., Ghorbani, M. A., Samadianfard, S., Naghshara, S., … Singh, V. P. (2019). Can decomposition approaches always enhance soft computing models? Predicting the dissolved oxygen concentration in the St. Johns River, Florida. Applied Science, 9, 2534.