
 ?Mathematical formulae have been encoded as MathML and are displayed in this HTML version using MathJax in order to improve their display. Uncheck the box to turn MathJax off. This feature requires Javascript. Click on a formula to zoom.
Abstract
Owing to the oversimplification of the evaporation model, existing numerical analysis cannot accurately characterize the evaporation characteristics, which has limited its significance for engineering. Therefore, by user-defined programming, a droplet evaporation model in line with the properties of desulfurization wastewater was implemented in numerical simulation. The effects of guiding measures, nozzle arrangement, nozzle layer, flue gas temperature, moisture and droplet diameter on the droplet evaporation in a bypass flue were explored. The numerical results show that the fluctuation of evaporativity due to moisture can be neglected. The uniformity of the flow field with guiding measures is good and the phenomenon of droplets impinging on the wall surface can be prevented. The droplet collision probability without guiding measures may be nearly 60 times higher than that with guiding measures. A reasonable nozzle arrangement increases the droplet evaporation rate and reduces the probability of droplets colliding with the wall surface. An increased number of nozzle layers enhances the droplet evaporation rate and the average temperature in the flue; by estimation, the average temperature in the flue with three nozzle layers is 10.7 K higher than that for two nozzle layers, and 15.8 K higher than that for one nozzle layer. In the condition of higher temperature and smaller diameter, droplets evaporate more rapidly. These research results can provide a reliable reference for engineering practice.
1. Introduction
Sulfur dioxide (SO2) has a prominent impact on air quality, which is closely related to human health. At present, the SO2 emissions from coal-fired power plants, which are a traditional energy source still used to support the economic needs in many countries, have become a serious problem which must be considered and solved by the government of each country (Akiko, Yoshiki, & Kazuaki, Citation2015; Alessandra et al., Citation2019; Kim et al., Citation2018; Lin et al., Citation2018). Under these circumstances, the emission standards for SO2 have been continuously improved worldwide. In a coal-fired power plant, desulfurization can be carried out before, during and after combustion. The desulfurization before and during combustion is restricted by the coal property, cost of additives, maturity of the technology and desulfurization efficiency, which makes it of limited commercial use. Post-combustion desulfurization, known as flue gas desulfurization (FGD), is widely used in practical industrial production (Lu et al., Citation1998). There are different contact modes between the flue gas and desulfurizer in FGD, which can be divided into wet, semi-dry and dry FGD. Wet FGD, classified as a gas–liquid reaction, has characteristics of a rapid reaction rate, high efficiency and high utilization rate of additives (Lisnic & Jinga, Citation2018), and thus has received extensive attention.
During the process of wet FGD, a certain amount of wastewater containing impurities such as suspended solids, supersaturated sulfite, sulfate and heavy metals needs to be discharged to maintain the material balance of the system and to obtain good-quality gypsum. Before discharge, wastewater should be pretreated to make it environmentally acceptable (Blazquez, Baeza, Gabriel, & Guisasola, Citation2019; Gingerich, Eric, & Mauter, Citation2018). Traditional desulfurization wastewater treatments, such as the bushing of triple box which includes neutralization, flocculation and sedimentation, have disadvantages including a high equipment failure rate, poor operational stability and high operational cost; therefore, advanced treatment methods including membrane permeation (Jia & Wang, Citation2018; Lee, Kim, & Hong, Citation2018), adsorption (Song et al., Citation2011) and spray evaporation technology (SET) (Ma, Chai, Chen, Yu, & Zhu, Citation2016; Wang, Citation2016) have emerged and are attracting increased attention. For SET, the desulfurization wastewater is injected into the flue in front of the electrostatic precipitator (ESP), the water is evaporated and the residue after evaporation is trapped by the ESP. In this way, the liquid phase of the desulfurization wastewater is eliminated. SET has several merits, including being a simple process and requiring low investment and space, and is therefore widely applied.
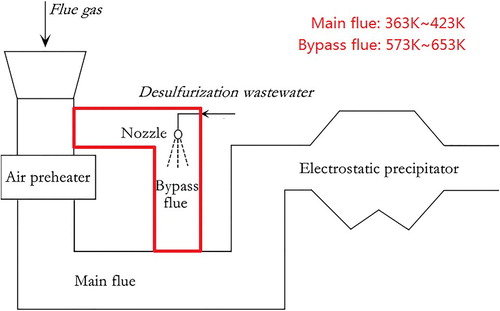
SET can normally be implemented in either main or bypass flues. The main flue is the flue after the air preheater and before the dust collector, while the bypass flue is the branch flue from the upstream of the air preheater, as shown in Figure . When the wastewater is directly sprayed into the main flue, problems such as ash, scaling and corrosion in the main flue occur. As new energy technologies, such as wind, solar and other green energy sources, emerge and evolve, the load of the thermal power plant decreases, and the flue gas temperature in the main flue drops to 393 K owing to the load decline. Meanwhile, the reduction in the effective length for evaporation in the main flue due to the popularization of low–low-temperature technology restricts the bearable wastewater load for the main flue. However, the ESP in the bypass flue has the merits of high temperature, adjustable flue gas volume, convenient maintenance and little impact on the system. It can (1) realize zero discharge of desulfurization wastewater; (2) meet the requirements of high evaporation efficiency of wastewater under different loads; and (3) improve the stability of operation and maintenance of power plants. Against this background, more attention is being paid to this technology (Zhang et al., Citation2017).
Figure 1. Evaporation process of the bypass flue.
Experimental studies have been conducted on the evaporation characteristics of droplets. Liang et al. (Citation2017) experimentally studied the evaporation crystallization process of wastewater and found that the temperature improvement accelerates the above-mentioned processes. Ma et al. (Citation2018) built an experimental system to explore hydrochloric acid (HCl) volatilization in the wastewater evaporation process and found that the pH value played a dominant role in HCl volatilization. Li et al. (Citation2016) obtained the probability of droplets colliding with the walls by conducting experiments, and found that under the condition of a 65° atomization cone angle, the vortex size is inversely proportional to the distance between the sprayer and the flue wall.
It is known that the spray evaporation in the bypass flue runs at high temperature, and the time required for complete evaporation of droplets is very short. Therefore, it is difficult to obtain key information about the evaporation characteristics of droplets simply from physical experiments. Numerical simulation can overcome this limitation and provide more information, which is hard gain from experiments (Langrish, Citation2007). In this regard, Deng et al. (Citation2014) found that by lengthening the flue, reducing the droplet size and increasing the flue gas temperature, the evaporativity can be improved. Their numerical results also proved that the desulfurization wastewater evaporation treatment system does not have any negative impacts on the downstream devices such as the ESP and flue gas heat exchanger. Their study focused on the feasibility of the technology and also addressed the safety of downstream equipment. Feng et al. (Citation2019) revealed the spray evaporation mechanism of desulfurization wastewater in the flue gas by combining Eulerian and Lagrangian methods. The effects of droplet diameter, flue gas velocity, full cone angle and nozzle spray direction on the evaporation rate were also analyzed. They predicted the droplet evaporation rate by the least-square support vector machine model. However, the use of a pure water model greatly reduces the prediction accuracy according to the data source imported into the model.
As seen from previous studies, the evaporation model for pure water is mostly used in the numerical simulation of desulfurization wastewater, which limits its application in engineering (Getler, Shelton, & Furlong, Citation1979; Hill & Zank, Citation2000; Ye et al., Citation2019). So far, most scholars have conducted analyses on the main flue, while less work has been carried out on the bypass flue. In the present study, the influence of the salt content of the desulfurization wastewater in the bypass flue is considered in the droplet evaporation model. The effects of parameters for the nozzle, flue gas and droplets on the droplet evaporation are investigated. The evaporation mechanism is discussed and the process is optimized. The results can provide a reference for the design optimization of evaporation devices in bypass flues.
2. Mathematical method
The flow is steady and is calculated by the Eulerian method. The turbulence model is the shear stress transport (SST) model, which has high accuracy. The discrete droplets are tracked by the Lagrangian method. The combination of Eulerian and Lagrangian methods has better performance in particle tracking than the two-phase flow model (Yang, Teng, & Zhang, Citation2019). The mathematical models adopted in this work are described in the following text.
It should be noted that of the forces applied on the droplets, the drag force and the turbulent diffusion force are most prominent (Shao, Zhang, & Xiong, Citation2015). Other forces, such as the Magnus force which acts on rotating particles, can be ignored as non-applicable in this case (Zhou & Fan, Citation2015). In this work, the influence of droplet shape on drag force is considered, and different droplet shapes have different drag coefficients (Ishii & Zuber, Citation1979). The relevant conservation equations of mass, momentum and energy can be found in Ye et al. (Citation2019).
2.1. Droplet evaporation model
Calcium chloride (CaCl2) is the main component of desulfurization wastewater (You, Wu, & Han, Citation2013). In view of this, CaCl2 solution is adopted as a rough approximation of desulfurization wastewater in this work, and the other few volatiles are neglected. When the vapor pressure on the droplet surface is higher than the partial pressure of vapor in the gas phase, the droplets start to evaporate. For a bi-component droplet, the evaporation process is characterized by the model developed by Abramzon and Sirignano (Citation1989). Good consistency was observed between the simulation results and experimental data for the evaporation of different bi-component droplets (Liu, Liu, Mi, Wang, & Jiang, Citation2016; Sazhin, Citation2006), which validates the reliability of the model.
(1)
(1) where mc is droplet mass; dp is particle diameter;
is the average density of the gas mixture in the film (Abramzon & Sirignano, Citation1989); Dg is used to characterize the diffusion strength between droplets and flue gas;
is the mass transfer criterion; and
can be calculated by:
(2)
(2)
(3)
(3) where
represents the weight content of volatilization and depends on the salt existing in the droplets; and the subscripts S and ∞ represent the surface of a droplet and the position far from a droplet, respectively.
When the droplet temperature exceeds the boiling point, the heat transfer plays the leading role in the evaporation rate, which can be expressed as:
(4)
(4)
The initial droplet diameter is described by the gamma distribution function (Emekwuru, Citation2012).
3. Geometric model and boundary conditions
3.1. Geometric model
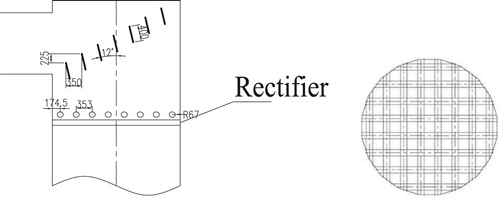
The geometric configuration of a bypass flue is shown in Figure , where the radii of the inlet and outlet are 0.76 and 0.66 m, respectively, and the sectional area of the flue is π × (1.41)2 m2. As the guiding measures, the deflector and rectifier are arranged in the flue to improve the airflow distribution. Their relative sizes are shown in Figure . The rectifier is composed of thin tubes with radius 0.067 m, which are arranged in a criss-cross pattern. The spacing between tubes is 0.353 m. The deflector consists of seven rectangular plates. The inclination angle in the vertical direction is 12°. The plates are arranged in the flue elbow. The plates are of different lengths and the plate width is 0.4 m. The specific location of the deflector and rectifier is adjusted several times until a uniform flue gas is achieved (Sun, Zhao, Li, Ren, and Li, Citation2019).
Figure 2. Bypass flue structure.
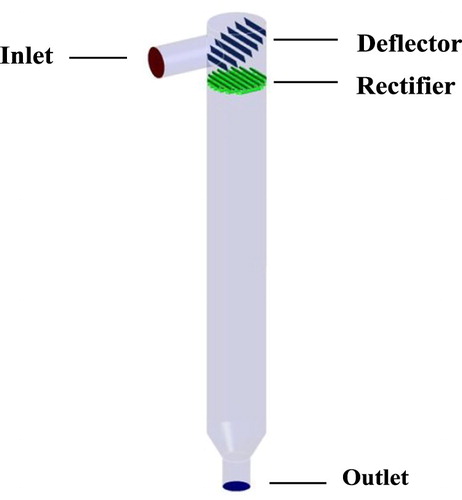
Figure 3. Structure of the deflector and rectifier.
3.2. Reference parameters and boundary conditions
The reference parameters used in the simulation are listed in Table . Unless otherwise specified, the parameters in Table are adopted in the whole simulation. The specific boundary conditions of the inlet, outlet, guiding plate and wall are shown in Table .
Table 1. Reference parameters of gas phase, liquid phase and nozzle.
Table 2. Boundary conditions.
4. Results and discussion
4.1. Effects of moisture
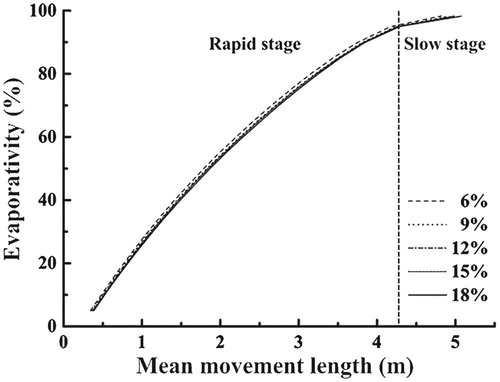
The evaporativity of droplets with mean movement length under different flue gas moistures ranging from 6% to 18% is illustrated in Figure , where the working conditions have been obtained from practical engineering processes. It can be observed that the droplet evaporativity increases continuously with the mean movement length; the curves of evaporativity basically coincide with each other, which means that the evaporativity change due to the fluctuation in flue gas humidity can be neglected. This is because the moisture content of air reaching its saturation state at a high flue gas temperature is high. Normally, the evaporation of droplets under a high temperature can be grouped into rapid and slow evaporation. When the droplets evaporate in the early period, owing to the high moisture content of the droplets and large differences in velocity and temperature of the gas–droplet two-phase flow, the evaporativity of the droplets increases linearly with the evaporation length, which is called rapid evaporation. As time passes, the moisture content of the droplets becomes very low. In this case, the small momentum and heat transfer, as well as the small differences in velocity and temperature of the gas–droplet two-phase flow and the flue gas, induces a significant decline in the droplet evaporation rate, and the crystal precipitation of CaCl2 in the late evaporation stage results in a limited water content and restrains the water evaporation, which is called slow evaporation. Thus, the moisture value adopted in this work is insufficient to inhibit the evaporation of droplets. By calculation, the movement length of rapid evaporation is six times longer than that of slow evaporation.
Figure 4. Change in droplet evaporativity with mean movement length under different humidities.
4.2. Effects of flow field
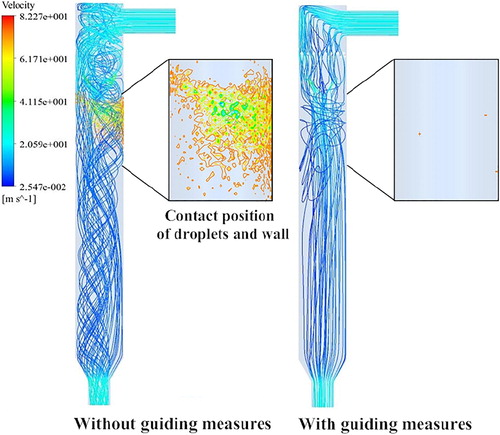
Figure shows the gas flow and impingement location of droplets with and without guiding measures. It can be seen that when the guiding measures are not available, the gas motion is highly irregular, and there is a large collision area between the droplets and the wall, which should be avoided in practice. When the flow is adjusted using the guiding measures, the streamlines are arranged along the flue, and droplets rarely collide with the wall. By statistical analysis, the collision probability is 5.85% and 0.10% in the conditions without and with guiding measures, respectively. This results from the fact that a large amount of radial momentum produced by the irregular motion of flue gas without guiding measures causes the droplets to move towards the wall. During the evaporation of desulfurization wastewater, the physical quantities, including heat, mass and momentum, are interchanged between the hot flue gas and droplets. The flow field distribution not only affects the evaporation effect of the droplets, but also has a high correlation with equipment corrosion. By rationally setting up the guiding measures, the corrosion can be effectively avoided, which can prove valuable for engineering applications.
Figure 5. Flue gas flow diagram.
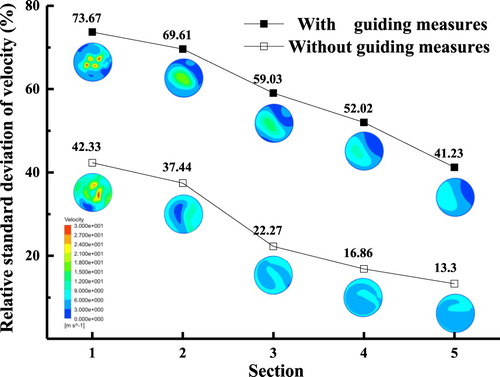
The variation in the evaporation percentage of droplets with mean movement length when the guiding measures are switched on or off is shown in Figure . As can be observed, the movement length with guiding measures is slightly higher than that without guiding measures. To explain this, five cross-sections covering the path that evaporating droplets pass over are selected at equal intervals of 2 m, and numbered 1, 2, 3, 4 and 5 from top to bottom. The relative velocity standard deviation is calculated for the different sections, as shown in Figure . From Figure , one can find that whether the guiding measures exist or not, the velocity distribution becomes more uniform as the section height decreases. This is because the flue gas velocity around the droplets is higher than that far from the droplets owing to the high injection velocity of the droplets. As the evaporation proceeds, under the effect of drag force, the gas droplet velocity difference decreases, which makes the flue gas more uniform. The velocity distribution in each cross-section when the guiding measures are switched off is more even than that when the guiding measures are switched on. This is because the existence of turbulence implies a better mix of flue gas, which causes the small velocity difference at different points of each cross-section. Droplets can absorb heat from a larger volume of flue gas during evaporation. Thus, the evaporation is accelerated. From another point of view, the existence of turbulence is more likely at a larger Reynolds number (Re). In this case, the convective heat transfer intensity and the convective mass transfer intensity, both of which are functions of Re, are large (Abramzon & Sirignano, Citation1989; Sazhin, Citation2006).
Figure 6. Change in droplet evaporativity with mean movement length with and without guiding measures.
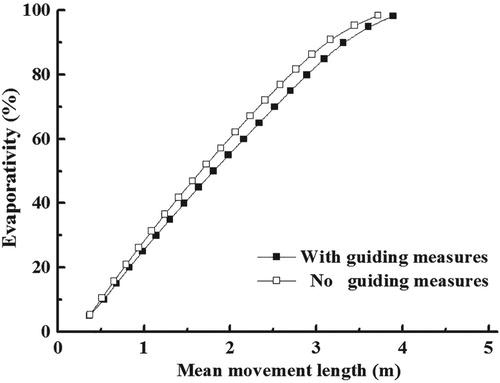
Figure 7. Relative standard deviation of air velocity at different cross-sections; inset figures indicate the velocity distribution in each cross-section.
4.3. Effects of nozzle layout
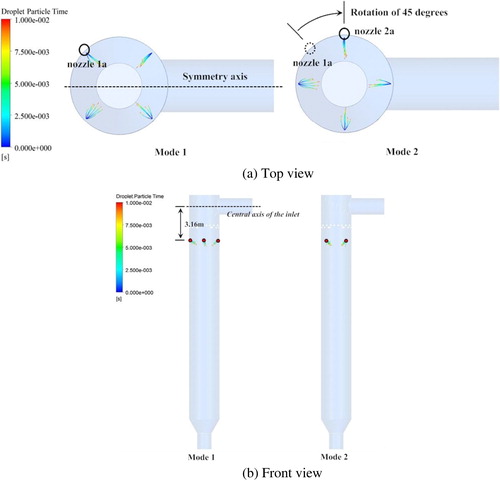
The nozzle layout can influence the route taken by evaporating droplets through the flue. The nozzles are arranged at equal intervals around the circumference at a fixed height of the flue. Two modes are utilized, as shown in Figure (a) and (b) for comparison. In Mode 1, there are two nozzles on both sides of the symmetrical plane of the flue. In Mode 2, the nozzle positions can be obtained by rotating the nozzles in Mode 1 by 45° around the central axis of the flue tube’s cylindrical body.
Figure 8. Nozzle arrangements: (a) top view; (b) front view.
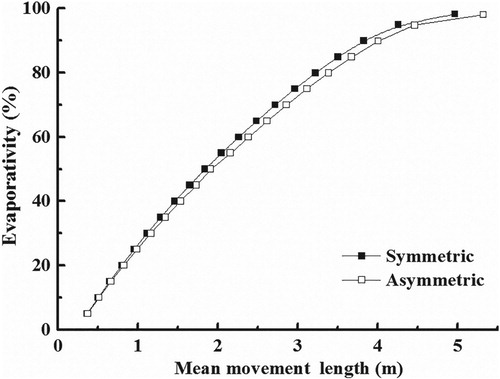
The change rule of droplet evaporativity with mean movement length in Modes 1 and 2 is shown in Figure . One can find that the mean movement length for complete evaporation in Mode 1 is 0.35 m less than that in Mode 2.
Figure 9. Change in droplet evaporativity with mean movement length in Modes 1 and 2.
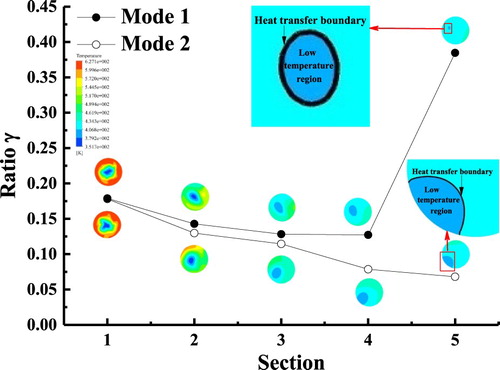
In general, there exists a local low-temperature zone in the region where the evaporating droplets cause the heat loss of hot flue gas by heat exchange as they pass through. The location and size of the low-temperature zone will be changed as the droplets move and evaporate in the flue. Define , where l is the effective heat transfer boundary length and S is the area of the low-temperature zone. When the area of low temperature is constant, the longer the effective heat transfer boundary l, the higher the heat transfer efficiency between gas and liquid. So, a larger value of
means more intense heat transfer between the hot flue gas and the droplets. Corresponding γ values of the low-temperature zone at different cross-sections are calculated as shown in Figure . It can be seen that the local low-temperature zone in Mode 1 is located in the center of each cross-section, and the γ value is higher than that in Mode 2. For the low-temperature zone in Mode 2, there is a tendency to approach the wall. This is because the refracted flow will emerge in the downstream flue after the gas passes through the elbow. The gas velocity near the right wall surface is higher than that on the left side. In the region with a large velocity gradient, the gas carrying the droplets moves to the left. The nozzle position in Mode 2 is just on the symmetrical plane of the flue, where the influence of the elbow is most significant. In Mode 1, the nozzles are not located on the symmetrical plane of the flue and the influence of the elbow is weakened, so the droplet moves along the central axis of the flue tube’s cylindrical body in Mode 1 and the low-temperature zone lies near the central axis; in this case, a larger γ value was produced, implying more intense heat exchange.
Figure 10. Change rule of γ with the height of the cross-section; inset figures show the temperature distribution in each cross-section.
4.4. Effects of nozzle layer
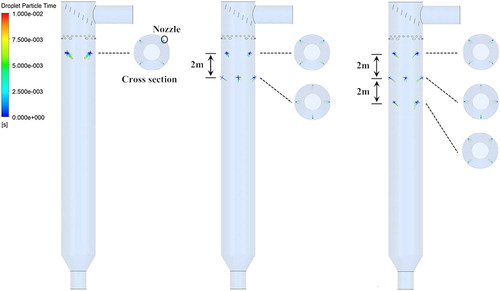
Figure shows the nozzle position under different layers, where the nozzles of two adjacent layers are in a dislocated arrangement and the distance between them is 2 m. The total amount of desulfurization wastewater injected in the flue is the same in all cases.
Figure 11. Nozzle locations under different layers.
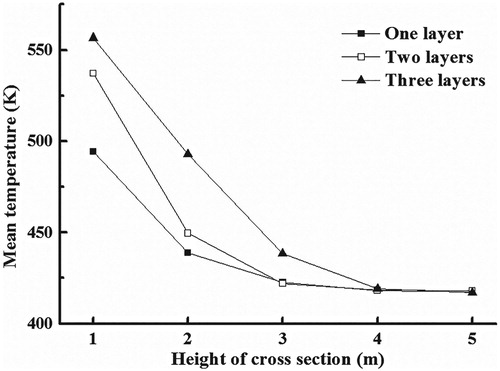
The change in droplet evaporativity with the mean movement length in different layers is shown in Figure . As indicated, with an increased in number of layers, the droplets evaporate more rapidly, and the mean movement path along which the droplets evaporate until the end decreases. The reduction in average movement length with the addition of a single layer nozzle increases from 0.74 m based on a single layer to 1.54 m based on double layers, which shows that increasing the number of nozzle layers is a feasible way to accelerate droplet evaporation. To explain this, the mass-flow-weighted average temperatures at different cross-sections are calculated, as shown in Figure . From Figure , one can find that the average temperature at the same height of the cross-section increases with the number of nozzle layers. This is because with the increase in nozzle layer number, the distribution of droplets in the flue space becomes more dispersed, which aids heat exchange between the droplets and ambient hot flue gas. Moreover, the flue gas heat loss due to droplet evaporation is diluted as the layer number increases, and the temperature of the whole flue is at a high level. By calculation, the average temperature of all cross-sections of three nozzle layers is 10.7 K higher than that of two nozzle layers, and 15.8 K higher than that of one nozzle layer. Here, the temperature of all sections can be used to estimate the average flue temperature. The high temperature in the flue makes the droplets evaporate quickly. With the decrease in the cross-section height, the temperature difference between the different layers decreases and finally tends to zero. This is mainly due to the complete evaporation of the droplets. Based on the law of energy conservation, the heat loss of flue gas within the different layers is equal, so the difference in temperature in each cross-section disappears.
Figure 12. Change in droplet evaporativity with mean movement length under different nozzle arrangement layers.
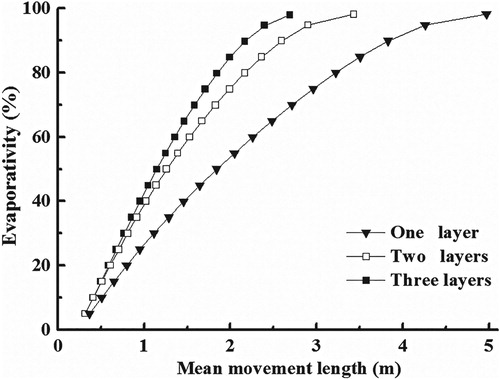
Figure 13. Change in mean movement length with the height of the cross-section.
4.5. Effects of droplet diameter
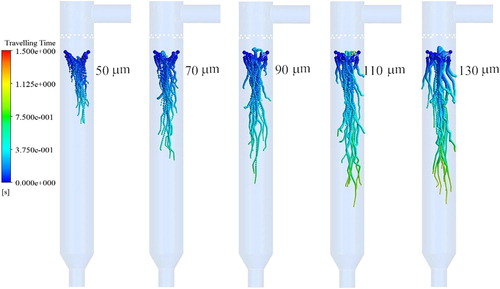
With other conditions being fixed, Figure shows the evaporating trajectories of droplets with different diameters of 50, 70, 90, 110 and 130 µm. As observed, the droplet diameter decreases continuously during evaporation; the bigger droplets move farther in the flue and tend to be closer to the wall, which occurs in the upper part of the flue. This is because the large inertia of big droplets makes it difficult for them to change their direction of motion. The droplets in the upper part of the flue have larger diameters because of the shorter evaporation time. The larger the droplet diameter, the higher the probability of collision between the droplets and the wall owing to their own inertia in the case where the central axis of the nozzle intersects with the wall.
Figure 14. Moving trajectories of droplets with different diameters during evaporation.
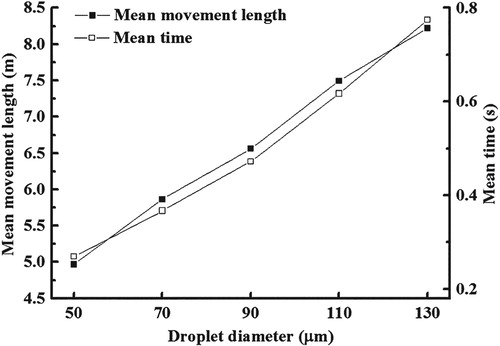
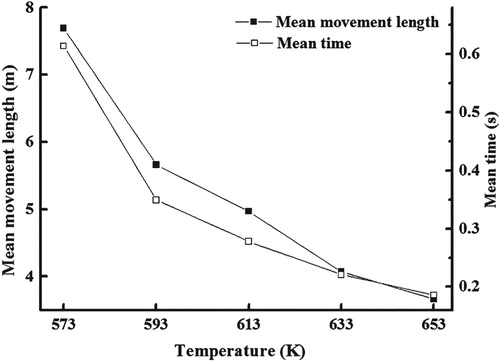
Through statistical analysis, the mean path of the passing droplets and the time that they take until the end of the evaporation can be obtained, as shown in Figure . One can find that the mean movement length lm and time tm when the droplets evaporate until the end are almost linear with the droplet diameter dp, respectively given by with R2 = 0.9982 and
with R2 = 0.9885. This is because the smaller the droplet diameter, the larger the common border of the droplets and the hot flue gas at the same volume of flow rate, and the greater the heat transfer, which results in the temperature of small droplets rising more rapidly than that of bigger droplets. At the same time, the evaporation capacity of smaller droplets is larger than that of bigger droplets. By calculation, the mean velocity of droplets decreases continuously with increasing diameter. This is because droplets with a smaller diameter have a shorter evaporation time, so the velocity drop of smaller droplets is less.
Figure 15. Change rule of mean movement length and time of droplets that evaporate completely with diameter.
4.6. Effects of temperature
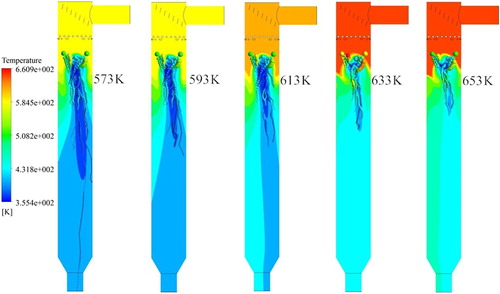
Figure gives the motion trajectory of the droplets under different temperatures (e.g. 573, 593, 613, 633 and 653 K) when other conditions are fixed. From Figure , one can find that the gas temperature drops sharply when hitting the droplets, i.e. a low-temperature zone is formed in the droplet-passing area; with the increase in the temperature, the path forms when the droplet evaporation time becomes shorter. This is because the one-sided improvement of the flue gas temperature means the expansion of the temperature difference between the droplets and the flue gas, which is conducive to the heat passage from the hot flue gas to the low-temperature droplets. This leads to the rapid rise in droplet temperature at high temperatures, which contributes to droplet evaporation. The latent heat of droplets decreases with increasing temperature, meaning that less heat is needed for the evaporation of the same amount of wastewater at a higher temperature. Through the above process, the path along which the droplets evaporate until the end is shortened as the flue gas temperature rises.
Figure 16. Moving trajectories of droplets at different temperatures.
The mean movement length and time at which droplets evaporate completely with respect to temperature is shown in Figure . As can be seen, the mean movement length and time of droplets to evaporate completely decrease with increasing temperature. The reductions in the average movement length and time due to the temperature increase from 573 to 593 K are 2.04 m and 0.265 s, respectively, which are much higher than the values of 0.41 m and 0.035 s caused by the temperature increase from 633 to 653 K. This indicates that the benefit from increasing constant temperature at low temperature is greater than that at high temperature. Therefore, the evaporation effect needs to be improved through a variety of ways, not just by raising the flue gas temperature.
Figure 17. Change rule of mean movement length and time of droplets that evaporate completely with temperature.
5. Conclusions
The evaporation model of saline droplets was adopted to numerically simulate the flow and evaporation characteristics of desulfurization wastewater injected into a bypass flue. The influence of parameters such as flue gas moisture, guiding measures, nozzle arrangement, nozzle layout, flue gas temperature and droplet diameter on the evaporation was systematically investigated. Analyses of the evaporation of droplets showed that the evaporation process at a high temperature comprises rapid evaporation and slow evaporation. Within the range of 6–18%, the influence of flue gas moisture on the evaporation of droplets can be neglected. Under a higher Re, the droplets evaporate more rapidly. It is necessary to use guiding measures to improve the uniformity of the flow field, which helps to prevent droplet collision with the wall surface. By analysis, the collision probability without guiding measures is 5.85%, which is close to 60 times higher than that with guiding measures. For the flue with an elbow, the nozzles should be arranged on both sides of the symmetrical plane of the flue. By this arrangement, the low-temperature zone in the flow field contacts the surrounding hot flue gas more completely, the droplet evaporativity is improved and the probability of wall impact is reduced. With the increase in nozzle layer number, the distribution of droplets in the flue becomes more uniform and the mean temperature of the flue cross-section at the same height increases continuously, which contributes to the evaporation. By calculation, the average temperature of all cross-sections with three nozzle layers is 10.7 K higher than that for two nozzle layers, and 15.8 K higher than that for three nozzle layers. The higher temperature and smaller diameter are conducive to the evaporativity. The research results are instructive for designers studying the spray evaporation technology applied in bypass flues in engineering practice.
Owing to the limitations of the two-component evaporation model, there is still room for improvement of the simulation accuracy. In the future, the application of a multi-component evaporation model on the evaporation of desulfurization wastewater will further improve the guiding role of numerical simulation in engineering.
Disclosure statement
No potential conflict of interest was reported by the authors.
Additional information
Funding
Related Research Data
References
- Abramzon, B., & Sirignano, W. A. (1989). Droplet vaporization model for spray combustion calculations. International Journal of Heat and Mass Transfer, 32(9), 1605–1618. doi: 10.1016/0017-9310(89)90043-4
- Akiko, M., Yoshiki, N., & Kazuaki, T. (2015). Assessment of air quality index and health impact of PM 10, PM 2.5 and SO2 in Yazd, Iran. Journal of Mazandaran University of Medical Sciences, 25(132), 14–23.
- Alessandra, D. M., Chiara, P., Alessandro, A., Luisella, C., Ilaria, D., … Cristina, L. (2019). Impacts of air pollution on human and ecosystem health, and implications for the national emission ceilings directive: Insights from Italy. Environment International, 125, 320–333. doi: 10.1016/j.envint.2019.01.064
- Blazquez, E., Baeza, J. A., Gabriel, D., & Guisasola, A. (2019). Treatment of real flue gas desulfurization wastewater in an autotrophic biocathode in view of elemental sulfur recovery: Microbial communities involved. Science of the Total Environment, 657, 945–952. doi: 10.1016/j.scitotenv.2018.12.037
- Deng, J. J., Pan, L. M., Chen, D. Q., Dong, Y. Q., Wang, C. M., Liu, H. L., & Kang, M. Q. (2014). Numerical simulation and field test study of desulfurization wastewater evaporation treatment through flue gas. Water Science and Technology, 70(7), 1285–1291. doi: 10.2166/wst.2014.359
- Emekwuru, N. G. (2012). Using the general gamma distribution to represent the droplet size distribution in a spray model. Hydrodynamics-Theory and Model. InTech, 79–94.
- Feng, S. Q., Xiao, L. H., Ge, Z. H., Yang, L. J., Du, X. Z., & Wu, H. W. (2019). Parameter analysis of atomized droplets sprayed evaporation in flue gas flow. International Journal of Heat and Mass Transfer, 129, 936–952. doi: 10.1016/j.ijheatmasstransfer.2018.10.023
- Getler, J. L., Shelton, H. L., & Furlong, D. A. (1979). Modeling the spray absorption process for SO2 removal. Journal of the Air Pollution Control Association, 29(12), 1270–1274. doi: 10.1080/00022470.1979.10470925
- Gingerich, D. B., Eric, G., & Mauter, M. S. (2018). Fundamental challenges and engineering opportunities in flue gas desulfurization wastewater treatment at coal fired power plants. Environmental Science: Water Research & Technology, 4(7), 909–925.
- Hill, F. F., & Zank, J. (2000). Flue gas desulphurization by spray dry absorption. Chemical Engineering and Processing: Process Intensification, 39(1), 45–52. doi: 10.1016/S0255-2701(99)00077-X
- Ishii, M., & Zuber, N. (1979). Drag coefficient and relative velocity in bubbly, droplet or particulate flows. AIChE Journal, 25(5), 843–855. doi: 10.1002/aic.690250513
- Jia, F., & Wang, J. (2018). Treatment of flue gas desulfurization wastewater with near-zero liquid discharge by nanofiltration-membrane distillation process. Separation Science and Technology, 53(1), 146–153. doi: 10.1080/01496395.2017.1379539
- Kim, Y., Ng, C. F. S., Chung, Y., Kim, H., Honda, Y., Guo, Y. L., … Hashizume, M. (2018). Air pollution and suicide in 10 cities in northeast Asia: A time-stratified case-crossover analysis. Environmental Health Perspectives, 126(3), 037002. doi: 10.1289/EHP2223
- Langrish, T. (2007). New engineered particles from spray dryers: Research needs in spray drying. Drying Technology, 25(6), 971–983. doi: 10.1080/07373930701396766
- Lee, S., Kim, Y., & Hong, S. (2018). Treatment of industrial wastewater produced by desulfurization process in a coal-fired power plant via FO-MD hybrid process. Chemosphere, 210, 44–51. doi: 10.1016/j.chemosphere.2018.06.180
- Li, R. Z., Zhao, C., Yang, W. Q., Ma, W. M., Jia, Z. L., Wang, C., … Jiao, H. B. (2016). Experimental study of flue gas desulfurization wastewater zero discharge from coal-fired power plant. AER-Advances in Engineering Research, 75, 1000–1005.
- Liang, Z., Zhang, L., Yang, Z., Qiang, T., Pu, G., & Ran, J. Y. (2017). Evaporation and crystallization of a droplet of desulfurization wastewater from a coal-fired power plant. Applied Thermal Engineering, 119, 52–62. doi: 10.1016/j.applthermaleng.2017.02.113
- Lin, C. K., Lin, R. T., Chen, P. C., Wang, P., Marcellis-Warin, N. D., Zigler, C., & Christiani, D. C. (2018). A global perspective on sulfur oxide controls in coal-fired power plants and cardiovascular disease. Scientific Reports, 8(1), 2611. doi: 10.1038/s41598-018-20404-2
- Lisnic, R., & Jinga, S. I. (2018). Study on current state and future trends of flue gas desulphurization technologies: A review. Revista Romana De Materiale-Romanian Journal of Materials, 48(1), 83–90.
- Liu, L., Liu, Y., Mi, M., Wang, Z., & Jiang, L. L. (2016). Evaporation of a bicomponent droplet during depressurization. International Journal of Heat and Mass Transfer, 100, 615–626. doi: 10.1016/j.ijheatmasstransfer.2016.05.007
- Lu, G. Q., Kim, H., Yuan, J. W., Naruse, I., Ohtake, K., & Kamide, M. (1998). Experimental study on self-desulfurization characteristics of biobriquette in combustion. Energy & Fuels, 12(4), 689–696. doi: 10.1021/ef970194c
- Ma, S. C., Chai, J., Chen, G. D., Yu, W. J., & Zhu, S. J. (2016). Research on desulfurization wastewater evaporation: Present and future perspectives. Renewable and Sustainable Energy Reviews, 58, 1143–1151. doi: 10.1016/j.rser.2015.12.234
- Ma, S., Chai, J., Wu, K., Wan, Z. C., Xiang, Y. J., Zhang, J. G., & Fan, Z. (2018). Experimental and mechanism research on volatilization characteristics of HCl in desulfurization wastewater evaporation process using high temperature flue gas. Journal of Industrial and Engineering Chemistry, 66, 311–317. doi: 10.1016/j.jiec.2018.05.045
- Sazhin, S. S. (2006). Advanced models of fuel droplet heating and evaporation. Progress in Energy and Combustion Science, 32(2), 162–214. doi: 10.1016/j.pecs.2005.11.001
- Shao, X. M., Zhang, K., & Xiong, H. B. (2015). Modeling of micro- and nanoparticle characteristics in DC suspension plasma spray. Journal of Thermal Spray Technology, 24(3), 309–317. doi: 10.1007/s11666-014-0182-2
- Song, K., Kim, W., Ryu, T., Ryu, K. W., Bang, J. H., & Jang, Y. N. (2011). Adsorption of Cd(II) on waste calcite produced by the carbonation of flue gas desulfurization (FGD) gypsum. Materials Transactions, 52(2), 224–228. doi: 10.2320/matertrans.M2010344
- Sun, B., Zhao, T., Li, L., Ren, Y. Y., & Li, W. (2019). Flow field uniformity analysis and structural optimization of coal pyrolysis heat exchanger. Engineering Applications of Computational Fluid Mechanics, 13(1), 417–425. doi: 10.1080/19942060.2019.1602081
- Wang, Y. Y. (2016). Zero discharge of wastewater treatment technology of wet desulfurization in coal-fired power plants. AER-Advances in Engineering Research, 84, 294–297.
- Yang, J., Teng, P., & Zhang, H. (2019). Experiments and CFD modeling of high-velocity two-phase flows in a large chute aerator facility. Engineering Applications of Computational Fluid Mechanics, 13(1), 48–66. doi: 10.1080/19942060.2018.1552201
- Ye, X. L., Zhang, C. C., Wang, S., Yang, D., Guo, B. Y., An, X. Z., & Yu, A. B. (2019). Simulation of desulphurization wastewater evaporation through flue gas. Powder Technology. doi: 10.1016/j.powtec.2019.05.046
- You, X. H., Wu, Y. W., & Han, Q. Q. (2013). Demonstration project of power plant desulfurization wastewater evaporation treatment in flue gas duct. Beijing International Environmental Technology Symposium, 237–243.
- Zhang, J. R., Liang, H. S., Zheng, Y. M., Wan, Z. C., Yuan, Z. L., & Liu, Q. B. (2017). Application of zero liquid discharge system of the desulfurization wastewater based on bypass flue evaporation system thermal power plants. Environmental Engineering, 35(10), 5–9.
- Zhou, Q., & Fan, L. S. (2015). Direct numerical simulation of moderate-Reynolds-number flow past arrays of rotating spheres. Physics of Fluids, 27(7), 073306. doi: 10.1063/1.4927552