
 ?Mathematical formulae have been encoded as MathML and are displayed in this HTML version using MathJax in order to improve their display. Uncheck the box to turn MathJax off. This feature requires Javascript. Click on a formula to zoom.
Abstract
One of the difficult requirements imposed on high-quality CFD mesh generation has been the ability to evaluate the mesh quality efficiently. Due to the lack of a general and effective evaluating criterion, the current mesh quality evaluation task mainly relies on various quality metrics for the shape of mesh elements, such as angle, radius, edge and contextual information collected by pre-processing software. However, this line of methods greatly increases the pre-processing cost and may not guarantee a precise quality result. In this paper, we provide a solution to solve the mentioned issues, resulting in a CNN model GridNet and the first mesh dataset NACA-Market. GridNet takes the mesh file as input and then automatically evaluates the mesh quality. Experiment results show that GridNet is capable of performing automatic mesh quality evaluation and outperforms the widely used classifiers. We hope that the proposed large benchmark collection and network could fill in the gaps in the fields of CNN-based mesh quality evaluation and provide potential future research directions in this field.
1. Introduction
Computational fluid dynamics (CFD) numerical simulation plays a vital role in the fields of scientific research and engineering technology, such as aerospace, energy engineering, chemical engineering, automotive engineering, and biological engineering (Chen et al., Citation2018; Fotovatikhah et al., Citation2018; Ghazvinei et al., Citation2018; Liao et al., Citation2015; Moazenzadeh, Mohammadi, Shamshirband, & Chau, Citation2018; Wang, Chau, Qiu, & Chen, Citation2015). Mesh generation, a prerequisite for the numerical calculation, is one of the essential parts of the CFD simulation. The quality of the generated mesh has a significant impact on the accuracy of simulations, as well as solver efficiency. The presence of poor-quality mesh elements may cause the ill-conditioned problem of stiffness matrix during the simulation, which could seriously affect the stability and convergence of a finite element (FE) solver and the accuracy of the partial differential equation (PDEs) solution (Garimella, Shashkov, & Knupp, Citation2004; Katz & Sankaran, Citation2011; Knupp, Citation2001, Citation2003; Yaseen, Sulaiman, Deo, & Chau, Citation2019).
With the development of high-performance computing technology, the size of the solving mesh has gradually increased. The huge scale and the great complexity of meshes pose a new challenge to the high-quality mesh generation. Automatic mesh generation algorithms are employed to solve the large mesh generation (Bader, Schraufstetter, Vigh, & Behrens, Citation2008; Sastry & Shontz, Citation2012). However, the initial meshes obtained by state-of-the-art mesh generators tend to be of poor quality. The study has shown that slivers (poor quality mesh elements) can account for as much as 10 percent of the total number of mesh elements, and even a few poor quality elements can negatively affect the entire simulation (Katz & Sankaran, Citation2011; Sarrate Ramos, Palau, & Huerta, Citation2003). Optimisation methods, such as feature-preserving fairing, mesh smoothing, and local transformation, are achieved to iteratively improve the mesh quality (Shewchuk, Citation2002; Tournois, Wormser, Alliez, & Desbrun, Citation2009; Xu, Cheng, Wang, Xiong, & Zhang, Citation2009). During the process, an effective quality evaluation method is particularly important. First, the quality evaluation method helps guide the mesh generator to select the appropriate algorithm to handle complex regions. Second, the evaluation results can be used to derive the objective function and determine the direction of optimization. Thirdly, the method can be used to evaluate the global quality of the mesh and determine if the quality meets the requirements of the solver.
The problem of mesh quality evaluation has been studied extensively over the years. Since there is no general or absolute criterion for the evaluation of the whole mesh quality, research works mainly focuses on measuring the quality of the elements (Knupp, Citation2001, Citation2003; Sarrate Ramos et al., Citation2003). A variety of quality criteria for triangular, quadrangular, tetrahedron and hexahedron elements are derived. For 2-D meshes, the minimum interior angle criterion and max-min angle criterion are often used to guide the element shape measurement (Liu & Joe, Citation1994). However, these two criteria do not apply to the 3-D mesh.
Three element shape criteria, the minimum solid angle (Joe, Citation1991), the radius ratio ρ (Caendish, Field, & Frey, Citation1985), the gamma coefficient γ (Lo, Citation1997) are widely used to analyze the quality of the 3-D mesh element. The minimum solid angle
of a tetrahedron
is
(1)
(1)
(2)
(2) where V is the volume of the tetrahedron,
is the edge length joining two vertices p and q. The radius ratio ρ is defined as
(3)
(3) where r is the inradius and R is the circumradius of the mesh element. The gamma coefficient γ is defined as
(4)
(4) where
is the square of edge length.
Joe (Citation1991) discussed these three quality criteria and showed that they are ‘equivalent’. It means that if one criterion approaches zero for a poorly shaped mesh element, so does the other. Lo (Citation1997) also believed that the above element shape criteria are closely related to one another and could be considered to be equivalent in a weak sense. However, numerical tests in Nie, Liu, and Sun (Citation2003) have proved that using these measures to evaluate the same mesh element will probably lead to inconsistent results. Thus, an open problem is whether the mesh optimization based on these three element criteria can improve the quality of inverted elements to positive values and yield better quality meshes.
To tackle the above problem, Gao et al. (Citation2017) proposed an analysis framework to study the correlations among different quality metrics and their correlations with the stability and accuracy of the simulations based on hexahedral meshes. Li and Yuan (Citation2005) proposed a weighted criterion to evaluate the quality of triangular meshes. Their quality measurement integrates several criteria, including the inside radius-minimum edge criterion and the minimal angle criterion. The mean ratio n (Parthasarathy, Graichen, & Hathaway, Citation1994) and some variations on n (Wang, Wei, & Tang, Citation2000) are proposed to analyze the quality of tetrahedron meshes generated by a bisection procedure. Dong, Liu, Tan, Wang, and Wang (Citation2012) proposed two quality measures and
. The results show that
and
outperform the metrics QEV S and QEAS of GAMBIT in the high-error interval. However, the calculation cost of the above criteria is expensive, and each criterion may only apply to a specific type of cell or geometric model.
Overall, the existing quality criteria may not guarantee high-quality mesh generation or optimization. This is because the derivation of these criteria is usually specific to a certain cell type or CFD model, and different criteria may even bring different or opposite results to the same mesh. Thus, the current mesh quality evaluation task requires engineers to make judgements by using both the existing quality criteria and their project experience. Since the manual examining heavily increases the CFD pre-processing cost and hinders the automatic generation process of the high-quality meshes, a fully automatic mesh quality evaluator is the most desirable. This is defined as one that takes as input a mesh and associated parameters and then automatically evaluates the mesh quality.
Deep learning has dramatically advanced the state of the art in many areas and enjoyed great success in the replacement of manual labor (Liu & Guo, Citation2017; Maigrot, Kijak, Sicre, & Claveau, Citation2017; Qawaqneh, Abumallouh, & Barkana, Citation2017; Shelhamer, Long, & Darrell, Citation2016; Simonyan & Zisserman, Citation2014). The explosion of data and the increasing of computing power have enabled us to build more sophisticated and robust algorithms and models for the classification tasks, recognition tasks, and detection tasks. The convolutional neural network (CNN) has turned out to be effective for classification tasks (Simonyan & Zisserman, Citation2014). The network usually consists of convolutional layers, pooling layers, and full-connected layers. These layers process the output of the previous layer to produce a robust and compact predict output.
During the training process, the benchmark dataset is employed to optimize the parameters in CNN models. Building datasets for neural network training usually requires collecting a large number of data samples and performing effective labeling. A large number of well-labeled benchmark datasets have been developed for different tasks, such as ImageNet (Deng et al., Citation2009) for object recognition, image classification and automatic object clustering task, TinyImage (Torralba, Fergus, & T Freeman, Citation2008) for object and scene recognition task, FERET (Phillips, Moon, Rauss, & Rizvi, Citation1997) for face recognition task, KDD CUP99 (Tavallaee, Bagheri, Lu, & Ghorbani, Citation2009) for anomaly detection task and Market-1501 (Zheng et al., Citation2015) for person re-identification task.
Employing deep learning methods to evaluate or classify mesh quality is entirely a new attempt, and there has not yet emerged a publicly available dataset of CFD mesh. Since the CNN model needs to be trained on the well-labeled dataset in the evaluation task, it is necessary to perform studies on large mesh dataset before constructing a robust deep learning model. In this paper, we contribute towards the goal of achieving automatic mesh quality evaluation without artificial intervention and reducing the pre-processing cost of numerical simulation. The main contributions are as follows:
We build a high-quality benchmark dataset NACA-Market to facilitate the deep learning based mesh quality evaluation task. Each sample in the dataset is annotated with attributes that affect the mesh quality, such as orthogonality, smoothing, and spacing distribution. NACA-Market is now publicly available for researchers on the website https://github.com/chenxinhai1234/NACA-Market.
To address the problem of mesh quantization, we introduce a new three-channel representation scheme for various meshes in neural network training.
We propose a method to perform automatic mesh quality evaluation by using a deep CNN called GridNet. GridNet takes the mesh file as input and then automatically evaluates the mesh quality.
We conduct a series of experiments on GPUs. The experimental results demonstrate that GridNet can achieve the desired accuracy on NACA-Market. The results also prove that deep learning based mesh quality evaluation is feasible and effective.
Our work, to the best of our knowledge, is the first one to employ convolutional neural networks to evaluate the mesh quality. Collecting and labeling meshes require a lot of time and computing resources. The current version of NACA-Market contains 10240 well-labeled NACA0012 airfoil meshes, and we will continue to collect more meshes with different topologies and different shapes to expand the NACA-Market benchmark for mesh quality evaluation task in our future works. We hope that the proposed large benchmark collection and network will become a central resource for a broad range of mesh-related deep learning research.
2. A new benchmark dataset
The deep learning research benefits from large data collections with ground-truth labels spanning various categories. Such data is widely used for quantitative evaluation and supervised learning(the machine learning task of learning a function that maps an input to an output based on example input-output pairs). Since there has not yet emerged a publicly available dataset of CFD mesh, we would like to build a large collection of meshes with different qualities and high-quality labels, which can be used for the learning process. To achieve this, we developed the first mesh benchmark dataset named NACA-Market. We hope the new dataset will fill in the gaps in the fields of CNN-based mesh quality evaluation and open up new areas for automatic mesh optimization.
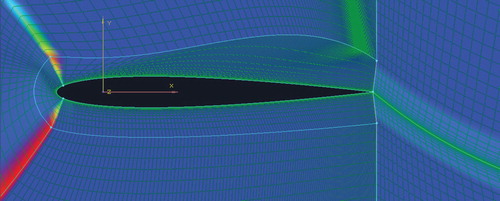
In previous decades, numerous experiments were performed on NACA airfoils to measure the pneumatic parameters, including lift coefficient and drag coefficient under different flow conditions (Li, Wang, & Zhang, Citation2002). The NACA0012 airfoil is one of the most common airfoils (Huang, Huang, Lebeau, & Hauser, Citation2004; Shan, Jiang, Liu, Love, & Marines, Citation2008; Shida, Kuwahara, Ono, & Takami, Citation1987). Limited by the automatic mesh generator, the current version of NACA-Market focuses on the quality evaluation over NACA0012 airfoil. The NACA0012 airfoil in NACA-Market is decomposed into eight blocks (see in Figures and ). Numerical simulations were performed on this airfoil under and
angle of attack condition to measure lift and drag coefficients.
Figure 1. The NACA0012 airfoil.
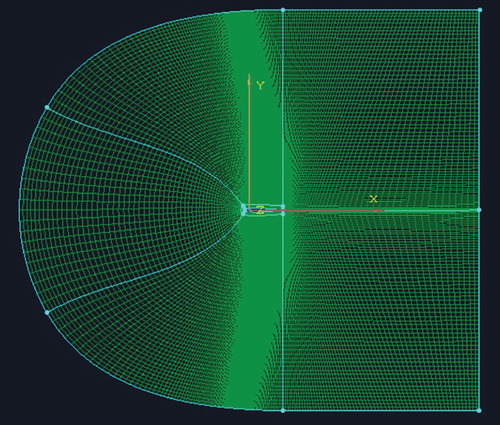
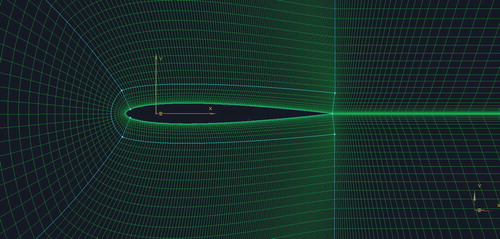
Figure 2. The zoomed-in version of the NACA0012 airfoil.
In an attempt to tackle the difficult problem of building a large number of meshes with different quality levels, we conclude three attributes that have great impacts on the mesh quality.
Smoothing. To ensure the accuracy of the finite element solvers, it is required that the change of the mesh element in the physical space is a gradual transition (smooth transition) rather than a sudden transition. The uneven mesh distribution will lead to the singularity of the reconstructed polynomial distribution, which affects the stability of the process and the accuracy of calculation results.
Orthogonality. Mesh orthogonality means that the lines (surface) of the mesh should be as orthogonal as possible. It is well known that skewed mesh elements with poor orthogonality would cause large computational errors. A large number of experimental results have shown that the orthogonality of the mesh has a great influence on the convergence process. Generally, a mesh with good orthogonality has better convergence and faster convergence speed.
Spacing distribution. In order to ensure the calculation accuracy, it is necessary to distribute relative dense mesh elements at the place where the flow field parameters or the geometric curvature changes greatly, such as the front and rear edges of the wing, the joint of the wing body, and the high Re viscous flow boundary layer area.
After determining the quality attributes, we develop an automatic 2-D mesh generator to obtain NACA airfoil meshes. The mesh generator takes as input a configuration file of NACA0012 airfoil in which the coordinates of mesh points and lines can be modified and then automatically generate the corresponding mesh. Based on this generator, the new mesh benchmark dataset is constructed with the goal that the quality of a large number of meshes should be diverse, and each sample in the dataset should be annotated with quality attributes.
Finally, we constructed the current version of NACA-Market based on the generator and three quality attributes. By modifying the coordinates of mesh points and lines, we obtain meshes with different quality types. The figures below show some examples of meshes in NACA-Market. Figure shows a mesh with poor orthogonality (red is used to highlight the mesh elements failed to maintain orthogonality). Figure presents a mesh with poor smoothness (unsmoothed regions are highlighted in red). Figure gives a mesh with poor distribution (grid density) near the boundary layer, while Figure shows a mesh with poor orthogonality and poor smoothness. It is noted that the above figures are examples with sharp exaggeration in shaping. In NACA-Market, various deformations of meshes are subtle and not obvious.
Figure 3. An example of mesh with poor orthogonality (red is used to highlight the mesh elements failed to maintain orthogonality).
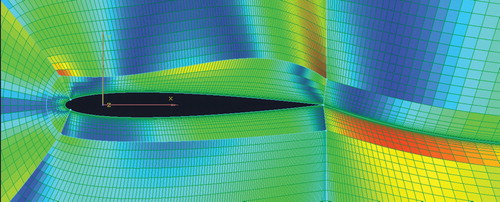
Figure 4. An example of mesh with poor smoothness (unsmoothed regions are highlighted in red).
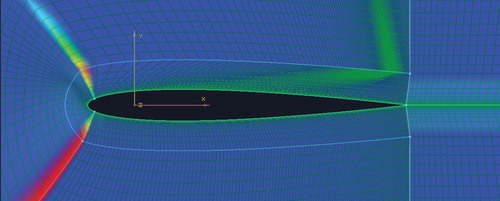
Figure 5. An example of mesh with poor distribution (grid density) near the boundary layer.
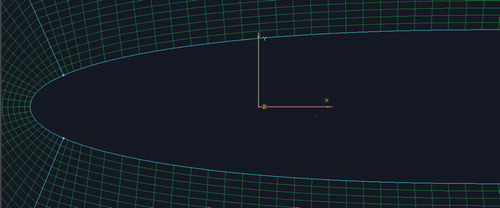
Figure 6. An example of mesh with poor orthogonality and poor smoothness.
The current version of NACA-Market contains 10240 NACA0012 meshes. All the meshes are belonging to eight different quality types with an average of 1280 meshes per type. In order to generate highly accurate labels, we first used the manual discriminant to evaluate the quality of meshes in NACA-Market. Then, we computed meshes received inconsistent results and compared the simulation results with the experimental results. Finally, we labeled meshes with different quality types. The mesh sizes range from to
(see in Table ). The name and detail description of eight quality types are listed in Table . To create training and testing sets, we employed the first 75% of meshes in each size (from 1 to 768) for training and the latter 25% (from 769 to 1024) for testing. In total, there are 7680 meshes for training, and 2560 for testing.
Table 1. The number of meshes of different sizes.
Table 2. The number of meshes of different types.
Overall, the proposed dataset has the following characteristics. First, NACA-Market is the first mesh benchmark dataset with 10240 well-labeled meshes which can be used for mesh-related researches like mesh quality evaluation. Second, NACA-Market employs both the manual annotation and the calculation to ensure the reliability of the label. Third, the number of meshes in the train and test sets are reasonable, and the evaluation results of different works are comparable.
3. A CNN model for mesh quality evaluation task
Evaluating the mesh quality is fundamentally the supervised learning of the classification task. For an input mesh, the task is to predict which of the eight types this example mesh belongs to. When NACA-Market is available, many algorithms can be used to perform classification. In this section, we explain our proposed representations scheme for meshes and deep CNN model GridNet.
3.1. Representation scheme
One major consideration in our classification task is how to represent the mesh. That is, we must first decide which mesh features to extract and how to apply these features to the classification. In general image classification tasks, the networks are trained on the raw RGB values of the pixels. For mesh classification, the distribution of the mesh element is non-uniform. The element size near the boundary layer is very small (usually less than ). Therefore, conventional quantization methods (like pixel for image) do not apply to meshes. It is not yet known which classification algorithms will work best for automatic mesh quality evaluation, so does the representation scheme.
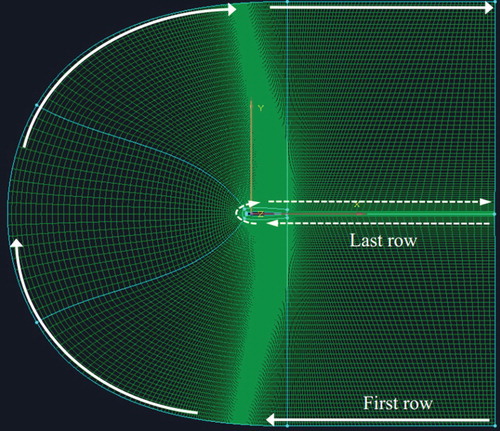
In this paper, we propose a mesh representation scheme for the training process. For each mesh element, we select the length x, length y and maximum included angle to form a three-channel quality feature (see in Figure ) which is analogous to the RGB three-channel feature of images. These quality features of each element are automatically extracted when we generate the mesh. Then, we generate the input matrix from the mesh. The first row of the matrix corresponds to the quality feature of the outermost mesh elements in the mesh, and the last row corresponds to the mesh elements near the boundary layer (see in Figure ). In each channel, the number of entries in the matrix is equal to the number of mesh elements.
Figure 7. The mesh representation scheme.
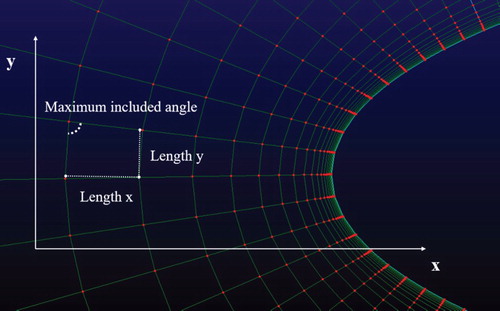
Figure 8. The generation of the input mesh matrix from a mesh.
After that, we use a CNN-based model as a mesh quality discriminator to evaluate the quality of the mesh. The three-channel mesh representation(input matrix) is fed to the network model to calculate the softmax probability output vector.
3.2. Architecture
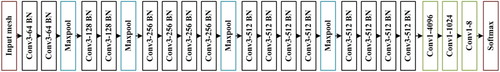
In our work, we architect a deep CNN model GridNet trained on NACA-Market for mesh quality evaluation. As depicted in Figure , GridNet contains nineteen convolutional layers with weights and four max-pooling layers.
Figure 9. The architecture and configuration of the GridNet. COV3-64 represents a convolution layer with a 64-channel convolutional kernel of with a stride of 1.
Each layer of data in a convnet is a three-dimensional array of size , where h and w are the spatial dimensions of the input mesh matrix, and d is the feature or channel dimension. The update rule in each convolutional layer is
(5)
(5) where
is the nth feature map in the lth layer,
is the nth feature map in the (l−1)th layer,
is the convolutional filter between these two feature maps, f is the activation function, and b
is the biases. The proposed model employs small (
) convolution filters with stride 1.
Max-pooling layers in GridNet summarize the outputs of neighboring groups of neurons in the same feature map. The max-pooling layers are operated at the end of the first four convolutional blocks (performed over a filter with stride 2). Due to the small size of some meshes in NACA-Market (e.g. the minimum mesh size is
), we removed the max-pooling layer in the fifth convolutional block so as to retain ample feature information.
The current version of NACA-Market contains 10240 meshes with different sizes. In order to enhance the practicability of GridNet and handle the arbitrary-sized mesh inputs, we append three convolutions with channel dimensions 4096, 1024, 8 respectively to predict scores for each of the mesh quality types. The final layer is the softmax layer. To obtain the final probability vector for the input mesh, we average the output vector of the last convolutional layer and feed it to the eight-way softmax, which produces a distribution over the eight type labels. In this way, we build a fully convolutional network that takes input of the arbitrary size and produce correspondingly-sized output.
The current version of NACA-Market built for mesh quality evaluation task is relatively small compared in size with datasets designed for other classification tasks. Overfitting problem (e.g. the model corresponds too closely to the training set, and fails to fit the testing set) becomes one of the most challenging problems in GridNet. To tackle the overfitting problem that occurs when trained on NACA-Market, we first employed dropout (zero the output of each hidden neuron with a probability) to learn more robust features. The dropout is used in the last three convolutional layers in Figure . Moreover, hidden layers are equipped with a composite function of rectified linear units (ReLU) and batch normalization (BN). The composite function is applied to the output of the first sixteen convolutional layers. This composite function allows us to be less careful about the initialization and set relatively bigger learning rates, and finally improves the performance on the NACA-Market.
4. Experimental results and discussion
4.1. Training for mesh quality evaluation
Stochastic gradient descent (SGD) with momentum has been proved to be an effective way of training deep networks. Our proposed network is carried out by using mini-batch gradient descent with momentum (batch of size 64 and momentum of value 0.9) and cross-entropy loss. In addition, the weight decay ( regularization of weights) is set to 0.0003. We found that this small amount of weight decay is important for the model to learn.
For the weight initialization of nineteen convolution layers, we sampled the weights from a he-normal distribution with the zero mean and standard deviation (
is the number of input units in the weight tensor), while the biases are initialized to 0.1. A dropout rate of 0.5 is used to regularize the network parameters during the training process. The training starts with a 0.01 learning rate, and we manually adjusted the learning rate throughout the training.
In the training process, the input mesh representation is fed to the input layer of the network and then passes through a stack of convolutional layers. The stochastic gradient descent method optimizes and finds the parameters of the connected layers that minimize the loss value for mesh quality evaluation. Since cropping or padding may change the mesh attribute, we did not pre-process the meshes in any other way. We adopt the fully convolutional network which takes input of any size and then outputs corresponding spatial dimensions.
To simplify our experiments, we did not use any unsupervised pre-training even though we expect that it will help. We trained the network for 100 epochs (run for 200 iterations over the training set of NACA-Market) on two NVIDIA Tesla P100 GPUs. The training time of GridNet is around 79 s per epoch, and the predicting time for a new input mesh is around 4 ms.
4.2. Prediction
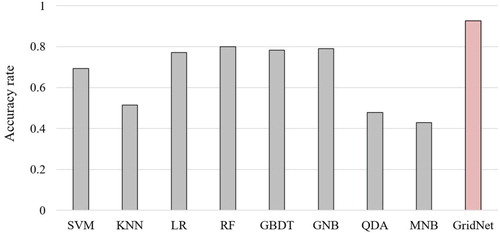
For the sake of comparison, a variety of classifiers was trained and tested on NACA-Market. We selected eight widely used classifiers in the Scikit-learn library (Pedregosa et al., Citation2012): RBF Support Vector Machine, K-Nearest Neighbor, Logistic Regression, Random Forest, Gradient Boosting Decision Tree, Gaussian Naive Bayes, Quadratic Discriminant Analysis, and Multinomial Naive Bayes to learn the behavior on NACA-Market. Since algorithms and classifiers in the Scikit-learn library requires a constant input dimension, we extract a mesh subset with a fixed mesh size from NACA-Market. The subset contains 1024 meshes with mesh size . Aside from illustrating the usefulness on the whole dataset, we first train classifiers on the subset of NACA-Market. We note that we applied Scikit-learns default values as the input parameters of these eight classifiers.
As can be seen in Figure , the accuracy rate of the simple classifiers, in conjunction with the subset of NACA-Market datasets, is relatively low. As an example, the classification results of QDA and MNB trained on the fixed-size mesh subset are 47.8% and 42.9%, which are quite poor compared to other learning approaches. Approaches like SVM, LR, RF, GBDT, and GNB give a reasonable performance on the mesh quality evaluation task. However, it is clear that features extracted by the proposed CNN model GridNet are more effective than the performance obtained by classifiers in the Scikit-learn library. GridNet outperforms other trained classifiers and achieves the accuracy of 92.5%.
Figure 10. The performance of different classifiers on the subset of NACA-Market(1024 same-sized meshes).
To perform the overall performance across different mesh sizes, GridNet was trained on the whole NACA-Market for mesh quality evaluation task. Table gives the confusion matrix for GridNet. Experimental results show that GridNet presented in this paper is suitable for the quality evaluation of meshes with different sizes and obtains high classification effects. From Table , we can see that the type of P-SD is estimated with the highest accuracy of 95.0%. Meshes with poor smoothness and distribution contain distinctive features that enable the CNN-based model to distinguish this type easily. P-O (meshes with poor orthogonality) and P-OD (meshes with poor orthogonality and distribution) classified with the lowest accuracies, 86.6% and 89.1% respectively. Analyzing the result, we found that both of them are highly misclassified to type with poor smoothness (10.9% of P-O to P-OS and 8.1% of P-OD to P-OSD). Type W is classified with an accuracy of 92.5%. Other types like P-S, P-D, P-OS, and P-OSD achieve reasonable performance, and the accuracy rates are around 90.5%. Since NACA-Market is with even class size (around 1280), we ignore the analysis caused by imbalanced samples.
Overall, we evaluate the classification results on NACA-Market. The results show that a deep learning algorithm is capable of performing mesh quality evaluation on NACA-Market using the proposed representation scheme. By taking as input a mesh and associated parameters, the CNN-based model can automatically evaluate the quality. The trained model can be used to guide the quality optimization process and finally evaluate the overall quality of the mesh to determine whether the quality meets the solver requirements. For example, for meshes with the type of poor smoothness, mesh smoothing algorithms are needed to optimize the mesh quality. Meshes with the type of poor orthogonality refer to the meshes of which their connectivity needs to be changed by applying topological transformations or local transformations. For mesh with poor distribution, local refinements like locally thickened and local mesh densification should be employed (Table ).
Table 3. Confusion Matrix for the proposed model.
5. Conclusion
High-quality meshes are necessary for the efficiency and accuracy of the solving process in CFD numerical simulation. Due to the lack of a general or absolute quality evaluation criterion, the current mesh quality evaluation process cannot get rid of the manual intervention. That is, the quality of the mesh relies on various quality metrics for the shape of elements, such as angle, radius and contextual information collected by the pre-processing software. This makes it infeasible to achieve fully automatic mesh optimization and increases the pre-processing overhead. Moreover, these traditional geometry methods may ignore some features that seriously affect the accuracy of numerical calculations, such as local mesh refinement. The great success of deep learning in the field of computer vision has brought new solutions to this problem.
In this paper, we introduce the first mesh benchmark dataset NACA-Market, which bridges the gap between deep learning and researches on mesh quality evaluation. Moreover, a deep CNN model GridNet trained on NACA-Market is proposed in an attempt to provide a novel mesh quality evaluation method. Experiment results show that the quality evaluation based on a deep learning algorithm is feasible and effective. It outperforms other trained classifiers and achieves the accuracy of 92.5% on NACA-Market.
Our future works will focus on further expanding the NACA-Market to include more well-labeled 2D/3D meshes of different geometric shapes. We believe that the diversity and large scale of NACA-Market will enable it to become a novel and challenging benchmark dataset for future researches. We hope this new dataset could fill in the gaps in the fields of CNN-based mesh quality evaluation and open up new areas for automatic mesh processing.
Disclosure statement
No potential conflict of interest was reported by the author(s).
Additional information
Funding
Related Research Data
References
- Bader M., Schraufstetter S., Vigh C., & Behrens J. (2008, January). Memory efficient adaptive mesh generation and implementation of multigrid algorithms using Sierpinski curves. International Journal of Computational Science and Engineering, 4, 12–21. doi: 10.1504/IJCSE.2008.021108
- Caendish J. C., Field D. A., & Frey W. H. (1985, February). An approach to automatic three-dimensional mesh generation. International Journal for Numerical Methods in Engineering, 21, 329–347. doi: 10.1002/nme.1620210210
- Chen X., Liu J., Li S., Xie P., Chi L., & Wang Q. (2018). TAMM: A new topology-aware mapping method for parallel applications on the Tianhe-2A supercomputer. In J. Vaidya and J. Li (Eds.), Algorithms and architectures for parallel processing (pp. 242–256). Cham: Springer International Publishing.
- Deng J., Dong W., Socher R., Li L J., Li K., & Li F.F. (2009, June). ImageNet: A large-scale hierarchical image database (pp. 248–255).
- Dong, L., Liu, H., Tan, M., Wang, Y., & Wang, K. (2012). A method for confirming relationship between mesh quality measures and CFD numerical accuracy. Journal of Central South University, 43(11), 134–140.
- Fotovatikhah F., Herrera M., Shamshirband S., Chau K.-W., Ardabili S.F., & Piran M.J. (2018). Survey of computational intelligence as basis to big flood management: Challenges, research directions and future work. Engineering Applications of Computational Fluid Mechanics, 12(1), 411–437. doi:10.1080/19942060.2018.1448896.
- Gao X., Huang J., Xu K., Pan Z., Deng Z., & Chen G. (2017, August). Evaluating Hex-Mesh quality metrics via correlation analysis. Computer Graphics Forum, 36(5), 105–116. doi:10.1111/cgf.13249.
- Garimella R.V., Shashkov M.J., & Knupp P.M. (2004). Triangular and quadrilateral surface mesh quality optimization using local parametrization. Computer Methods in Applied Mechanics and Engineering, 193(9-11), 913–928. doi: 10.1016/j.cma.2003.08.004
- Ghazvinei P.T., Darvishi H.H., Mosavi A., bin Wan Yusof K., Alizamir M., Shamshirband S., & Chau K.-W. (2018). Sugarcane growth prediction based on meteorological parameters using extreme learning machine and artificial neural network. Engineering Applications of Computational Fluid Mechanics, 12(1), 738–749. doi:10.1080/19942060.2018.1526119.
- Huang L., Huang P., Lebeau R., & Hauser T. (2004, September). Numerical study of blowing and suction control mechanism on NACA0012 airfoil. Journal of Aircraft, 41, 1005–1013. doi: 10.2514/1.2255
- Joe B. (1991, April). Delaunay versus max–min solid angle triangulations for 3-D mesh generation. International Journal for Numerical Methods in Engineering, 31, 987–997. doi: 10.1002/nme.1620310511
- Katz A., & Sankaran V. (2011). Mesh quality effects on the accuracy of CFD solutions on unstructured meshes. Journal of Computational Physics, 230(20), 7670–7686. doi: 10.1016/j.jcp.2011.06.023
- Knupp P.M. (2001, January). Algebraic mesh quality metrics. SIAM Journal on Scientific Computing, 23(1), 193–218. doi: 10.1137/S1064827500371499
- Knupp P.M. (2003, January). Algebraic mesh quality metrics for unstructured initial meshes. Finite Elements in Analysis and Design, 39(3), 217–241. doi: 10.1016/S0168-874X(02)00070-7
- Li Y., Wang J., & Zhang P. (2002, January). Effects of Gurney flaps on a NACA0012 airfoil. Flow, Turbulence and Combustion, 68, 27–39. doi: 10.1023/A:1015679408150
- Li, X., & Yuan, K. (2005). A representation of the quality measures of triangular meshes. Journal of Dalian Nationalities University, 7(5), 36–38.
- Liao X K., Pang Z B., Wang K F., Lu Y T., Xie M., Xia J., …Suo G. (2015, January). High performance interconnect network for Tianhe system. Journal of Computer Science and Technology, 30(2), 259–272. doi: 10.1007/s11390-015-1520-7
- Liu Y., & Guo Y. (2017). On the exploration of convolutional fusion networks for visual recognition. In L. Amsaleg, G. Ó. Gumundsson, C. Gurrin, B. Ó. Jónsson, & S. Satoh (Eds.), Multimedia modeling (pp. 277–289). Cham: Springer International Publishing.
- Liu A., & Joe B. (1994, January). Relationship between tetrahedron shape measures. BIT, 34, 268–287. doi: 10.1007/BF01955874
- Lo S. (1997, June). Optimization of tetrahedral meshes based on element shape measures. Computers & Structures, 63, 951–961. doi: 10.1016/S0045-7949(96)00399-9
- Maigrot C., Kijak E., Sicre R., & Claveau V. (2017). Tampering detection and localization in images from social networks: A CBIR approach. In S. Battiato, G. Gallo, R. Schettini, & F. Stanco (Eds.), Image analysis and processing - ICIAP 2017 (pp. 750–761). Cham: Springer International Publishing.
- Moazenzadeh R., Mohammadi B., Shamshirband S., & Chau K. (2018). Coupling a firefly algorithm with support vector regression to predict evaporation in northern Iran. Engineering Applications of Computational Fluid Mechanics, 12(1), 584–597. doi:10.1080/19942060.2018.1482476.
- Nie, C., Liu, J., & Sun, S. (2003). Study on quality measures fpr tetrahedral mesh. Chinese Journal of Computational Mechanics, 20(5), 579–582.
- Parthasarathy V., Graichen C., & Hathaway A. (1994, January). A comparison of tetrahedron quality measures. Finite Elements in Analysis and Design, 15, 255–261. doi: 10.1016/0168-874X(94)90033-7
- Pedregosa, F., Varoquaux, G., Gramfort, A., Michel, V., Thirion, B., Grisel, O., … Duchesnay, É. (2012). Scikit-learn: Machine learning in python. Journal of Machine Learning Research, 12, 2825–2830.
- Phillips P.J., Moon H., Rauss P., & Rizvi S. (1997, July). The FERET evaluation methodology for face recognition algorithm (Vol. 22, pp. 137–143).
- Qawaqneh Z., Abumallouh A., & Barkana B. (2017, September). Deep convolutional neural network for age estimation based on VGG-face model.
- Sarrate Ramos, J., Palau, J., & Huerta, A. (2003). Numerical representation of the quality measures of triangles and triangular meshes. Communications in Numerical Methods in Engineering, 19, 551–561. doi: 10.1002/cnm.585
- Sastry, S., & Shontz, S. (2012). A log-barrier method for mesh quality improvement and untangling. Engineering with Computers, 30, 315–329. doi: 10.1007/s00366-012-0294-6
- Shan H., Jiang L., Liu C., Love M., & Marines B. (2008, September). Numerical study of passive and active flow separation control over a NACA0012 airfoil. Computers & Fluids, 37, 975–992. doi: 10.1016/j.compfluid.2007.10.010
- Shelhamer E., Long J., & Darrell T. (2016). Fully convolutional networks for semantic segmentation. CoRR abs/1605.06211. Retrieved from http://arxiv.org/abs/1605.06211.
- Shewchuk J. (2002, May). Delaunay refinement algorithms for triangular mesh generation. Computational Geometry, 22, 21–74. doi: 10.1016/S0925-7721(01)00047-5
- Shida Y., Kuwahara K., Ono K., & Takami H. (1987, March). Computation of dynamic stall of a NACA0012 airfoil. AIAA Journal, 25, 408–413. doi: 10.2514/3.9638
- Simonyan K., & Zisserman A. (2014, September). Very deep convolutional networks for large-scale image recognition. arXiv 1409.1556.
- Tavallaee M., Bagheri E., Lu W., & Ghorbani A. (2009, July). A detailed analysis of the KDD CUP 99 data set. IEEE symposium. Computational intelligence for security and defense applications, CISDA 2.
- Torralba A., Fergus R., & T Freeman W. (2008, December). 80 million tiny images: A large data set for nonparametric object and scene recognition. IEEE Transactions on Pattern Analysis and Machine Intelligence, 30, 1958–1970. doi: 10.1109/TPAMI.2008.128
- Tournois J., Wormser C., Alliez P., & Desbrun M. (2009, July). Interleaving delaunay refinement and optimization for practical isotropic tetrahedron mesh generation. ACM Transactions on Graphics, 28, 1. doi: 10.1145/1531326.1531381
- Wang W., Chau K., Qiu L., & Chen Y. (2015). Improving forecasting accuracy of medium and long-term runoff using artificial neural network based on EEMD decomposition. Environmental Research, 139, 46–54. doi: 10.1016/j.envres.2015.02.002
- Wang, H., Wei, X., & Tang, G. (2000). Measurement of finite elements distortion. Journal of Computer Aided Design and Computer Graphics, 12(3), 179–183.
- Xu K., Cheng Z Q., Wang Y., Xiong Y., & Zhang H. (2009, June). Quality encoding for tetrahedral mesh optimization. Computers and Graphics, 33, 250–261. doi: 10.1016/j.cag.2009.03.020
- Yaseen Z.M., Sulaiman S.O., Deo R.C., & Chau K.W. (2019). An enhanced extreme learning machine model for river flow forecasting: State-of-the-art, practical applications in water resource engineering area and future research direction. Journal of Hydrology, 569, 387–408. doi: 10.1016/j.jhydrol.2018.11.069
- Zheng L., Shen L., Tian L., Wang S., Wang J., & Tian Q. (2015, December). Scalable person re-identification: A benchmark (pp. 1116–1124).