
 ?Mathematical formulae have been encoded as MathML and are displayed in this HTML version using MathJax in order to improve their display. Uncheck the box to turn MathJax off. This feature requires Javascript. Click on a formula to zoom.
Abstract
In the operation of a nuclear plant system, a distorted inflow of a reactor coolant pump appears owing to the steam generator channel head and multi-bend, leading to the deterioration of pump performance and stability. In the present study, three-dimensional numerical calculations of three model geometries are carried out using block grid technology, with RNG k-ε and DDES model applied in the steady and transient simulation. The simulation results are validated with an experiment testing the pump with a short inlet pipe. As for the results, under the distorted inflow condition, the pump head and efficiency are reduced by 4% and 5.2% respectively at the nominal flow rate. Additionally, when the pump is coupled with upstream structures, the inlet flow becomes distorted and more chaotic, and the swirl and radial flow are produced by asymmetric pressure difference. Meanwhile, a pair of local vortices appears in the inlet section, forming re-distributed mass flow rates. As the distorted flow enters the pump, the blade inlet pressure and flow rate are unevenly distributed. Moreover, the evolution process of the vortex is accompanied with strong non-uniformity in the impeller channel, and thus asymmetric tangential force is imposed on the blades, increasing the risk of the fatigue breakdown of the impeller.
Nomenclature
| Q | = | mass flow rate (m3/h) |
| H | = | pump head |
| Qd | = | nominal mass flow rate (m3/h) |
| Qopt | = | flow rate at different operating conditions (m3/h) |
| Hdes | = | pump head under nominal rate flow (m) |
| nd | = | nominal rotational speed (r/min) |
| Δt | = | time step (s) |
| U | = | blade tip velocity (m/s) |
| g | = | local gravitational acceleration, 9.82 m2/s |
| b2 | = | impeller outlet width (mm) |
| Zi | = | impeller blade number, non-dimensional |
| Zd | = | diffuser blade number, non-dimensional |
| Zt | = | tube number, non-dimensional |
| Lx | = | different cross section along the flow direction |
| Ap | = | pipe cross section area (m2/s) |
| y+ | = | the ratio of half the height of the first layer to the viscous length scale, non-dimensional |
| cv | = |
|
| = | average axial velocity in cross section, (m/s) | |
| P* | = |
|
| = | average static pressure in pump inlet, (Pa) | |
| R | = | the threshold of Omega method, non-dimensional, 0 < R < 1 |
| Fr* | = | Fr / (0.5ρU2 πD2b2), radial force coefficient, non-dimensional |
| Fa* | = | Fa / (0.5ρU2 πD2b2), axial force coefficient, non-dimensional |
| Fx* | = | Fx / (0.5ρU2 πD2b2), x component of radial force coefficient, non-dimensional |
| Fy* | = | Fy / (0.5ρU2 πD2b2), y component of radial force coefficient, non-dimensional |
| Va | = | axial velocity (m/s) |
| Va,design | = | axial velocity under design condition (m/s) |
| Av | = | vortex iso-surface area (m2/s) |
| As | = | pipe cross section area (m2/s) |
Abbreviations
| RCP | = | reactor coolant pump |
| SG | = | steam generator |
| BLI | = | boundary layer ingesting |
Greek symbols
| η | = | efficiency (%) |
| ηd | = | efficiency under nominal rate flow (%) |
| ρ | = | fluid density (kg/m3) |
| ω | = | rotating direction of impeller |
| α | = | radial flow angle (°) |
| β | = | absolute whirl flow angle (°) |
| ξ | = | Vorticity/(Q/Ap*D4) ,vorticity coefficient, non-dimensional |
| φ, φa | = | Q/(πD2b2U), flow coefficient, flow coefficient at nominal flow rate Qd, non-dimensional |
| ψ, ψa | = | gH/(0.5*;U2), head coefficient, head coefficient at nominal flow rate Qd, non-dimensional |
| γ | = | Av/As, vortex iso-surface area coefficient, non-dimensional |
1. Introduction
A reactor coolant pump (RCP) normally works at a high temperature, a high pressure and in a strong radiation environment, with its operation guaranteed safe and reliable during its entire lifetime (Gan & Gao, Citation2016). Generally, the RCP and other rotating-type pieces of machinery are designed based on the assumption of a uniform inflow condition. However, the true operating conditions vary widely according to the different applications, which leads to inflow distortion and alters the desired performance under the optimal design condition. Nevertheless, some investigations have been carried out to study inflow conditions in rotating machinery, showing that inflow distortion worsens working performance. For the aspect of compressors and fans, Herrick (Citation2010) studied the effect of distorted inlet flow on the aerodynamic stability of high-speed forward-swept blades, revealing that the flow distortion would reduce the stability of aeroelasticity and increase the risk of high-cycle fatigue. Also, inflow distortion exacerbates the high cycle fatigue of the blade in the compressor (Engeda et al., Citation2003; Zemp et al., Citation2010). Wadia (Citation2011) conducted a pilot of the performance of a forward-swept rotor in a multi-stage compressor under inflow distortion and found that the inlet guide vane row reduced the sensitivity of the multi-stage compressor to inflow distortion; moreover, it augmented the vibration amplitude of the blade. Gunn et al. (Citation2013) developed full-annulus experimental measurements of the flow field in a low-speed fan stage operating with a continuous 60-degree inlet stagnation pressure distortion. Their results showed that the stage total-to-total efficiency is reduced by inflow distortion, and that the whirl angel distortion generates flow separation, increasing loss generation in the stator row. Gunn and Hall (Citation2014) performed high-resolution experimental measurements and full-annulus transient numerical simulations on a low-speed fan rig operating with a representative BLI inlet velocity distribution to explain the abnormal flow phenomenon and fluid dynamical loss sources in BLI fans. They revealed that flow redistribution leads to an attenuation of the axial velocity non-uniformity and generates non-uniform swirl and radial flow angles at the inlet section. Additionally, the distorted flow field creates circumferential and radial variations in diffusion factor with a corresponding loss variation around the annulus, and the BLI leads to wide variations in rotor shock structure, strength, and position. For the inflow optimization, a non-axisymmetric design method was raised for the stator of a low-speed BLI fan (Gunn & Hall, Citation2017). Sectional design changes were applied at each radial and circumferential location and this approach was combined with the application of non-axisymmetric lean. As a result, they proved that this approach could eliminate additional loss in a BLI fan stator. Vagnoli and Verstraete (Citation2015) conducted research on the effects of a bent pipe on the performance of a centrifugal compressor and revealed that when the elbow is installed in front of the impeller, the distorted flow suppresses the formation of a rotating stall pattern. Additionally, the effect of non-uniform inflow on the hydraulic performance of pumps and turbines is non-negligible. Non-uniform inflow would lead to the asymmetric distribution of flow fields and the uneven axial speeds would cause unstable loads on the rotor blades, resulting in noise, vibration, and an increase in the risk of cavitation (Duerr & Von Ellenrieder, Citation2015). Mittag and Gabi (Citation2015) verified the results of CFD using experimental data and obtained the relationship between suction pressure and rotational speed in the non-uniform flow field, which has a certain guiding effect on the use of large centrifugal pumps. The pre-whirl regulation by inlet guide vanes (IGVs) has been proven to be an effective method for the operation regulation of centrifugal pumps (Liu, Tan, et al., Citation2018). Sun et al. (Citation2012) investigated the effects of the large leading-edge diameter and wedge angle on the turbine blade performance under off-design conditions through experimental and numerical studies. Their results show cascade has good off-design performance due to the large diameter and wedge angle. The non-uniform velocity field started from its suction inlet, and its configuration may make the pump prone to cavitation (Allen et al., Citation2014). Esch (Citation2009) investigated the effects of non-uniform inflow on the hydrodynamics of a mixed flow pump. In the case of non-uniform inflow, the torque, head, and axial force of the mixed flow pump were reduced, while the radial force was increased. Bulten and Esch (Citation2007) calculated the radial force of the propulsion pump under inflow distortion and found that the inflow distortion caused the blade to produce additional radial forces in a nearly constant direction. Ding et al. (Citation2019) revealed that swirling inflow causes high loss of circumferential velocity in the turbine housing. Michelassi et al. (Citation2015) explored the mechanism of inflow phenomena in a low-pressure turbine and explained the mixing and deformation of its wake. As a rotating part of a nuclear reactor, the RCP shares the common characteristics of pumps. Since it stands in the closed loop with strict operating requirements in a nuclear power plant, any changes in output demand a quick response of the loop, especially the upstream component of the RCP. To this point, some factors that damage the performance and stability of the main pump, and the optimizations with or without the distorted inflow, have been studied. Zhang et al. (Citation2018) conducted a flow measurement using particle image velocimetry (PIV) in a model RCP, revealing that near the lower end of the discharge nozzle, three-dimensional swirling flows and flow separation are evident. In the diffuser, the imparity of the velocity profile with respect to different axial cross sections is verified, and the velocity increases gradually from the shroud to the hub. Cheng et al. (Citation2019) analyzed external characteristics through the axial and circumferential position changes in the vane and the annular casing. Long et al. (Citation2016) used orthogonal methods to optimize the diffuser both numerically and experimentally, thus improving the hydraulic performance of the pump. Zhou and Wang (Citation2017) revealed that the positive stacking lean angle is of positive importance for efficiency and reduces the pressure pulsation in an impeller. Meanwhile, the negative stacking lean angle is good for increasing the head and reducing axial force. Tao et al. (Citation2018) investigated the impeller eccentricity influences on the pressure pulsations and the axial and radial forces, indicating that eccentricity has an important effect on the operating stability and security of the main pump. However, only a few investigations have been carried out on the connection between an RCP and upstream structures and the distorted flow before the inlet of an RCP in the AP1000 system (Long et al., Citation2017; Wang et al., Citation2018). The studies found that a distorted inflow destroys the symmetry of the flow field and intensifies the pressure pulsation inside the pump.
In the view of previous research, the distorted inflow caused by a complicated upstream structure in the HPR1000 system has not been mentioned, and how the inflow distortion is generated is not clear enough. In the HPR1000 system, the upstream structures of the RCP are a Steam Generator (SG) and elbow pipe (Zhang et al., Citation2017; Zhao et al., Citation2018). Considering that, an RCP configuration with three different models is proposed in this study. The flow field, pressure field, and the impact of different inflow on the performance of the RCP are investigated in detail by CFD simulation. In particular, the distortion is presented in flow angles; axial velocity deficits and a vortex structure identified by a new Omega method are also presented in this work to depict the mechanism of flow distortion.
This work is organized as follows. In Section 2, the details of the simulation and experiments are presented. In Section 3, the distorted inflow parameters are raised and the based on that different inflow is discussed.
In Section 4, RCP performance with two inflow conditions are compared and transient characteristics in an impeller are analyzed, revealing that a distorted inflow damages pump performance. In Section 5, the conclusions are presented.
2. The numerical simulation method and experiment set-up
2.1. The model pump
Given the large size of the prototype pump and the high cost of the test using the prototype pump, models and test-stands with different scaling factors are commonly used (Cheng et al., Citation2016; Claus et al., Citation2005; Lu et al., Citation2017; Ni et al., Citation2017). Therefore, in this paper, a half-dimension scale model of an HPR1000 RCP was chosen, with the time cost required to build the computational domain and calculations reduced by approximately 30%. After similarity conversion, the nominal parameters for the model RCP are shown in Table .
Table 1. Nominal parameters for the scaled RCP.
For the present study, the hydraulic performance of the pump rather than the local leakage flow was the matter of concern, so the main flow passage components of the pump (impeller, diffuser, and pumping water chamber) and the relevant connected components (suction pipe, SG) were chosen, while the ring gap and cavity between the impeller and pumping chamber were ignored, as shown in Figure . Since the lower channel head is usually symmetric, the flow inside it could thus be assumed as symmetrical. In addition, there are thousands of small tubes for efficient heat transfer, so it was reasonable to simplify the geometry of the SG to a half channel head with some larger tubes. The high-quality hexahedral mesh was obtained through Ansys ICEM and the mesh was refined in the near-wall region to ensure the accuracy of the numerical simulation, as shown in Figure . The grid-independence of the results was checked. When the elements quantity was above 8.8 million, the change of the pump head with a long tube and the SG was lower than 1%; therefore the number of 8.8 million was taken, as indicated in Figure . The number of grids for each calculation domain is shown in Table .
Figure 1. Computational domains and the grid of main structures.
Note: a’: Partial enlargement of impeller grid; b’: Partial enlargement of diffuser grid
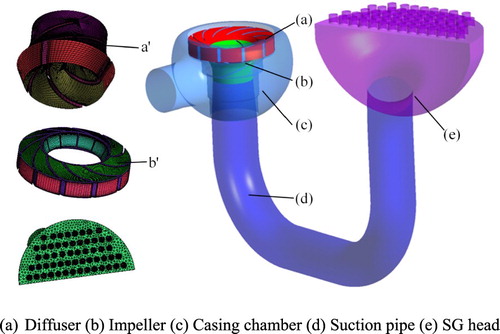
Figure 2. Partial enlargement of grid.
Notes: (a): Partial enlargement of impeller grid; (b) Partial enlargement of diffuser grid.
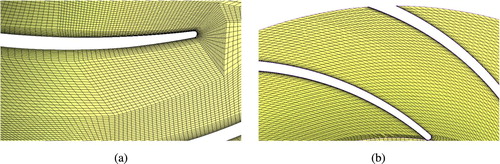
Figure 3. Grid independence verification.
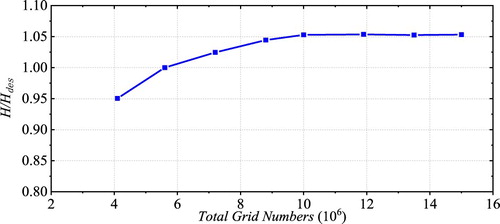
Table 2. Six regions with different mesh numbers.
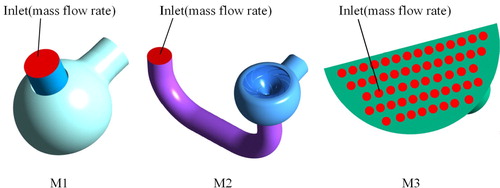
There were three kinds of models calculated separately, marked as: M1 (single pump coupling with short straight pipe); M2 (pump with coupling multi-elbow pipe); and M3 (pump coupling with multi-elbow pipe and SG), as displayed in Figure .
Figure 4. Inlet location of three structures.
First, the simulation of a steady condition was conducted by the RNG k-ε turbulence model to obtain an initial flow, with coupling between pressure and velocity established by the SIMPLEC scheme. In order to capture the transient vortex structure accurately, the delayed detached-eddy simulation (DDES) turbulence model (Spalart et al., Citation2006) was used for transient calculation, and therefore the dimensionless wall distance y+ around the blades was less than 60 and the distance between the first layer of mesh nodes and the wall surface was 0.08 mm. A bounded central differencing spatial discretization scheme was available for the momentum equations in the pressure-based solver. The second order implicit transient formulation was implemented to guarantee accuracy. Three different time steps Δt (1.683 × 10⁻⁴s, 3.367 × 10⁻⁴s, and 5.050 × 10⁻⁴s) were set to validate the time step independence in an unsteady simulation. Given the calculation cost and accuracy, the Δt of 3.367 × 10⁻⁴s was taken in the present work.
In the process of numerical calculation, the convergence of the calculation was judged by monitoring the change in total pressure at the pump outlet. When the monitored pressure remained constant or fluctuated within a small range, the flow field was considered to be stable and the calculation converged. The boundary conditions for simulation are shown in Table .
Table 3. Boundary conditions of simulation.
2.2. Experiment set-up
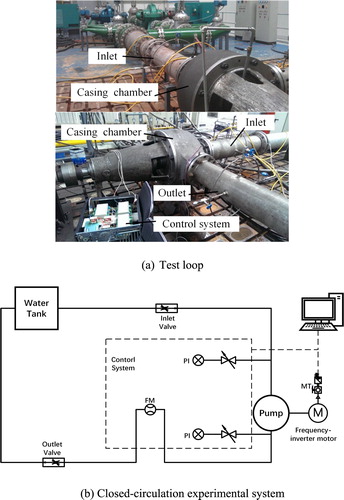
To verify the accuracy of the CFD numerical calculation, an experiment was performed using the scaled-down pump at the 0.6∼1.2 times nominal flow rate with the M1 structure. The hydraulic performance test device included the console, motor, closed water tank, model pump, control system, and valves. In the experiments the different flow conditions were achieved by adjusting the valve, and the flow rate was monitored by the electro-magnetic flow-meter (IFS4000 and DN400 with an error of 0.5%) of the pump outlet line. The pressure transmitter sensor (3051C with an error of 0.1%) was placed at the inlet and outlet to monitor the pressure to obtain the head of the RCP under different working conditions. Additionally, the impeller torque and speed were obtained by the torque speed sensor (JC with an error of 0.1%), as shown in Figure .
Figure 5. Experiment system.
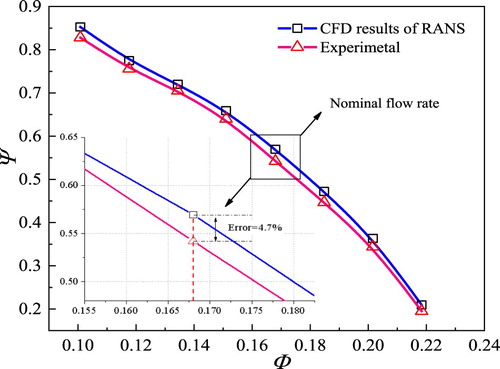
The CFD numerical results and experimental data are compared in Figure and it is found that the curves of simulation show a good tendency with the experimental results. At the nominal flow rate (Φ = 0.168), the experimental error is the smallest (0.8%), and the maximum experimental error is 1.2% in both the minimum and maximum flow conditions; the testbed also meets standards. At the nominal flow rate, the difference between the RANS model and the test is 4.7%, which is considered reliable for the engineering application. The deviation between simulation results and experimental data is attributed to numerical error and clearance leakage flow in the test.
Figure 6. Hydraulic performance comparison between simulation and experiment.
3. Analysis of the distorted flow field
In order to comprehend the inflow mechanism, the velocity fields under the distorted inflow are analyzed. The inlet boundary is set as the mass flow rate, as shown in Figure .
3.1. Evolution of the distorted flow field in the pipe
In general, increasing the length of the suction pipe has a certain effect on suppressing the distorted flow. However, considering the flow is superimposed by the disturbance of the SG head, the two elbows, and the inlet constriction, distortion becomes more complicated and irregular. Therefore, for such a distorted inflow, the control strategy should be placed on the structural connection instead of simply increasing length.
In order to illustrate the mechanism of the distorted inflow more intuitively, the normal velocity contour diagrams at different sections under two kinds of distorted inflow conditions (top: M2; Bottom: M3) are shown in Figure ; the left side of each section is the outer wall, and the right side is the inner wall, as shown in the blue dotted square; the vorticity distribution is shown in Figure .
Figure 7. 3D streamlines at RCP inlet pipe displaying the distribution of streamlines (M3) and normal velocity.
Note: Top (M2); Bottom (M3).
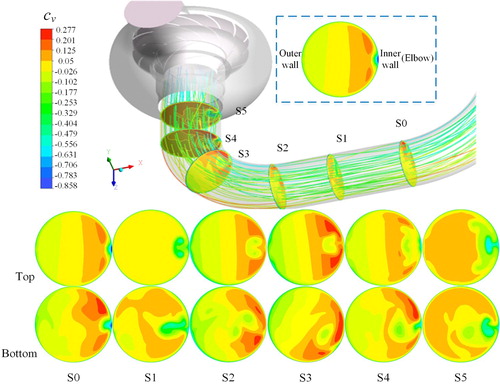
Figure 8. Vorticity distribution in six cross sections.
Note: Top (M2); Bottom (M3).
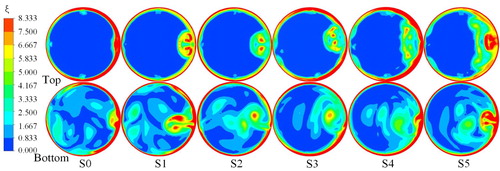
When the fluid passes through the elbow, a pair of symmetrical vortices of reverse motion, called Dean vortices, is generated due to centrifugal force and inertia. As shown in Figure , when the fluid passes through the first elbow, the flow is dominated by inertia and centrifugal force. As a result, the fluid is pressed by the outer wall. Hence, the fluid sticking to the outer wall flows along the wall surface separately. Meanwhile, the fluid near the inner wall is pushed by the pressure gradient, flowing towards the center. From Figure , it can be seen that the vorticity near the inner wall is larger than that of the outer wall, indicating that the shear flow is dominant there and that a secondary flow is initially formed. After the first elbow, there is a significant normal velocity gradient at S0. The main velocity defects region is near the inner wall where a low velocity region clings to it. Then, fluids pass through the straight pipe and reach S1. The normal velocity gradient disappears while the low velocity region at the inner wall expands, with an obvious Dean vortex formed (Figure ). Thereafter, as the fluid enters the second elbow at S2, the centrifugal force increases and the normal velocity stratification is more pronounced than S0, while the Dean vortex moves towards the center. At S3, the flow completely enters the elbow where the normal velocity gradient is maximized. As the velocity core region develops further, the fluid velocity is above the average velocity. At the same time, the movement of the Dean vortices gradually slow down, and eventually the vortex region is dissipated to four smaller vortices. Similar to S0, a low-speed region appears and sticks to the inner wall, with the dissipation of Dean vortices producing a new low-velocity region near the center of the pipeline at S4. Finally, the two low-speed regions are merged at S5 where the new Dean vortices emerge (S5 in Figure top).
In contrast to the above, the symmetry of the flow is destroyed, and the normal velocity distribution is disordered more clearly when the SG is coupled with the suction pipe. In other words, the inflow worsens compared with the design mention. Compared with M2, the area of the low velocity region near the inner wall in S0 becomes larger and the mirror symmetry of the velocity disappears due to the stochastic part from the SG; the vorticity distribution is not symmetrical, either. The original symmetrical Dean vortex in S1 is torn and elongated due to the pressure difference on both sides, and there is significant non-uniformity of the normal velocity gradient across the section. After that, the vortex is decomposed into two lower energy vortices, as the pressure on both inner wall sides changes suddenly at S2. Like M2, a low-velocity region is reproduced at the bottom of the inner wall of S4, and gradually develops into a pair of vortices in the shearing action of different velocity and pressure fluids at S5.
Inspired by the above analysis, the distorted inflow is formed due to the elbow and SG in M2 and M3, especially the long tube and the elbow-bend. Consequently, a distorted inflow will enter the impeller flow channel with the mainstream, ultimately affecting pump performance and stability.
3.2. Flow redistribution in the pump inlet section
For clearly describing the distortion before the impeller, three equidistant cross-sections in front of the impeller inlet are marked as L1, L2, and L3, and the diameters of circles C5 to C1 are 0.9, 0.8, 0.6, 0.4, and 0.2 times the diameter of the three cross-sections respectively, as shown in Figure . In this section, the velocity and flow angle data were qualified or plotted at the operating point of Φ = 0.168.
Figure 9. Location of three cross sections displaying the axial velocity contour before the fluid flows into channels(M3).
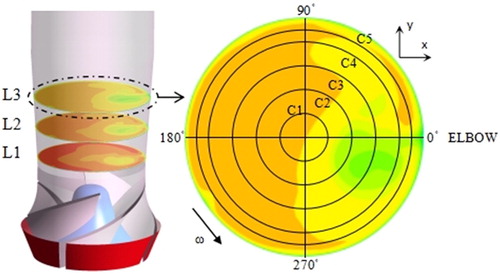
Figure shows the static pressure distribution over three sections. Obviously, there is a low-pressure region (the black dotted circle) near the elbow side, which is consistent with the above description of the secondary flow such as the Dean vortex in the pipe flow. From L3 to L1, it is apparent that the local low-pressure region moves towards inner wall, that the pressure intensity drops dramatically as the fluid is gradually sucked into the downstream channels, and that the partial pressure releases. Ultimately, the flow with the uneven pressure difference is indrawn to the impeller, so non-uniform pressure in the blade inlet is generated, as shown in Figure .
Figure 10. Contours of static pressure distribution in three cross sections.
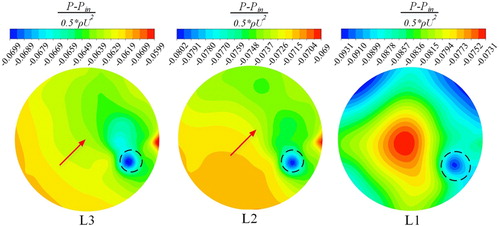
In addition, an obvious static pressure gradient along the red arrow indicates that the effect of the upstream elbow still exists at L3 and L2. As analyzed in Section 3.1, when the fluid passes through the elbow, the symmetrical two reverse swirl flows (shown in Figure ) meet and compress reciprocally at 0° of inner wall, where these flows interact strongly with the wall. Therefore, a small local high-pressure field is formed and clings to the wall constantly. Nevertheless, the pressure contour at L1 shows that in the flow process of L2 to L1, the pressure is influenced by the rotor rotation and the suction of each channel, thus the high pressure is released. Meanwhile, high pressure at L1 center is produced because of the extrusion between fluid and the hub bulge. Apparently, at L1, the pressure gradient from the center along the radial direction is obviously circumferentially non-uniform, adversely affecting the radial force of the rotor.
Figure 11. Contours of swirling angle in three cross sections.
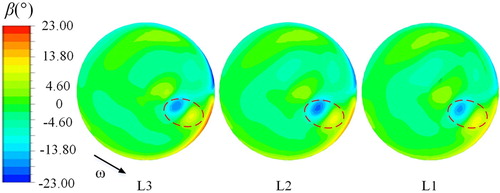
Figure shows the swirl angle distribution in three sections. As shown, on the side where the elbow is located, the fluid is pressed along the wall due to inertia and centrifugal force, generating regions with strong and obvious co-swirl and counter-swirl. When the pair of rotating flows meet, the radial jet shown in Figure , marked as Prs, brings the migrating fluid from the wall to the section center. However, in extract areas there is no similar jet, which is an essential factor that distributes the uneven flow inside the impeller.
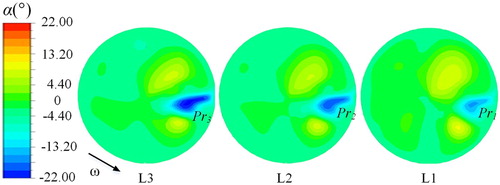
Figure 12. Contours of radial angle in three cross sections.
In addition, there is strong shearing effect in the red-dotted circle due to the oppositely turned swirling flow; the flow direction changes momentarily, thus an obvious vortex structure is formed in the impeller inlet. Because of the intensity of the swirl on this side, the main structure of the distortion occurs in the region between 315° and 45°. By comparing the swirl angle distributions at different sections, it is found that the closer to the impeller inlet, the weaker the strength and range of the counter-swirl flow as the influence of the impeller rotation increases.
As shown in Figure , the radial jet shows a weakening tendency as the counter-swirls are gradually weakened due to the effect of impeller rotation. In addition, two positive radial flows are distributed on both sides of Pr, which are driven by the pressure gradient. The area of radial flow of −7°−0° occupies the main part of the entire section and gradually increases because the flow is structurally constrained in the constricted inlet tube.
When the pump is coupled with the upstream structure, the inflow is distorted along the circumferential direction, especially in the magnitude and direction of the flow velocity. As a result, the counter pre-swirl occurs and the flow is accompanied with fluid migration centripetally. An intuitive reflection of the velocity defects is the axial velocity distribution along the circumference, shown in Figure . The distribution of axial velocity along the circumference at different radii is similar in each section. All circles have an area (270°−45°) where the velocity drops significantly and the axial velocity is much less than the design value. By contrast, the velocity through the extract area (45°−270°) is above the design value to compensate for the reduced mass flow rate mentioned. Comparing the circle of the minimum axial velocity in each section, the range and intensity of the low velocity region are gradually reduced as the flow approaches the impeller. Taking L2 as an example, by comparing the distribution of axial velocity at different radii, it can be clearly found that C3 axial velocity along the circumference (315°−360°) has the largest amplitude, and that C2 comes second, which also illustrates that the core area of inflow distortion is stable.
Figure 13. Circumferential distribution of axial velocity along five circles in different sections.
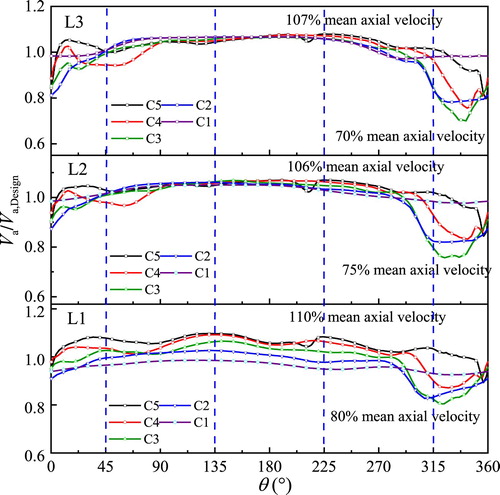
Under distorted inflow conditions, the inlet bulk flow no longer enters the impeller in the axial direction and the non-uniform pressure distribution, local pre-swirl, radial jet, and axial velocity defects normally increase a flow loss and generate uneven hydrodynamic forces.
3.3. Evolution of the inflow vortex structure
The Dean vortex enters the impeller flow channel and the flow state is changed compared with the uniform inflow (M1). In order to explain the influence of distortion on the flow state in the channel, the local region from the inlet to the outlet of the impeller was selected, with the variation of the vortex structure size and position investigated beginning with time t0.
The transient three-dimensional vortex structure in the channel was identified under a uniform inflow condition (M1) and a distorted inflow condition (M2/M3) by iso-surface with Omega value = 0.80 based on a new vortex identification method: the Omega method (Liu et al., Citation2016; Liu et al., Citation2019; Liu & Gao, Citation2018; Liu, Gao, et al., Citation2018; Tian et al., Citation2017).
In the Omega method, the vorticity is separated into two parts: the one representing the rotation is called the vortical vorticity; the other one for the shear is called the non-vortical vorticity. The vortex is defined using the R value: the ratio of the vortical vorticity to the whole vorticity. The definition of R is given as:
(1)
(1)
(2)
(2)
(3)
(3) where S represents the deformation tensor, Ω is the vorticity tensor, tr is the trace of the matrix, a and b stand for the squares of the norm of S and Ω. Then, R is approximately equal to
(4)
(4) where ε is set as a positive infinitesimal number in order to avoid the divide by zero.
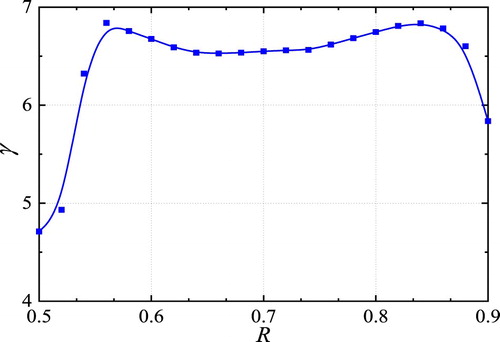
Figure shows that when the R value is 0.54–0.58 and 0.8–0.84, the visible vortex structure inside the impeller is more obvious than other values. Considering that the vortex structure is clearer when R = 0.80, thus R value 0.80 is taken.
Figure 14. Vortex iso-surface area coefficient in impeller with different R values (0 < R < 1).
It can be seen from Figure , under uniform inflow conditions (M1), that there are only small-scale disturbances caused by turbulent pulsation at the impeller inlet; moreover, these small-scale vortex groups are dissipated before entering the flow channel, so there is no significant vortex appearing in the impeller inlet, channel, and rotor-stator interface. However, in contrast to the small-scale vortex groups, there is a pair of vortices with higher energy and larger scale in the two channels of position C-U, which exists in the rotation period from beginning to end under distorted inflow conditions, as shown in Figures and . Besides, there is a difference in vortex distribution and scale outside the impeller channels, and the flow disturbance produced by the SG (streamlines in Figure ) is the main reason for this difference, considering there is the same elbow structure in M2 and M3.
Figure 15. Vortex distribution in impeller under a uniform inflow condition (M1) represented by the iso-surface with R = 0.80.
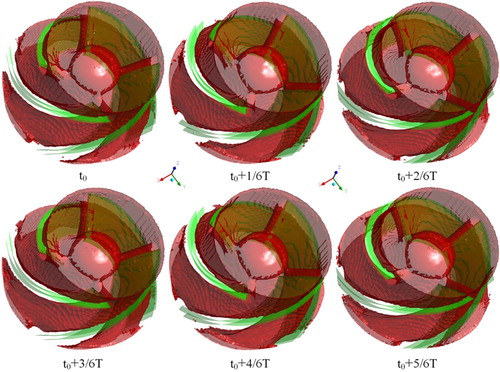
Figure 16. Vortex distribution in impeller under a distorted inflow condition (M2) represented by the iso-surface with R = 0.80.
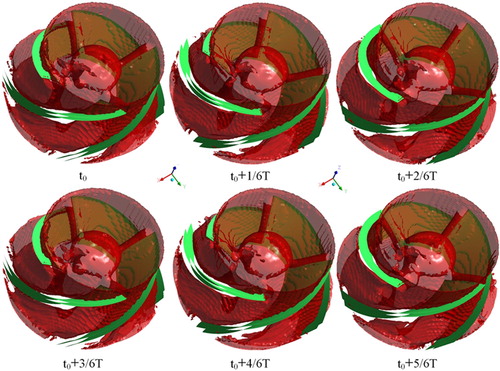
Figure 17. Vortex distribution in impeller under a distorted inflow condition (M3) represented by the iso-surface with R = 0.80.
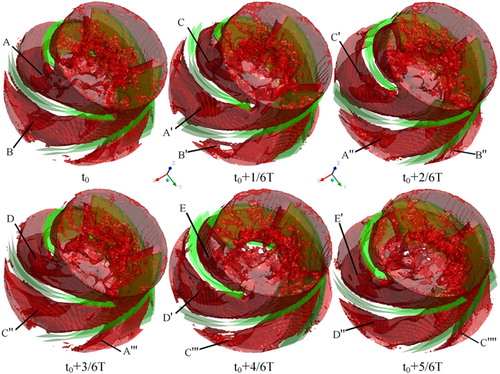
From Figure , the A vortex group consists of two parts at time t0; a part of the low energy vortex is connected with the small-scale vortex at the inlet. At the same time, the large-scale high-energy vortex has developed to the channel center attaching to the pressure surfaces of blade and hub, which blocks the flow path, damages the blade's acting ability, and also generates uneven blade load. Meanwhile, the B vortex group has been developed to the rear of the channel close to the rotor-stator interfaces. During the downstream development of the B vortex group, the vortex group is continuously torn and broken due to the rotation, thus a part of the broken vortex at the inlet merges with the small-scale vortex formed by the Dean vortex, generating a narrow vortex rope sticking to the pressure surface. At time t0+1/6 T, A’ is formed by the two parts of A, then it migrates downstream along the pressure surface and the hub surface, while the original position is taken up by the C vortex group. The position of the channel where B locates changes. As a result, the Dean vortex no longer enters this channel, and hence the B vortex group is not replenished and becomes an elongated wake vortex rope B'‘ after being fully extended at time t0+2/6 T. Similarly, the A vortex group eventually dissipates as a wake vortex rope.
Through comparison, it is found that a vortex structure with larger scale and range appears inside the impeller as a result of distorted inflow, which blocks the channels and reduces the working ability of blades. In a rotation period, there are similar vortex groups in the same position and their causes and the motion process are similar to those of the former vortex group. In other words, there are self-similarity and symmetry in a period. However, from the perspective of the impeller as a whole, the vortex structure generation and evolution processes are accompanied by strong non-uniformity and the vortex groups are mainly concentrated in the channel of position C-U, indicating that the distortion inflow disrupts the circumferential symmetry of the internal flow.
4. Results and discussion
4.1. Effect on the performance of the RCP with distorted inflow
Figure presents the performance characteristic curve of the RCP with both uniform inflow (M1) and distorted inflow (M2/M3). When the RCP is coupled with the SG head, both head and efficiency are significantly reduced compared with that of uniform inflow. The pump head decreased by 1.5% and the efficiency decreased by 1.3% in 0.7Qd. The head decreased by 4% and the efficiency decreased by 4.2% at the nominal flow rate, with a positive correlation between decrease ratio and the flow rate.
Figure 18. Simulation characteristic curve of RCP with both uniform and distorted inflow.
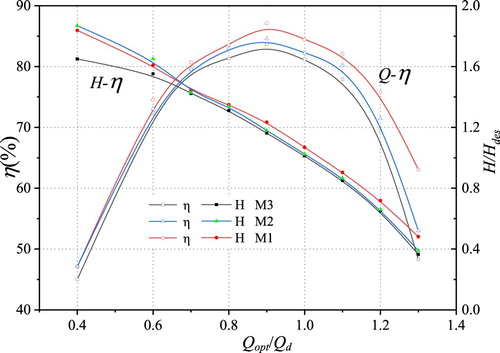
Corresponding to the previous explanation of the inlet distortion phenomenon and its mechanism, secondary flow phenomena, such as Dean vortices, are generated by the second elbow in the long tube, which results in a positive pre-swirl at the impeller inlet. Due to the existence of a positive pre-swirl, a certain amount of positive velocity circulation is produced at the impeller inlet, and the increase of circulation inevitably leads to the decline of pump head. Compared with the performance curve of M2 and M3, it can be seen that the long tube occupies the primary proportion of the causes of distortion. It was observed in the three-dimensional vortex structure that the steam generator added some disturbances to the mainstream where the secondary flow caused by the elbow dominates. As the flow rate increases, the flow velocity in the pipeline increases, and the secondary flow and flow separation get more serious. Furthermore, under the distortion condition, the direction and magnitude of the blade inlet velocity change. Therefore the flow angle is no longer equal to the blade placement angle, causing the flow separation of the blade surface and resulting in a large inlet hydraulic loss, which leads to the reduction of head and efficiency. Under the uniform inflow condition, the blade geometry in the pump is adapted well to the flow, and thus the flow at the impeller inlet is stable and flow separation is not obvious.
4.2. Effect on hydraulic characteristics of an impeller with distorted inflow
The pre-swirl also causes the fluid to migrate radially at the impeller inlet due to uneven pressure distribution and local pre-swirl. Moreover, according to Figure , the local velocity is lower than the design value and generates an ‘obstacle’ to flow, resulting in non-uniform distribution of mass flow in the impeller. At a fixed time, the four channel's positions are marked as position C-I, position C-U, position C-O, and position C-D respectively, as shown in Figure . Through observing the mass flow rate distribution in these positions, generally the difference of flow characteristics under different inflow conditions could be obtained. An analysis of the radial migration motion in the inlet cross-section has been made above. It has partly given the explanation for why the fluid enters other flow channels in the original flow channel from the original channel, and that migration and velocity decrease are the main results caused by the long tube.
As shown in Figure , the flow rate distributes symmetrically with uniform inflow and the maximum difference is less than 0.3% due to the symmetric velocity and pressure field in the impeller inlet. Compared with the uniform inflow, the flow rate in the channel which is located in position C-U and position C-I obviously decreases under two distorted inflow conditions, especially in position C-U. As can be seen from the figure, C-U is located in the low axial speed range of 315°−45°, so its mass flow is lower compared with other flow channels. The comparison shows that the flow distribution under M2 and M3 is highly similar, which indicates that the second elbow in the long tube has a dominant role in flow rate redistribution.
Figure 19. Mass flow rate distribution in flow channels.
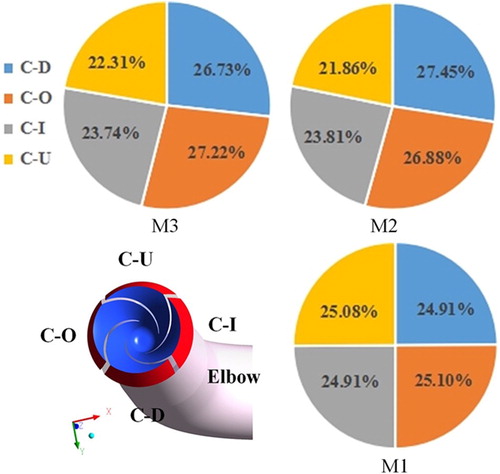
Figure shows the pressure contour of the blade inlet section in one revolution. For a uniform inflow condition, the blade pressure is uniformly distributed in the circumferential direction while the asymmetry of the pressure at the leading edge of the blade may increase the circumferential force with distorted inflow. Comparing the two distortion conditions, there are more scattered small vortex clusters at the blade inlet under the M3 structure, thus the area of the low-pressure area of the M3 structure is larger. Eventually, the uneven flow rate redistribution and pressure generates an uneven load on blades and increases the fluctuation of the impeller forces (Figures and ).
Figure 20. Pressure contour of unsteady flow in inlet section of blade in a revolution.
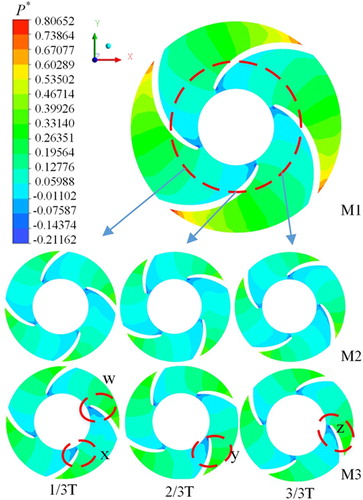
Figure 21. Axial force imposed on impeller changing with time in two revolutions.
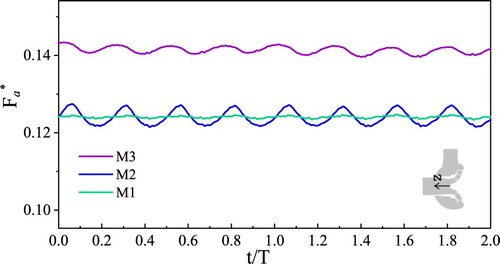
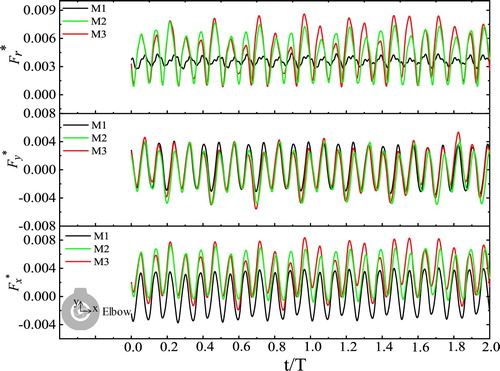
Figure 22. Radial force imposed on impeller changing with time in two revolutions.
4.3. Effect on the blade loads of the RCP with a distorted inflow
Influenced by the inlet distortion, the vortex, pressure gradient, and mass flow rate redistribution would eventually affect impeller load. From Figure , it can be seen that the distorted inflow (M2) has increased the axial force fluctuation amplitude by 10 times – 8 times with M3 – and therefore the axial force fluctuation of the impeller obviously increases. In addition, from the analysis of the inlet flow field, the inflow in M3 is more chaotic than that of M1/M2, and the impeller hub gets more of the impact of the radial jet and the disturbance caused by SG. Thus the average of the axial force of M3 is 1.15 times that of M1/M2, reducing pump stability and safety. In addition, radial force has more influences from a distorted inflow.
As Figure shows, for both distorted inflow conditions, the radial force increased by 1.3 and 1.4 times; its fluctuation peak value increased by 3.2 and 3.6 times compared with the uniform inflow, exacerbating shaft deformation. From Figure , it can be seen there is nearly no difference between Fy values, thus the Fx is the significant reason for the difference of Fr under different inflow conditions. The Fx is axisymmetric about the Y axis under a uniform inflow condition. However, under a distorted inflow condition (both M2 and M3), the vortex exists in the side where the elbow locates over the revolution. Therefore, the Fx points to the positive direction of X constantly and is not circumferentially distributed from the momentum and energy perspectives, considering the mass flow rate distribution in the impeller.
5. Conclusions and limitations
| 1. | In this paper, the influence of a distorted inflow on the hydraulic performance of a reactor coolant pump is studied using numerical simulations. The agreement of the experiment and numerical study illustrates that CFD numerical simulations in this paper could be used in performance predictions. The RCP coupling with the SG produces a distorted inflow at the pump inlet and then leads to an asymmetrical flow field inside the pump, which is inconsistent with the design expectation, thereby increasing the hydraulic loss and adversely worsening the performance of the RCP. In the numerical simulation, under the nominal flow rate condition, the head and efficiency of the pump with the channel head decreases by 4% and 4.2% compared with the uniform inflow. | ||||
| 2. | In impeller inlet cross sections, there is a clear pressure gradient effected by the elbow and the SG, the unexpected swirling flows driven by the pressure gradient appear, and radial flow jets are generated. As a result, the bulk axial velocity is lower than the design value in the 270°−45° area where the distortion takes a dominant place, and the mass flow rate is distributed unevenly in the channels. The pressure on the inlet region of the impeller channel is not circumferentially symmetrical with the distorted inflow. Meanwhile, the vortex structure generation and evolution processes are accompanied by strong non-uniformity in the impeller, and the main part of the vortex structure loses periodicity, which intensifies the pressure pulsation and increases the load of the impeller. | ||||
| 3. | The distorted inflow has an effect on the radial and axial force exerted on the impeller due to the asymmetrical pressure distribution, hence increasing the chance of the fatigue breakdown of the impeller. The direction of Fx relates to the location of the elbow, which is the main reason why the force load increases. | ||||
The introduction to an RCP with both uniform and distorted inflow makes it possible for further work to improve performance and stability. The results in this paper could emphasize the detrimental effect caused by inflow distortion and could be the reference for model parameter selection. The present study focuses mainly on the impact of distorted inflow. An accurate method for quantifying the distortion will be considered, the cavitations and vibration under distorted inflow condition investigated, and the optimization method explored in future work.
Disclosure statement
No potential conflict of interest was reported by the author(s).
Additional information
Funding
References
- Allen, M. E., Werth, D. E., & Allaben, C. C. (2014, June 1–5). Evaluation of reducing elbow characteristics versus velocity distribution at the pump inlet. American Society of Civil Engineers World Environmental and Water Resources Congress 2014, Portland, Oregon (pp.1207–1215).
- Bulten, N. W. H., & Esch, B. P. M. V. (2007). Fully transient CFD analyses of waterjet pumps. Marine Technology, 44(3), 185–193.
- Cheng, X. R., Bao, W. R., Fu, L., & Ye, X. T. (2016). Sensitivity analysis of nuclear main pump annular casing tongue blend. Advances in Mechanical Engineering, 9(7), 1–9. https://doi.org/10.1177/1687814017706599
- Cheng, X. R., Wang, P., & Zhang, S. Y. (2019). Investigation on matching characteristics of nuclear main pump guide vanes and annular casing. Journal of the Brazilian Society of Mechanical Sciences and Engineering, 41(9), 353. https://doi.org/10.1007/s40430-019-1854-0
- Claus, K., Sven, B., Jochen, F., & Michael, T. C. (2005, June 19–23). Design process for an advanced reactor coolant pump for a 1400 MW nuclear power plant. ASME 2005 fluids engineering division summer meeting.
- Ding, Z. M., Zhuge, W. L., & Zhang, Y. J. (2019). Zhang, assessment of turbine performance under swirling inflow conditions. Energy, 168(1), 492–504. https://doi.org/10.1016/j.energy.2018.11.110
- Duerr, P., & Von Ellenrieder, K. D. (2015). Scaling and numerical analysis of non-uniform waterjet pump inflows. IEEE Journal of Oceanic Engineering, 40(3), 701–709. https://doi.org/10.1109/JOE.2014.2339395
- Engeda, A., Kim, Y., Aungier, R., & Direnzi, G. (2003). The inlet flow structure of a centrifugal compressor stage and its influence on the compressor performance. Journal of Fluids Engineering, 125(5), 779–785. https://doi.org/10.1115/1.1601255
- Esch, B. P. M. V. (2009). Performance and radial loading of a mixed-flow pump under non-uniform suction flow. Journal of Fluids Engineering, 131(5). https://doi.org/10.1115/1.3089539
- Gan, H., & Gao, F. (2016). Non-dimensional analysis of the transient flow rate and the coolant temperature in a reactor coolant system under different pump failures. Journal of Nuclear Science and Technology, 53(12), 1–11. https://doi.org/10.1080/00223131.2016.1179136
- Gunn, E. J., & Hall, C. A. (2014, June 16). Aerodynamics of boundary layer ingesting fans. ASME Turbo Expo 2014: turbomachinery technical conference and exposition.
- Gunn, E. J., & Hall, C. A. (2017, June 26). Non-axisymmetric stator design for boundary layer ingesting fans. ASME Turbo Expo 2017: turbomachinery technical conference and exposition.
- Gunn, E. J., Tooze, S. E., Hall, A. H., & Colin, Y. (2013). An experimental study of loss sources in a fan operating with continuous inlet stagnation pressure distortion. Journal of Turbomachinery, 135(5), 051002. https://doi.org/10.1115/1.4007835
- Herrick, G. P. (2010). Effects of inlet distortion on aeromechanical stability of a forward-swept high-speed fan. AIAA paper, 69(59), 1–14. https://doi.org/10.2514/6.2010-6711
- Liu, C. Q., & Gao, Y. S. (2018). Rortex and comparison with eigenvalue-based vortex identification criteria. Physics of Fluids, 30(8), 085107. https://doi.org/10.1063/1.5040112 doi: 10.1063/1.5037430
- Liu, C. Q., Gao, Y. S., Tian, S. L., & Dong, X. R. (2018). Rortex a new vortex vector definition and vorticity tensor and vector decompositions. Physics of Fluids, 30(3), 035103. https://doi.org/10.1063/1.5023001
- Liu, M., Tan, L., & Cao, S. L. (2018). Influence of geometry of inlet guide vanes on pressure fluctuations of a centrifugal pump. Journal of Fluids Engineering, 140(9), 091204. https://doi.org/10.1115/1.4039714
- Liu, J. M., Wang, Y. Q., Gao, Y. S., & Liu, C. Q. (2019). Galilean invariance of omega vortex identification method. Journal of Hydrodynamics, 31(2), 249–255. https://doi.org/10.1007/s42241-019-0024-2
- Liu, C. Q., Wang, Y. Q., Yang, Y., & Duan, Z. W. (2016). New omega vortex identification method. Science China Physics, Mechanics & Astronomy, 59(8), 684711. https://doi.org/10.1007/s11433-016-0022-6
- Long, Y., Wang, D. Z., & Zhu, Y. L. (2017). Experimental investigation on the unsteady pressure pulsation of reactor coolant pumps with non-uniform inflow. Annals of Nuclear Energy, 110, 501–510. https://doi.org/10.1016/j.anucene.2017.07.010
- Long, Y., Zhu, R. S., & Wang, D. Z. (2016). Numerical and experimental investigation on the diffuser optimization of a reactor coolant pump with orthogonal test approach. Journal of Mechanical Science and Technology, 30(11), 4941–4948. https://doi.org/10.1007/s12206-016-1014-8
- Lu, Y. G., Zhu, R. S., & Wang, X. L. (2017). Study on gas-liquid two-phase all-characteristics of CAP1400 nuclear main pump. Nuclear Engineering and Design, 319, 140–148. https://doi.org/10.1016/j.nucengdes.2017.05.001
- Michelassi, V., Chen, L. W., Pichler, R., & Sandberg, R. D. (2015). Compressible direct numerical simulation of low-pressure turbines—part II: Effect of inflow disturbances. Journal of Turbomachinery, 137(7), 071005. https://doi.org/10.1115/1.4029126
- Mittag, S., & Gabi, M. (2015). Experimental and numerical investigation of centrifugal pumps with asymmetric inflow conditions. Journal of Thermal Science, 24(6), 516–525. https://doi.org/10.1007/s11630-015-0817-8
- Ni, D., Yang, M. G., Gao, B., & Zhang, N. (2017). Numerical study on the effect of the diffuser blade trailing edge profile on flow instability in a nuclear reactor coolant pump. Nuclear Engineering and Design, 322, 92–103. https://doi.org/10.1016/j.nucengdes.2017.06.042
- Spalart, P. R., Deck, S., Shur, M. L., Squires, K. D., Strelets, M. K., & Travin, A. (2006). A new version of detached-eddy simulation, resistant to ambiguous grid densities. Theoretical and Computational Fluid Dynamics, 20(3), 181–195. https://doi.org/10.1007/s00162-006-0015-0
- Sun, H., Li, J., & Feng, Z. (2012). Investigations on aerodynamic performance of turbine cascade at different flow conditions. Engineering Applications of Computational Fluid Mechanics, 6(2), 214–223. https://doi.org/10.1080/19942060.2012.11015416
- Tao, R., Xiao, R. F., & Liu, W. C. (2018). Investigation of the flow characteristics in a main nuclear power plant pump with eccentric impeller. Nuclear Engineering and Design, 327, 70–81. https://doi.org/10.1016/j.nucengdes.2017.11.040
- Tian, S. L., Gao, Y. S., Dong, X. R., & Liu, C. Q. (2017). A definitions of vortex vector and vortex. Journal of Fluid Mechanics, 849, 312–339. https://doi.org/10.1017/jfm.2018.406.
- Vagnoli, S., & Verstraete, T. (2015). Urans analysis of the effect of realistic inlet distortions on the stall inception of a centrifugal compressor. Computers & Fluids, 116, 192–204. https://doi.org/10.1016/j.compfluid.2015.03.015
- Wadia, A. R. (2011). Experimental investigation of a forward swept rotor in a multistage fan with inlet distortion. International Journal of Aerospace Engineering, 2011, 1–11. https://doi.org/10.1155/2011/941872
- Wang, Y. H., Wang, P. F., & Tan, X. H. (2018). Research on the non-uniform inflow characteristics of the canned nuclear coolant pump. Annals of Nuclear Energy, 115, 423–429. https://doi.org/10.1016/j.anucene.2018.02.007
- Zemp, A., Kammerer, A., & Abhari, R. S. (2010). Unsteady computational fluid dynamics investigation on inlet distortion in a centrifugal compressor. Journal of Turbomachinery, 132(3), 031015. https://doi.org/10.1115/1.3147104
- Zhang, F. Y., Wu, L., He, G. N., & Huang, W. (2017). R&D on ZH-65 steam generator of HPR1000. China Nuclear Power, 10(4), 494–498.
- Zhang, Y. C., Yang, M. G., Ni, D., Zhang, N., & Gao, B. (2018). Particle image velocimetry measurement of complex flow structures in the diffuser and spherical casing of a reactor coolant pump. Nuclear Engineering and Technology, 50(3), 368–378. https://doi.org/10.1016/j.net.2017.12.012
- Zhao, E. L., Li, P. Z., Peng, X. J., & Zhao, W. B. (2018). Integrated experiment research of new steam generator. Atomic Energy Science and Technology, 52(5), 868–874. https://doi.org/10.7538/yzk.2018.52.05.0868
- Zhou, F. M., & Wang, X. F. (2017). The effects of blade stacking lean angle to 1400 MW canned nuclear coolant pump hydraulic performance. Nuclear Engineering and Design, 325, 232–244. https://doi.org/10.1016/j.nucengdes.2017.09.024