
 ?Mathematical formulae have been encoded as MathML and are displayed in this HTML version using MathJax in order to improve their display. Uncheck the box to turn MathJax off. This feature requires Javascript. Click on a formula to zoom.
Abstract
The airflow cylinder sieve directly affects the harvesting effect as one of the main components of the rice combine harvester. The process of grain separated from threshed rice mixture is a multi-physical random pattern. This paper constructed accurately the components particle models, and reproduced the screening process of mixture via CFD-DEM (Computational Fluid Dynamics and Discrete Element Method). Objectives of this work are to better understand the impact of airflow velocity, aperture and deflectors of cylinder sieve on separation effect of the mixture in an airflow cylinder sieve device. The optimal working parameters of sieve were developed by the OED (Orthogonal Experiment Design) and the weight of the index method. The simulations result show that airflow velocity and aperture have an impact on the loss ratio and efficiency; deflectors have implications on efficiency. It is beneficial for separation of grain from the mixture with the airflow velocity, the aperture and deflectors are of 11m/s, 11mm, and two turns, correspondingly. The experiments result carried out on the test bench with real threshed rice mixture and agree with simulations, which proved the feasibility of the results. This paper provided basic data for the design of screening unite of rice harvester’s equipment.
1 Introduction
Cereal harvesting includes cutting, threshing, cleaning, collection and transportation, and so on. Efficiency, loss ratio and clean ratio are important evaluation indicators for the performance of a cleaning device, especially in process conditions of rice or wheat. The plan vibrating screen device is widely used in most of large combine harvester, yet which has more weight and volume as well as significant vibration, and not suitable for the muddy fields or small hill field in China. Cylinder sieve is a rotary cylinder structure that it has the characteristics of relatively simple construction, lightweight, less vibration, easier to operate and lower energy consumption compared to other separation systems, and widely using in bulk material screening and grading operations. In engineering field, cylinder sieve was used to classify of Victoria's veinstone to extract gold from finer ore in the 1890s (Rosales, Citation1896); Walker et al. (Citation2008) applied trommel to collect municipal solid waste from the city of Chicago for a soil amendment, which improves soil structure and conducive to crop growth; Nati et al. (Citation2015) designed a cylinder sieve to grading hog fuel which processed from two comminution devices. In agricultural domain, Bellocq, Ruiz, Delaplace, Duri & Cuq (Citation2017) researched size separation of durum wheat semolina by the rotating screen drum; Li et al. (Citation2018) and Wan et al. (Citation2018) come up with a roll-twist cylinder sieve type of millet cleaning device and a kind of cylinder sieve with promoting equipment for improve the separation effect of threshed grain and threshed rape, correspondingly. Cylinder sieve had been a primarily explored domain, however, too little work has been devoted to the theory of particle screening permeability. Screening theory and influencing factors were explored, Cheng (Citation1988) researched the mixture blockage problem during the screening process of bulk materials; Apostu et al. (Citation2015) discussed the effect of the shaft section angle and rotor speed on the efficiency of screening for three types of sand; Siberian scholar Sabashkin et al. (Citation2017) invented a cylinder sieve with screw dispenser for grain pre-cleaning, meanwhile discussed the effect of rotating speed and pore size on screening result of mixture; Ivanov et al. (Citation2017) from the same team developed a mathematical model of the motion of grain particles for studying the relationship between feed rate and cylinder sieve rotation speed. Most of them have studied the theory of particle screening and the working performance of the cylinder sieve through experimental methods or mathematical model. However, lack of the study about microscopic motion behavior of bulk materials in the cylinder sieve existed as a problem for many years.
There are many screening mechanisms unclear and less research on the optimal working parameters of the cylinder screening device. China possesses vast territory and complex planting conditions, especially a lot of muddy fields and small hill fields, so that the field harvesting experiments have depended on seasonal and higher costs. In engineering research, the past decade has seen a rapid development of CFD (Farzaneh-Gord et al., Citation2019; Ghalandari et al., Citation2019; Mosavi et al., Citation2019). Meanwhile, Discrete Element Method (DEM) has a significant impact on the research of processing of agricultural bulk materials (Li, Qian, et al., Citation2017; Ma et al., Citation2015). Research methods is the leading cause of restricting the development of complex multiphase flow problems. The method of CFD-DEM coupling method which included key components and their interactions flow field models for the motion of the particles was recognized by many scholars and many works of literature focused on transport, grading, settlement, and motion of particle in the fluidized bed by CFD-DEM (Akhshik et al., Citation2016; Blais & Bertrand, Citation2017; Bravo-Blanco et al., Citation2017; Gupta & Ooi, Citation2016; Sinnott et al., Citation2017). At the same time, the method is also applied to the study of agricultural bulk material processing. Liu et al. (Citation2015) and Jiang et al. (Citation2014) analyzed the law of change for resistance in the middle layer during drying process of two varieties of grain and obtained mixture moving laws in inertia separation unit of combine harvester, respectively, via CFD-DEM; Xiao et al. (Citation2018) simulated motion of threshed rice in a cylinder sieve under the impact of airflow by mean of CFD-DEM, that it did not involve analysis of more influencing factors and the optimal working parameters of the cylinder sieve. The numerical method of CFD-DEM coupling provides new insights into the problem of complex agriculture process conditions of particles.
In summary, the optimal parameter for airflow cylinder sieve device that can improve screening achievements and save on field trial costs should be investigated. In the previous work (Yuan et al., Citation2018c), the impact of airflow velocity, rotating speed and diameter on the motion rules and grading effect of threshed rice mixture in an airflow cylinder sieve were analyzed. While, there are no optimal operating parameters of the screening device. The purpose in this paper is to better understand the movement law and microscopic phenomena of the mixture components during the screening process, meanwhile explore the best operating parameters of this cylinder screening device via a CFD-DEM method, OED and weight of index method.
2. Materials and methods
2.1 Introduction to simulation methods
In the heretofore work, the basic principles and mathematic formulas of the CFD-DEM coupling method were presented (Yuan et al., Citation2018c). The air density (∼1.29 Kg/m3 in case of standard atmospheric pressure) is much smaller than the density of each component of the mixture (300 ∼ 1300Kg/m3) so that this case consider only drag and pressure gradient forces. Particle phase is treated as a mass and momentum source of the airflow phase. When the airflow phase momentum equation is processed, the reaction forces of the drag forces received by all the particles in a specific Euler grid are summed up and assigned as source terms. The coupling method can be described as the following process. Primarily, the calculated results of the airflow in the FLUENT software, after the situation converges, is delivered to the interface of coupling. These results of interaction forces are transferred to the EDEM software (Hertz-Mindlin no-slip model) that solves the motion of the particles. Next, the data of positions and velocity of a new particle are returned to the coupling interface and update particle information at the same time. Finally, the data result calculated above are transferred to the FLUENT solver and prepare for the next calculation. The Eulerian-Eulerian model is chosen in the FLUENT software (Navier-Stokes equations). The motion of dispersed particles was addressed by time integration method in the EDEM software.
2.2 Weight of the index method
The effect of multi-factors on the screening results was analyzed by the weight of the index method (Wei & Zhao, Citation2010). A model of three layers’ structure was constructed (Table ). Assuming that the l represents the number of factors in the orthogonal simulations and the m represents the levels which each factor has. Where represents the average value of i-th (Ai) factor with j-th level.
is the Range of the factor
. If it needs the maximum index value, then assume
. Otherwise, assume
.
is the factor weight. The matrix formulas are shown below:
(1)
(1)
(2)
(2)
(3)
(3)
(4)
(4)
(5)
(5)
(6)
(6)
(7)
(7)
Table 1. Data structure.
2.3 Cylinder sieve 3-D model
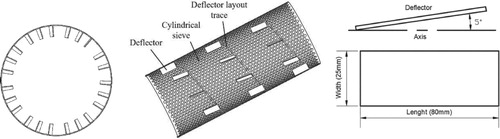
According to the particle screening permeability and the size of threshed rice components, the aperture spacing, length, and diameter of cylinder sieve are 3, 700, and 300 mm, respectively. The eight deflectors evenly installed along a counter-clockwise spiral line with each circle. Diagram of the cylinder sieve shown in Figure .
Figure 1. Diagram of cylinder sieve.
2.4 Particle models of threshed rice components
The particle models of threshed rice components were obtained by API multi-spheres polymerization auto-filling in EDEM software (Yuan, Wu, Li, et al., Citation2018) that shown in Figure . Firstly, the 3-D point cloud of grain was got by a laser scanner (Li, Wang, et al., Citation2017). Then, the 3-D model of grain was meshed in the ANSYS workbench software and got the coordinate of grids by the UDF (User Defined Function) in FLUENT software. Ultimate, grain particle model was generated by the API (Application Programming Interface) in EDEM software. In the particle modelling process of multi-ball automatic filling, the number of meshes of the 3-D model is consistent with the number of filling spheres. The more meshes, the more accurate the particle model and the more computationally difficult it is. The number of spheres of grain, shriveled grain, and short stalks are 664, 436, and 30, respectively (Figure ). The error of size for the particle model is below 5% compared with the actual sample (Table ), which are acceptable for simulation.
Figure 2. Grain particle modelling process.
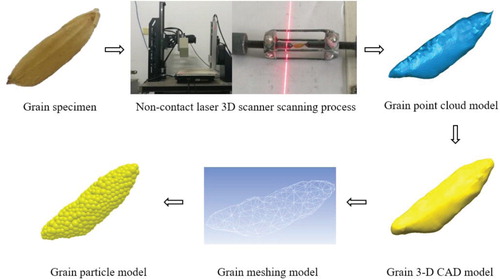
Figure 3. Particle models of threshed rice components. (a) Particle model of grain, (b) Particle model of shriveled grain, (c) Particle model of short stalk.
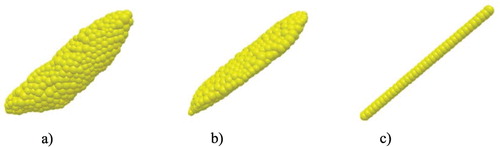
Table 2. Comparison of particle model and actual sample.
2.5 Simulation configuration
The threshed rice, Wu chang dao hua xiang variety, is selected as sample, with the moisture content of grain, shriveled grain, short stalks and impurities at harvesting are about of 16.9%, 17.6%, 48% and 17.8%, correspondingly. The thousand weight of components are 22.3, 5.6, 38.4 and 5.2 g, correspondingly. The mass percentage are 89.77%, 6.37%, 1.61% and 2.25%, respectively (The impurities is replaced using shriveled grain, due to the mass of impurities be similar to shriveled grain, as shown in Figure ). In the simulations, the feed mass of grain, shriveled grain, and short stalk are 450, 43, and 8 g/s, respectively, which feeding amount for micro-small grain combine harvester (Yang, Citation2011). For getting accurate calculations results of particles motion, the time step of the EDEM is generally much smaller than the time step of the CFD due to the particles do not move a considerable distance in a single EDEM time step. Usually, the ratio of the EDEM time step to the CFD time step is about 1:100. The FLUENT and EDEM software time step are set at 0.035 and 0.00035 s, respectively (Hu, 2010). Meanwhile, the inner surface of the cylinder sieve is set as the boundary of the airflow field; the end face of the cylinder sieve on the feeding side is set as the airflow inlet; the opposite end face is set as the airflow outlet in FLUENT software. The grain, shriveled grain, and short stalks are dyed yellow, green and blue, correspondingly. The simulation model is shown in Figure . The coupled simulation run of 5 s, which took about 40 days running on a computing service station with a CPU of 64-core 3.4 GHz Intel, RAM of 64 GB. The physical characteristics of components are obtained by experimental measurements (Li et al., Citation2014; Yuan et al. Citation2018b) (as shown in Tables and ).
Figure 4. The components of Wu chang dao hua xiang variety. (a) Grain, (b) Shriveled grain, (c) Short stalks, (d) Impurities.
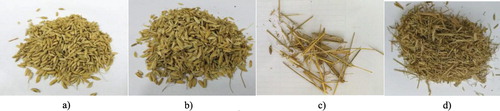
Figure 5. Diagram of the simulation model.
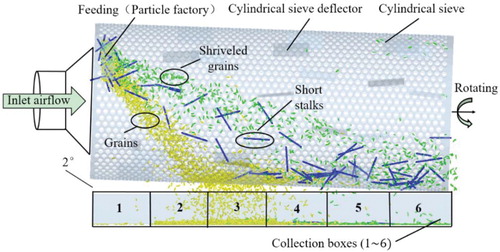
Table 3. The physical characteristics of the components.
Table 4. Contact physical properties between components.
2.6 Simulations scheme design
2.6.1 Single-factor simulations design
The purpose of this work for understanding the effect of each factor on efficiency, loss ratio and clean ratio, so that a single factor simulations scheme was determined based on the actual data of rice harvesting. Grain easily moved out of the screening unit when the airflow velocity be 10.5 m/s (Deng & Gao, Citation2006). Therefore, the airflow velocity was determined to be from 9 to 11 m/s, as shown in Table .
Table 5. Simulations scheme of single-factor.
2.6.2 Orthogonal simulations design
To explore the optimal working parameters of the airflow cylinder screening device, this study should design a full factorial simulation included three factors and three levels for each factor, however, it will take a large of time to do a full factorial simulation with the number of simulations be of 33=27. Orthogonal experimental design (ODE) can use fewer situations to represent the overall situation by selecting points that are evenly distributed within the test range. In this work, a L9 (34) simulations scheme that with the airflow velocity, aperture and deflectors of cylinder sieve as factors, furthermore, clean ratio, loss ratio, and efficiency as evaluation indicators were designed. According to the single-factor simulations results, the values of factors and results shown in Table .
Table 6. Orthogonal simulations results.
2.7 Verification experiment
The verification experiments were lunched with 1 Kg actual threshed rice that the percentage of the components were the same as simulations by the test bench of airflow cylinder screening device (Figure ). The experimental process can be described as a few processes. (1) Set the rotating speed of cylinder sieve, airflow velocity and the speed of the conveyor belt. (2) Launch the fan, conveyor belt and motor. (3) Turn off the power of all equipment after the mixture enters the cylinder sieve ultimately. The efficiency P, clean ratio C, and loss ratio L were calculated using Equations (8–10):
(8)
(8)
(9)
(9)
(10)
(10)
Figure 6. Test bench of cylinder screening device.
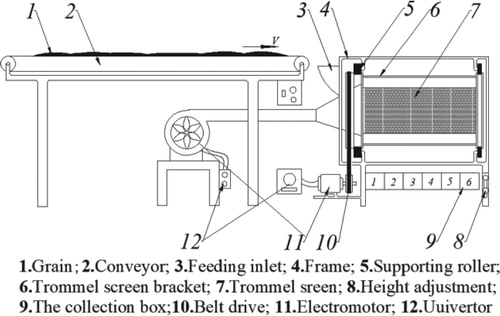
where, Wg, Wgt, Wgl and Wl are total grain mass, grain mass in the sieve, grain mass in the collection boxes and mixture mass in the collection boxes, respectively, (Kg).
3 Results and discussion
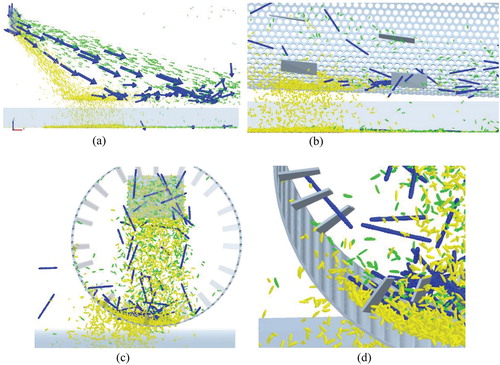
3.1 Screening simulation process
The results that one of the simulations with cylinder sieve aperture of 9 mm, airflow velocity of 9 m/s and deflectors of three turn were called into question. Screening process described in the following process: the mixture producing in the ‘Particle factory' occurs stratification under the impact of gravity and airflow, then flows along on the surface of axial direction. The grain contact the sieve surface dropped in the sieve hole, and some short stalks and shriveled grain to move out of the sieve under the impact of the airflow (Figure (a,b)). Simulation time increases, the particles number of mixture increases. The mixture is raised to a certain height along the sieve surface of circumferential direction, then falls to the bottom of the sieve surface under the action of friction, centrifugal force and gravity. The area of contact grain with the sieve surface and mixture increases, and promoted separation of grain from mixture (Figure (c)). Under the impact of the deflectors, the mixture is beaten and splashed, meanwhile, brought to secondary separation under the action of airflow (Figure (d)). The deflectors is to reduce the accumulation of mixtures, and lead to secondary separation of the mixture under the action of airflow.
Figure 7. Simulation of separation of the mixture in an airflow cylinder sieve (a) Mixture screening vector (b) Mixture screening schematic, (c) Axial screening diagram, (d) Diagram of the deflectors impact.
3.2 Results of verification experiments
The scheme with airflow velocity, aperture, and the deflectors be of 9 m/s, 9 mm and three turns were selected accordingly for verification experiments. Experiments were conducted with actual threshed rice in light of the method provided in Chapter 2.7. As shown in Table , comparing the experimental results with the simulations results, the error of clean ratio within 5% in each collection box and the errors of the loss ratio and efficiency are 9.89% and 2.67%, respectively. The cardinal number of the loss ratio is small so that the slight change in the value will reflect the more significant error value, which lead the experimental value of the loss ratio is more than the simulations. Verification experiments results are consistent with simulations results. The results can be proved that the CFD-DEM coupling method is acceptable.
Table 7. Experimental results and comparative analysis.
3.3 Results of single factor simulations
Airflow velocity
Figure shows the nonlinearly fitted curve of simulation results. The axial velocity of the shriveled grain is small, and some of the shriveled grain goes through the sieve under the collision of the others components which leads to low clean ratio with the airflow velocity be of 8 m/s (Figure ). When the airflow velocity increases, more shriveled grain and short stalks are moved out of the screening unit and more grain flow along the cylinder sieve surface, which brings the efficiency and clean ratio increases. When the airflow velocity is large, some of the grain motion out of the screening unit, which can cause screening loss. The loss ratio is 0.59% with airflow velocity be of 8 m/s. Meanwhile, the highest clean ratio and efficiency are achieved when the airflow velocity is 11 m/s, which will be 99.79% and 83.5%, respectively.
| (2) | Cylinder sieve aperture | ||||
Figure 8. Airflow velocity 8 m/s.
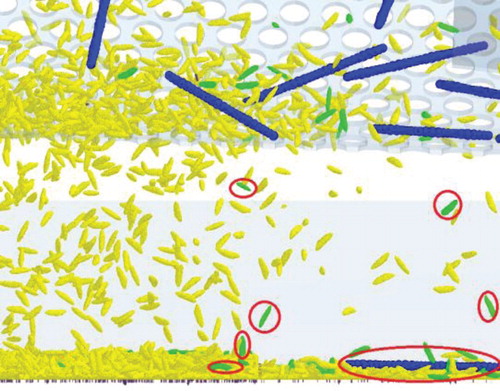
Figure 9. The effect of airflow velocity.
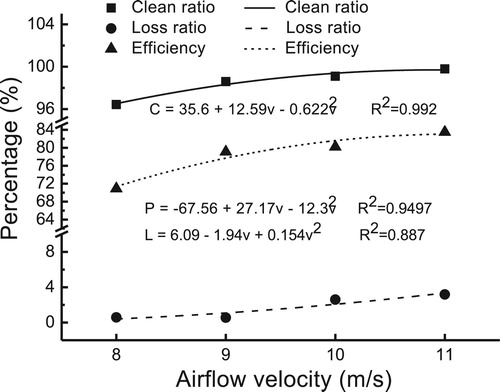
Figure shown the nonlinear fitting curve of the simulation results. Aperture allows smaller particles to pass through during cylinder sieve rotating when the mixture contact with the sieve surface. Under the premise of the changeless surface area of the cylinder sieve, the larger of the aperture, the larger of the active screening area. At the same time, whether the grain smooth to permeable is related to the posture of particles through the sieve hole. With cylinder sieve aperture increases, the efficiency increase, conversely, the clean ratio and loss ratio decrease. Shriveled grain secure going through the sieve with a large aperture (Figure ), and proper range of cylinder sieve aperture facilitates separation of the mixture. When the cylinder sieve aperture is 8 mm, the clean ratio is as high as 99.59%, meanwhile, the mixture is prone to clogging, resulting in a decrease of efficiency. When the cylinder sieve aperture is 11 mm, the maximum efficiency and minimum loss ratio are 83.5% and 0.23%, respectively.
| (3) | Cylinder sieve deflector | ||||
Figure 10. Cylinder sieve aperture 11 mm
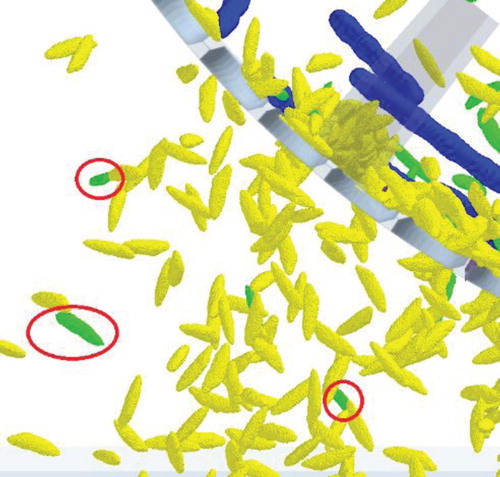
Figure 11. The effect of cylinder sieve aperture.
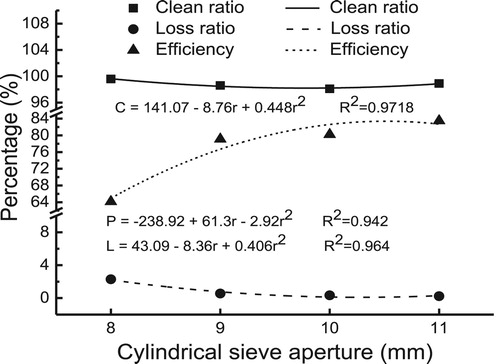
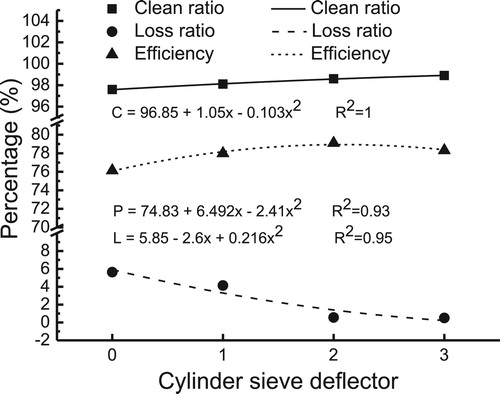
Figure shows that the nonlinear fitting curve results of the simulations. The deflector has two functions: one is to make the mixture flow consistent along the axial of the cylinder sieve making full use of the cylinder sieve holes; the other is to push the mixture to distribute consistent in the direction of rotation of sieve, to break up the mixture causing secondary separation and increase the impact of the airflow field (Figure ). As the deflectors increase the clean ratio increases, yet the loss ratio decreases, and in particular, the efficiency first increases and then decreases. The maximum clean ratio and minimum loss ratio are 98.9% and 0.23%, respectively, when the deflectors of three turn installed on the cylinder sieve. The maximum efficiency is 79.1% when two turns deflectors installed on the cylinder sieve.
Figure 12. Diagram of diversion.
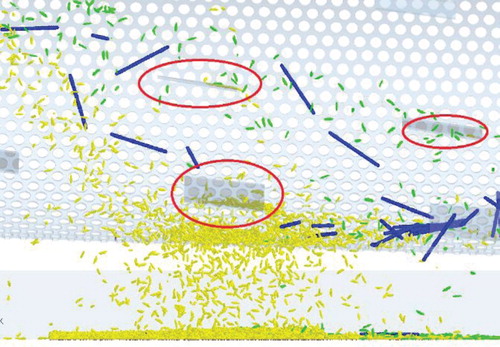
Figure 13. The effect of cylinder sieve.deflector.
3.4 Analysis of orthogonal simulations result
ANOVA is used to assess the relative importance of each factor relative to the overall response. The orthogonal simulation results were analyzed with the ANOVA, which obtains the results shown in Tables –.
Factors A, B and C with the P-value of 0.251, 0.487 and 0.786, respectively, which have a relatively insignificant effect on the change of clean ratio, due to significant differences in mass between ingredients. There are a great separated effect of the mixture under the impact of the airflow field (Table ).
Factor A with a P-value of 0.093 has a significant general impact on the change of loss ratio. Factor B with a P-value of 0.041 has a significant effect on the change of loss ratio. Factor C with a P-value of 0.331 has an insignificant impact on the loss ratio. The cylinder sieve aperture has a more significant effect on the loss ratio (Table ).
Factor A and B with the P-value of 0.005 and 0.008, respectively, which have a highly significant effect on the change of efficiency; the P-value of factor C is 0.04, which has a significant effect on the efficiency. The airflow velocity has a significant effect on efficiency (Table ).
Table 8. ANOVA for the clean ratio.
Table 9. ANOVA for loss ratio.
Table 10. ANOVA for efficiency.
3.5 Analysis of optimal working parameter
The weight of each index was obtained by means of the methods and formulas (Equations (1–7)) of Chapter 2.2. Best screening effect needs to get the maximal clean ratio and efficiency as well as minimal loss ratio. Getting the following results:
(11)
(11)
(12)
(12)
(13)
(13)
The average weight of each index is obtained using the following results:
(14)
(14)
(15)
(15) With the above calculation results, the optimal scheme is A3B3C2, specifically, the airflow velocity at 11 m/s, cylinder sieve aperture at 11 mm and cylinder deflectors at two turns. According to the results of the simulation that the clean ratio, loss ratio and efficiency are 98.88%, 1.45%, and 87.72%, respectively. This result provides reliable parameters for the optimization of the screening unit for the rice combine harvester
4 Conclusion
A predictive model (CFD-DEM) of coupling flow and particles was utilized to calculate the process of grain separation from threshed rice mixture in an airflow cylinder sieve device. Meanwhile, the best parameters of this device were obtained via the OED method and the weight of the index method. Specific observations are as follows: (1) The airflow velocity has highly significant effect on the change of efficiency, in addition, the changing trend of the efficiency and clean ratio are consistent with it; the cylinder sieve aperture has significant general effect on the change of loss ratio and highly significant effect on the change of efficiency, as same time the efficiency increase, as well as clean ratio and the loss ratio decline conversely with it increase; the cylinder sieve deflectors have a significant effects on efficiency. Meanwhile the clean ratio increase and the loss ratio decrease and in particular the efficiency first increases and then decreases with it increase. (2) The best screening effect is that the clean ratio, loss ratio and efficiency are 98.88%, 1.45% and 87.72%, correspondingly, with the airflow velocity be of 11 m/s, the cylinder sieve aperture be of 11 mm and deflectors of two turns.
The validated CFD-DEM model can be employed to simulate the processing of agricultural/industrial bulk materials (i.e. water treatment, mineral building, seed grading and so on). The results of this work provides reference data for the design of the airflow cylinder screening unit of the rice combine harvester. In this work, it is not possible to simulate screening conditions with large feed mass (≥5 Kg/s) owing to the limitations of computer hardware. Also, the simulation results cannot be completely consistent with the actual experiments due to the larger individual differences of agricultural materials. In future research, more accurate simulation methods should be studied (i.e. SPH-DEM, Smoothed Particle Hydrodynamics and Discrete Element Method), among other things, the high-speed camera or more precise experimental equipment should be used to observe and analyze the motion of threshed rice mixture.
Disclosure statement
No potential conflict of interest was reported by the author(s).
Additional information
Funding
References
- Akhshik, S., Behzad, M., & Rajabi, M. (2016). CFD-DEM simulation of the hole cleaning process in a deviated well drilling: The effects of particle shape. Particuology, 25, 72–82. https://doi.org/10.1016/j.partic.2015.02.008
- Apostu, E. D., Pop, M. A., & Monescu, V. (2015). Influence of Functional and construction parameters over sieving process-rotary cylindrical sieve. Advanced Materials Research, 1128, 353–363. https://doi.org/10.4028/www.scientific.net/AMR.1128.353
- Bellocq B., Ruiz T., Delaplace G., Duri A., Cuq B. (2017). Screening efficiency and rolling effects of a rotating screen drum used to process wet soft agglomerates. Journal of Food Engineering 195:235-246. doi: 10.1016/j.jfoodeng.2016.09.023
- Blais, B., & Bertrand, F. (2017). CFD-DEM investigation of viscous solid–liquid mixing: Impact of particle properties and mixer characteristics. Chemical Engineering Research and Design, 118, 270–285. https://doi.org/10.1016/j.cherd.2016.12.018
- Bravo-Blanco, A., Sánchez-Medina, A., & Ayuga, F. (2017). Analysis of the incipient motion of spherical particles in an open channel bed, using a coupled computational fluid dynamics–discrete element method model. Biosystems Engineering, 155, 68–76. https://doi.org/10.1016/j.biosystemseng.2016.12.003
- Cheng, J.Y. (1988). Discussion on screening efficiency and hole blocking problem of circular vibrating screen. Mining Machinery Journal, 4(2), 58–61. https://doi.org/CNKI:SUN:KSJX.0.1988-02-016.
- Deng, C.X, Tao, D.C, & Gao, J.P. (2006). Dynamic characteristics and factors affecting performance of air-stream cleaning windmill. Transactions of the Chinese Society of Agricultural Engineering, 2(4), 121–125. https://doi.org/CNKI:SUN:NYGU.0.2006-04-025.
- Farzaneh-Gord, M., Faramarzi, M., Ahmadi, M. H., Sadi, M., Shamshirband, S., Mosavi, A., & Chau, K.-w. (2019). Numerical simulation of pressure pulsation effects of a snubber in a CNG station for increasing measurement accuracy. Engineering Applications of Computational Fluid Mechanics, 13(1), 642–663. https://doi.org/10.1080/19942060.2019.1624197
- Ghalandari, M., Bornassi, S., Shamshirband, S., Mosavi, A., & Chau, K. W. (2019). Investigation of submerged structures’ flexibility on sloshing frequency using a boundary element method and finite element analysis. Engineering Applications of Computational Fluid Mechanics, 13(1), 519–528. https://doi.org/10.1080/19942060.2019.1619197
- Gupta, P, Sun, J, & Ooi, J Y. (2016). DEM-CFD simulation of a dense fluidized bed: Wall boundary and particle size effects. Powder Technology, 293, 37–47. https://doi.org/10.1016/j.powtec.2015.11.050.
- Ivanov, N. M., Fedorenko, I. Y. A., Zakharov, S. E., & Sukhoparov, A. A. (2017). Evaluating grain feed at Seeparation by Planetary Cylindrical sieve with Round holes. Siberian Herald of Agricultural Science, 47(47), 72–79. https://doi.org/10.26898/0370-8799-2017-5-9
- Jiang, E.C, Sun, Z.F, Pan, Z.X, & Wang, L.J. (2014). Numerical simulation based on CFD-DEM and experiment of grain moving laws in inertia separation Chamber. Transactions of the Chinese Society for Agricultural Machinery, (4), 117–122. https://doi.org/10.6041/j.issn.1000-1298.2014.04.018.
- Li, H.C, Gao, F, Li, Y.M, & Yan, J.C. (2014). Determination of rice grain physical properties. Journal of Agricultural Mechanization Research, (3), 23–27. https://doi.org/10.3969/j.issn.1003-188X.2014.03.005.
- Li, X.P, Meng, Y.J, Zhang, J.L, Geng, L.X, & Ji, J.T. (2018). Design and test of cleaning device for Roller Rubbing cylinder sieve of millet. Transactions of the Chinese Society for Agricultural Machinery, 49(10), 92–102. https://doi.org/CNKI:SUN:NYJX.0.2018-10-011.
- Li, H, Qian, Y, Cao, P, Yin, W.Q, Dai, F, Hu, F, & Yan, Z.J. (2017). Calculation method of surface shape feature of rice seed based on point cloud. Computers and Electronics in Agriculture, 142, 416–423. https://doi.org/10.1016/j.compag.2017.09.009.
- Li, H, Wang, J.S, Yuan, J.B, Yin, W.Q, Wang, Z.M, & Qian, Y.Z. (2017). Analysis of threshed rice mixture separation through vibration screen using discrete element method. International Journal of Agricultural and Biological Engineering, 10(6), 231–239. https://doi.org/10.25165/j.ijabe.20171006.2910.
- Liu, L.Y, Hao, S.Y, Zhang, M, Liu, D.M, Jia, F.G, & Quan, L.Z. (2015). Numerical simulation and Experiment on Paddy Ventilation resistance based on CFD-DEM. Transactions of the Chinese Society for Agricultural Machinery, 46(8), 27–32. https://doi.org/10.6041/j.issn.1000-1298.2015.08.005.
- Ma, Z., Li, Y.M, & Xu, L.Z. (2015). Discrete-element method simulation of agricultural particles’ motion in variable-amplitude screen box. Computers and Electronics in Agriculture, 118, 92–99. https://doi.org/10.1016/j.compag.2015.08.030.
- Mosavi, A., Shamshirband, S., Salwana, E., Chau, K.-w., & Tah, J. H. M. (2019). Prediction of multi-inputs bubble column reactor using a novel hybrid model of computational fluid dynamics and machine learning. Engineering Applications of Computational Fluid Mechanics, 13(1), 482–492. https://doi.org/10.1080/19942060.2019.1613448
- Nati, C., Magagnotti, N., & Spinelli, R. (2015). The improvement of hog fuel by removing fines, using a trommel screen. Biomass and Bioenergy, 75, 155–160. https://doi.org/10.1016/j.biombioe.2015.02.021
- Rosales, T. K. (1896). Classifying crushed ore by Trommels. Nature. https://doi.org/10.1038/053488a0.
- Sabashkin, V. A., Sukhoparov, A. A., Sinitsyn, V. A., & Zakharov, S. E. (2017). Removing straw impurities from grain heaps by cylindrical sieve. Siberian Herald of Agricultural Science, 47(5), 80–87. https://doi.org/10.26898/0370-8799-2017-5-10
- Sinnott, M. D., Cleary, P. W., & Morrison, R. D. (2017). Combined DEM and SPH simulation of overflow ball mill discharge and trommel flow. Minerals Engineering, 108, 93–108. https://doi.org/10.1016/j.mineng.2017.01.016
- Walker, P. M., Kelley, T. R., & Smiciklas, K. D. (2008). Evaluation of pulverized trommel fines for use as a soil amendment. Bioresource Technology, 99(16), 7848–7858. https://doi.org/10.1016/j.biortech.2008.01.081
- Wan, X.Y, Shu, C.X, Xu, Y, Yuan, J.C, Li, H.T, & Liao, Q.X. (2018). Design and experiment on cylinder sieve with different rotational speed in cleaning system for rape combine harvesters. Transactions of the Chinese Society of Agricultural Engineering, 34(14), 27–35. https://doi.org/10.11975/j.issn.1002-6819.2018.14.004.
- Wei, X.L, Xue, B.J, & Zhao, Q. (2010). Optimization design of the stability for the plunger assembly of oil pumps based on multi-target orthogonal test design. Journal of Hebei University of Engineering (Natural Science Edition, 27(03|3), 95–99. https://doi.org/CNKI:SUN:HJXU.0.2010-03-025.
- Xiao, X. X., Li, H., Wu, C. Y., Qi, X. D., & Hu, T. (2018). Motion analysis on two early-rice varieties screened in a cylindrical sieve by means of the DEM-CFD methods. Journal of Machine Design, 35(10), 32–37. https://doi.org/10.13841/j.cnki.jxsj.2018.10.005.
- Yang, S.R. (2011). Research of 4L-80A Miniature Combine Harvester, Nanjing Agricultural University. Master: 48.
- Yuan, J. B., Li, H., Wu, C.Y., Qi, X. D., S, X. X., & L, C. (2018). Study on apace particle modeling of rice grain basis on the Discrete Element method. Journal of Nanjing Agricultural University, 41(6), 1151–1158. https://doi.org/CNKI:SUN:NJNY.0.2018-06-024.
- Yuan, J. B., Wu, C. Y., Li, H., Qi, X. D., Xiao, X. X., & Shi, X. X. (2018b). Determination and analysis of Two Kinds of threshed Rice physical properties in South China. Journal of Agricultural Mechanization Research, 40(2), 154–159. https://doi.org/10.13427/j.cnki.njyi.2018.02.030.
- Yuan, J. B., Wu, C. Y., Li, H., Qi, X. D., Xiao, X. X., & Shi, X. X. (2018c). Movement rules and screening characteristics of rice-threshed mixture separation through a cylinder sieve. Computers and Electronics in Agriculture, 154, 320–329. https://doi.org/10.1016/j.compag.2018.09.012.