
 ?Mathematical formulae have been encoded as MathML and are displayed in this HTML version using MathJax in order to improve their display. Uncheck the box to turn MathJax off. This feature requires Javascript. Click on a formula to zoom.
Abstract
The corrosion properties of AISI 316L stainless steel in upward slug flow were initially investigated using the electrochemical measurements and computational fluid dynamics (CFD) simulations. The results demonstrate that the slug flow may destroy the passivation film on the specimen surface due to its intermittency and volatility, accelerating the pitting corrosion process on the electrode surface. It results in a higher corrosion rate in the two-phase slug flow than in the single-phase flow. The variations of superficial velocity lead to changes in the slug flow configuration. The variation has a greater impact on the Taylor bubble than the liquid slug. The changes in slug flow configuration result in differences in shear stress and mass transfer coefficient, leading to corresponding differences in electrochemical properties of AISI 316L stainless steel.
1. Introduction
AISI 316L stainless steel (316L SS) is extensively applied in various pipelines because of its high corrosion resistance (Nosei et al., Citation2008). In an oxidizing environment, it will react with oxygen and form a passivation film on the surface to prevent further corrosion (Turnbull et al., Citation2003). However, in the petroleum industry, the fluid medium usually contains chloride ions, which can destroy the product scale film (Khan et al., Citation2002; Lu et al., Citation2014). Moreover, the medium is usually a two-phase gas–liquid flow, which results in much more complicated flow characteristics than do single-phase flows. Two-phase flows can exhibit a variety of flow patterns including annular, laminar, and bubbly flows in different working conditions. Among these patterns, slug flow in vertical tubes is usually in the spotlight due to its greater prevalence in the fields of petroleum exploitation, transportation, and processing (Lu & Prosperetti, Citation2009; Zheng et al., Citation2015).
The most notable feature of upward slug flow is its intermittency (Mercier-Bonin et al., Citation2000), caused by a series of slug units. The slug unit includes a bullet-shaped Taylor bubble and a continuous liquid slug (Araújo et al., Citation2012). Taylor bubbles move faster than the liquid in vertical tubes with buoyancy effects (Jean & Bernardo, Citation2014). In this process, a thin film of liquid is formed around Taylor bubbles (Tahir et al., Citation2017). Flow field characteristics in slug flow are complicated due to the flow configuration, dramatically accelerating the corrosion process. In recent years, due to the frequent occurrence of failures caused by slug flow accelerated corrosion, slug flow’s characteristic effects on metal corrosion have become key issues that urgently need to be resolved. Thus far, there have been many studies on slug flow hydrodynamic properties. For example, Orell and Rembrand (Citation1986) and Andreussi et al. (Citation1993) studied vertical slug flow characteristics and proposed analytical models of Taylor bubble. Taha and Cui (Citation2006), Hayashi et al. (Citation2011) and Lizarraga-Garcia et al. (Citation2016) analyzed the rising velocities of different parts of the slug flow using dimensional analysis and found their dependence on the internal diameter, density, viscosity, and gas–liquid tension. In addition, some research on corrosion characteristics of carbon steel has been conducted. Villarreal et al. (Citation2006) experimentally studied the corrosion rate of carbon steel in gas (air)–liquid (NaCl solution with dissolved CO2) slug flows and revealed the relationship between corrosion rate and slug frequency. Turbulence in liquid slugs was considered as a key factor affecting the metal corrosion rate. Zheng et al. (Citation2008) and Li et al. (Citation2016) investigated corrosion properties of carbon steel in slug flow using electrochemical techniques. The corrosion rate was suggested to be related to the mass transfer coefficient and shear stress of fluid. Besides common parameters, some other factors like thiosulphate-reducing bacteria (Machuca et al., Citation2017) affecting carbon steel corrosion were also investigated. However, the aperiodic characteristics of slug flow often lead to great difficulties in determining the hydromechanical effects on corrosion rate from a purely experimental approach (Nogueira et al., Citation2003). Numerical investigations can just about make up for the shortcomings of experiments and have been an effective complement to experiments (Akbarian et al., Citation2018; Ban & Pao, Citation2018). Owing to the advantages of convenience, celerity, and economy, the numerical method has been used for many engineering simulations, for example, the estimation and optimization of flutter speed of a typical wing in the diesel engine and the simulation of a snubber in a CNG station (Farzaneh-Gord et al., Citation2019; Ghalandari et al., Citation2019).
In spite of the broad application of 316L SS in the petrochemical industry, few definitive conclusions about the corrosion characteristics of 316L SS have been obtained. The present research examines the corrosion characteristics of 316L SS in gas–liquid upward slug flows using experiments and numerical simulations. The hydrodynamics of slug flow under different conditions are investigated with a circulating loop system and FLUENT software. Corrosion properties of 316L SS in different slug flows are investigated using electrochemical impedance spectrum, potentiodynamic polarization curve, scanning electron microscope (SEM), and linear polarization resistance techniques.
2. Experimental
2.1. Experimental apparatus
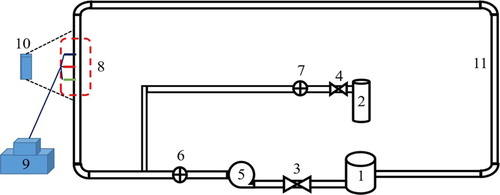
A two-phase gas–liquid flow system, as shown in Figure , was used to investigate the flow and corrosion processes of slug flow. It consisted of a reservoir (1), a nitrogen cylinder (2), controlling valves (3 and 4), a centrifugal pump (5), flowmeters (6 and 7), an electrochemical test cell (8, 9, and 10), and pipes (11). The liquid and gas media were provided from the reservoir and the nitrogen cylinder, respectively. By adjusting the pump rotational speed, the liquid solution flow rate was controlled. The gas medium flow rate was controlled by the valve at the entrance. By controlling the flow rates of gas and liquid, slug flows of different flow characteristics were presented in the upstream vertical pipeline and observed with a high-speed camera. Plexiglass tubes with inner diameter of 20.0 mm were used in the flow system. After pre-treatment, a three-electrode cell was placed in the test section with surfaces exposed according to the internal surface of the pipelines.
Figure 1. Schematic diagram of the flow system used in slug flow accelerated corrosion test: (1) reservoir, (2) nitrogen cylinder, (3 and 4) controlling valves, (5) pump (6 and 7), flowmeters, (8) three-electrode system, (9) Princeton Versa Stat Mc, (10) high-speed camera, (11) pipelines.
2.2. Electrochemical measurements
To study the corrosion characteristics of 316L SS in upward slug flow, a three-electrode electrochemical cell was used to conduct electrochemical tests. A cylindrical working electrode (WE) with an exposed area of 3.14 10−2 cm2 was made up of 316L SS. Saturated calomel reference electrode (RE) and carbon rod counter electrode (CE) were employed for electrochemical measurements. Table shows the chemical composition of 316L SS. Before the test, working surfaces of WE and CE were ground with 800# silicon carbide paper and washed with a mixture of alcohol and deionized water. Each working electrode was employed for one operational condition.
Table 1. Chemical composition of 316L SS (wt %).
Tests were conducted in 3.0 wt% NaCl aqueous solution prepared using analytical grade reagents and deionized water. Solution pH was between 7.0 and 7.5. Gas medium for test was nitrogen of 99.95% purity. The experiments were performed at room temperature (23.4 ± 0.1°C) and atmospheric pressure (1.01 × 10⁵ Pa). Before experiments, nitrogen was passed through the tubes to remove air from the system for half an hour.
Electrochemical impedance spectroscopy (EIS), potentiodynamic polarization curve, and linear polarization resistance (LPR) measurements were made to determine the corrosion behaviors of 316L SS at different operating conditions. Polarization curves were obtained at a constant sweep rate of 1 mV/s in the range of −1.0 to 1.6 V with respect to open circuit potential (OCP). LPR measurements were conducted by polarizing WE from -10 mVSCE to +10 mVSCE with respect to Ecorr at the scanning rate of 1 mV/s every 20 min. EIS measurements were conducted at the Ecorr value with a scanning frequency from 105 to 10−1 Hz.
The corrosion current density of 316L SS was determined with the Stern–Geary formula, as shown in Equation (1):
(1)
(1) The average reduction of specimen thickness which is given by Equation (2) was applied to indicate the 316L SS corrosion rate:
(2)
(2) In Equation (2),
denotes the density of 316L SS;
is the weight reduction caused by slug flow accelerated corrosion and can be obtained from Equation (3):
(3)
(3)
3. Numerical simulation
3.1. Governing equations
The commercial software FLUENT was employed to simulate the upward slug flow in vertical tubes. Numerical simulations were carried out using the method of volume of fluid (VOF) introduced by Hirt and Nichols (Citation1981). In this approach, continuity and momentum equations are described as follows:
(4)
(4)
(5)
(5) In order to identify the interface position in the upward slug flow, a function for the volume fraction is employed, described by Drew (Citation1983):
(6)
(6) In the fully developed slug flow, strong turbulence is formed in the liquid slug region. To take both accuracy and processing time into consideration, a standard k–ε turbulence model was applied to calculate the two-phase upward slug flows in vertical tubes. For this model, the turbulent viscosity
is calculated with the following equation:
(7)
(7) The turbulent kinetic energy k and its dissipation rate ε are given as follows:
(8)
(8)
(9)
(9) The constants used for the solution were
= 0.09,
= 1.3,
= 1.0,
= 1.44, and
= 1.92.
stands for turbulence production, defined by:
(10)
(10) In the upward slug flows, wall shear stress is described by
(11)
(11) The mass transfer coefficient of corrosive particles (H+, Fe2+, Cl−, etc.) is described by
(12)
(12)
3.3. Grid settings and boundary condition
A two-dimensional CFD model was built in accordance with the experimental pipe to simulate the upward slug flow. The model was composed of three parts: a horizontal straight section (length 500 mm) for feeding gas and liquid, an upstream section (length 2000 mm) for observing flow configurations of slug flow, and a 90° elbow with a curvature radius of 30 mm to connect the two straight sections. The inner diameter of the pipe model was 20 mm, the same as for the experimental tubes.
The tube model was developed and meshed by pre-processing software ANSYS-ICEM, which provides a module to build simple models. Given the simplicity and symmetry of this tube model, quadrilateral structured grids were established. A grid independence study was conducted by verifying 38200, 51240, and 64050 elements. It was found that there was little difference in the flow configurations obtained by the three grid numbers. 38200 elements could meet the requirements of grid independence and calculation accuracy. Table shows the characteristics of nitrogen and water employed in simulations.
Table 2. Properties of nitrogen and water in the simulation.
Mass flow rates and pressure outlet boundary conditions were imposed. The inner wall of the tube was no-slip. The finite volume method was used because of its unique advantages in discretizing governing equations. The pressure and velocity fields of the upward slug flow were coupled with the PISO algorithm. A second-order upwind scheme was applied for momentum. Simulations were conducted with a time step of 10−5 and the maximal iteration per time step was set as 150.
4. Results and discussion
4.1. Flow characteristics of upward slug flows
4.1.1. Flow configurations at different superficial velocities
Flow rate is the crucial parameter governing slug flow characteristics (Gueta et al., Citation2006). For the convenience of analysis, the slug unit is divided into several regions, the Taylor bubble, which consists of nose and main body, wake, liquid film around Taylor bubble, and liquid slug (Thaker & Banerjee, Citation2015), shown in Figure . ‘Taylor bubble nose length’ refers to the distance between the bubble tip and the position where the bubble diameter does not change visibly. ‘Diameter of the bubble nose’ refers to the diameter of the bubble corresponding to the central position. ‘Length’ and ‘diameter of Taylor bubble’ refer to the dimensions of the Taylor bubble’s main body.
Figure 2. Sketch diagram of the upward slug unit.
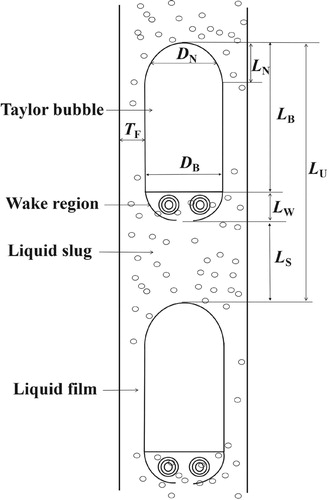
Figure shows experimental results obtained for slug flows at superficial gas velocities (UG) of 0, 0.0265, 0.053, 0.0796, 0.106, 0.159, 0.212, and 0.265 m/s while superficial liquid velocity (UL) was kept at 0.637 m/s. It can be found that UG has a significant influence on slug flow configurations, especially for the Taylor bubble and the liquid slug. Taylor bubble and liquid slug lengths are enhanced by increasing UG. Dimensions of different regions of the slug flow at different UG are also measured and shown in Table .
Figure 3. Experimental results of slug flow at different UG while UL was 0.637 m/s. UG (m/s): (a) 0; (b) 0.0265; (c) 0.053; (d) 0.0796; (e) 0.106; (f) 0.1325; (g) 0.159; (h) 0.1855; (k) 0.212; (l) 0.265.
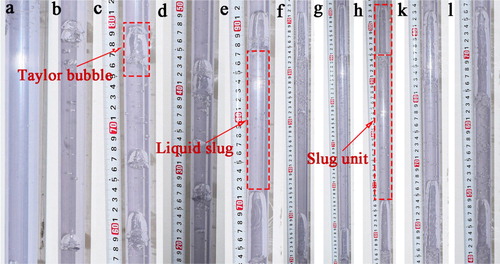
Table 3. Flow characteristics of slug flow at UL = 0.637 m/s.
It is observed in Table that Taylor bubble nose length ranges from 0.8 to 1.3 cm with a 1.2–1.5 cm diameter as UG is increased. The length of Taylor bubble is increased from 2.3 (UG = 0.053 m/s) to 12.5 cm (UG = 0.265 m/s) with a 1.7–1.8 cm diameter. In proportion, the thickness of liquid film is 0.15–0.1 cm. In this case, the length of bubble wake is slightly increased from 1.0 to 3.0 cm, and the length of liquid slug is increased from 12.2 to 16.0 cm. Accordingly, the total length of slug unit is increased from 15.5 to 31.5 cm with UG.
Table shows experimental results of slug flow characteristics at UL = 0.734 m/s. It is observed that slug flow configurations at this operating condition share a similar variation tendency with those shown in Table . The nose length is increased from 1.0 to 1.5 cm with a diameter of about 1.0 cm. The length of Taylor bubble is increased from 2.0 (UG = 0.053 m/s) to 10.0 cm (UG = 0.265 m/s) with a 1.2–1.7 cm diameter and the corresponding liquid film thickness is 0.4–0.15 cm. The wake length is increased from 0.5 cm to 3.5 cm. In addition, the length of liquid slug is increased from 5.0 to 19.0 cm. As a result, the total length of the slug unit is increased from 7.0 to 32.5 cm as UG is increased from 0.053 to 0.265 m/s.
Table 4. Flow characteristics of slug flow at UL = 0.743 m/s.
Table shows experimental results of slug flow characteristics at UL = 0.849 m/s. It shows a significant difference from the aforementioned results. At UG = 0.053 m/s, many tiny bubbles but no large-length-scale bubbles can be found in the vertical pipe, indicating that the flow patternat this gas flow rate is bubbly flow (Abdulmouti & Abdulmouti, Citation2014; Morgado et al., Citation2016). As UG is generally increased, the dispersed tiny bubbles merge into elongated bubbles, namely Taylor bubbles, forming the slug flow (Brauner & Ullmann, Citation2004). With increased UG, the nose length is increased from 0.5 to 1.0 cm with a 1.0–1.4 cm diameter. At the same time, the length of Taylor bubble is increased from 1.5 to 7.5 cm with a diameter of about 1.6 cm. The length of liquid slug is increased from 5.0 to 18.0 cm, resulting in an increase of slug unit length from 8.0 to 30.0 cm.
Table 5. Flow characteristics of slug flow at UL = 0.849 m/s.
Figure shows the relationship between slug flow characteristics and UL. It can be seen that the lengths of liquid slug, Taylor bubble, and bubble wake are decreased with UL. The length of Taylor bubble is decreased from 5.8 (UL = 0.637 m/s) to 1.5 cm (UL = 0.849 m/s) with a diameter of about 1.6 cm. At the same time, the length of liquid slug is decreased from 14.0 to 5.0 cm. However, it should be noted that the bubble nose and liquid film are not sensitive to liquid flow rate variation at constant UG.
Figure 4. Flow characteristics of slug flow at different UL wile UG was 0.106 m/s.
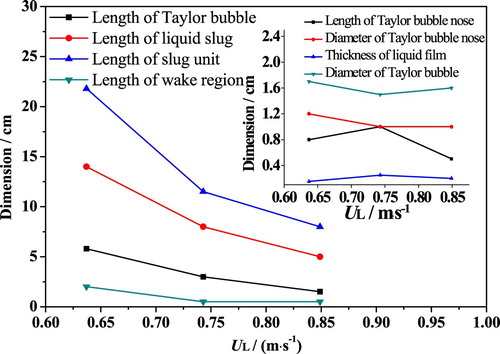
In summary, conclusions can be drawn that with an increase of UG both liquid slug and Taylor bubble in vertical tubes get enlarged, and the Taylor bubble gets a greater amplification with UG. When UL = 0.637 m/s, the length of Taylor bubble is increased by 5.4 times, while the liquid slug is increased by about 1.3 times. When UL = 0.734 m/s, the length of Taylor bubble is increased by five times, and the liquid slug is increased by about 3.8 times. Similarly, when UL = 0.849 m/s, the length of Taylor bubble is increased by five times, and the liquid slug is increased by about 3.6 times. The increase of Taylor bubble length decreased the thickness of liquid film. Conversely, as UL increases, both Taylor bubble and liquid slug become shorter, and liquid film thickness increases slightly.
4.1.2. Distributions of mass transfer coefficient and shear stress
Slug flow accelerated corrosion is the coupling effect of hydrodynamic action and electrochemical reaction. The process of electrochemical reaction includes four steps (Randazzo et al., Citation2011): (1) mass transfer of the reactants, (2) electric double layer charging, (3) electrode redox reaction, and (4) stripping of the reaction product. For most operating conditions, the corrosion process of 316L SS is controlled by the mass transfer and electrochemical processes of the reactants. The former is mainly determined by mass transfer coefficient and fluid shear stress (Leishear et al., Citation2010); the latter is mainly determined by the nature of the electrode and operating conditions such as temperature (Carlson et al., Citation2018).
Figure shows the simulation results of slug flow in the tube. The results were obtained at t = 52 s while the flow field had reached a stable state. In the figure, UG from left to right is 0.053, 0.106, 0.159, 0.212, and 0.265 m/s, respectively, while UL is 0.637 m/s. Simulation results show that the average value of Taylor bubble length at each condition is 2.4, 5.6, 8.5, 10.8, and 11.7 cm, respectively. Experimental results in Table show that the values at the same conditions are 2.3, 5.8, 9.0, 12.0, and 12.5 cm. Liquid slug length in simulations is 4.5, 13.2, 14.4, 15.8, 16.7 cm, while it is 12.2, 14.0, 15.5, 16.0, 16.0 cm in experiments. It can be observed that Taylor bubble and liquid slug are enlarged with UG, which agrees well with the experimental results. Moreover, other dimension values of bubble nose, wake region, and liquid film in simulations are almost same as from the experiments, demonstrating the validity of CFD simulations.
Figure 5. CFD results of flow configurations of the slug flow at UL = 0.637 m/s. UG (m/s): (a) 0.053; (b) 0.106; (c) 0.159; (d) 0.212; (e) 0.265.
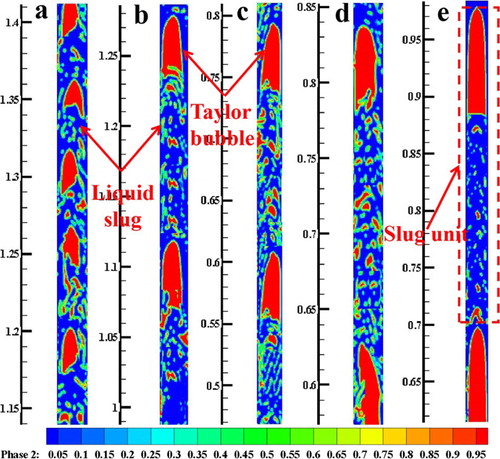
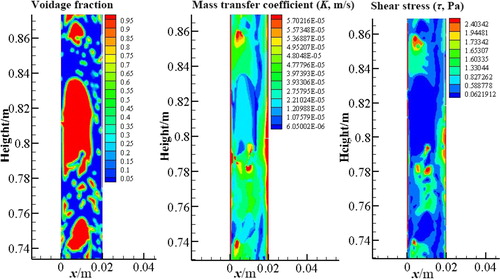
Figure presents the distributions of shear stress (τ) and mass transfer coefficient (K) in vertical slug flows, which were also obtained at t = 52 s. It is indicated that the shear stress in the liquid film is higher than that in other regions. Liquid film thickness around the Taylor bubble is not uniform, resulting in different shear stress in this region. Liquid films with lower thickness generate a greater shear stress. This can be explained by the fact that the thinner liquid film leads to a greater velocity gradient, which results in a larger shear stress. As far as the mass transfer coefficient is concerned, it is greater in the liquid film than in other regions. Furthermore, the thinner the liquid film, the greater the mass transfer coefficient.
Figure 6. CFD results of distributions of shear stress and mass transfer coefficient in the slug unit.
Figures and show maximums of shear stress and mass transfer coefficient in slug flows at various superficial velocities. Here, every point in the plot represent the maximum of shear stress coefficient or mass transfer under specific conditions. For example, when UG is 0.053 m/s and UL is 0.849 m/s, the shear stress in the entire computational domain ranges from 0 to 34 Pa. Therefore, the maximum shear stress under this condition is 34 Pa. It is suggested that the mass transfer coefficient and shear stress share a similar tendency with UG and UL. As UG is increased from 0 to 0.265 m/s, the maximum of shear stress is increased from 16 to 30 Pa at UL = 0.637 m/s, from 20 to 37 Pa at UL = 0.743 m/s and from 30 to 40 Pa at UL = 0.849 m/s. At the same time, the maximum mass transfer coefficient is increased from 3.1 × 10⁻⁵ to 4.3 × 10⁻⁵ m/s at UL = 0.637 m/s, from 3.6 × 10⁻⁵ to 4.6 × 10⁻⁵ m/s at UL = 0.743 m/s, and from 4.4 × 10⁻⁵ to 5.4 × 10⁻⁵ m/s at UL = 0.849 m/s. It can be found that an increase of UL increases both shear stress and mass transfer coefficient in slug flow.
Figure 7. Maximums of shear stress in slug flow under various conditions.
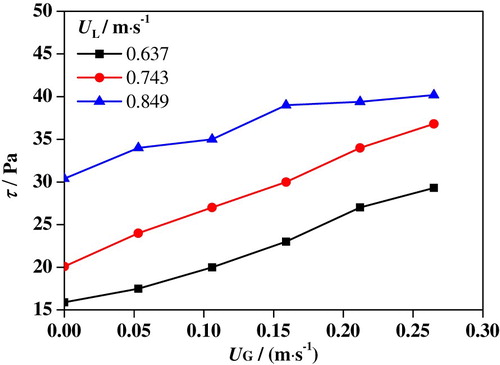
Figure 8. Maximums of mass transfer coefficient in slug flow under different conditions.
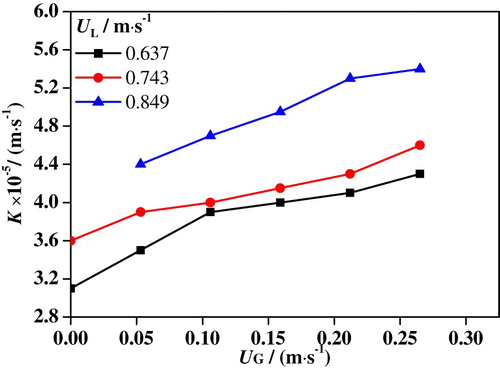
In the electrochemical reaction process, greater mass transfer coefficient means faster transfer of chloride ions from bulk solution to metal surface and of metal ions from surface to bulk solution (Wang et al., Citation2016). Moreover, the greater shear stress leads to worse damage to the passivation film. When UL is increased, the slug flow turbulence is increased, which enhances the shear stress and mass transfer coefficient. Consequently, the accelerated corrosion rate of slug flow in the 316L SS specimen increases with UG and UL.
4.2. Electrochemical characteristics of 316L SS
4.2.1. Polarization curves
As mentioned above, slug flow accelerated corrosion is the coupling effect of hydrodynamic flow and electrochemical reaction. The electrochemical corrosion process is drastically impacted by the hydrodynamic characteristics (Wang et al., Citation2016). Figures – show the polarization curves of 316L SS in the upward slug flow at different UG and UL. A limiting current was observed in the cathodic branches of curves which is directly related to oxygen depletion near the surface. Right below the corrosion potential, oxygen molecule diffusion transport from bulk solution to metal surface controls the cathodic reaction process. When the potential is more negative to the corrosion potential, the collective effect of diffusion and polarization dominates the cathodic reaction. The anodic branches of polarization curves show the same tendency at different superficial velocities. The current density increases with an increase of anodic polarization potential, indicating that iron atoms are unlimitedly supplied at the bulk solution and 316L SS specimen interface. With further increase of polarization potential, the growth of the corrosion current gradually slows down, meaning that a passivation film is forming on the specimen surface.
Figure 9. Polarization curves of 316L SS in upward slug flow at UL = 0.637 m/s.
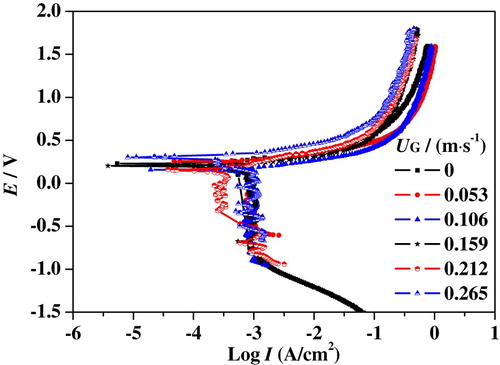
Figure 10. Polarization curves of 316L SS in upward slug flow at UL = 0.743 m/s.
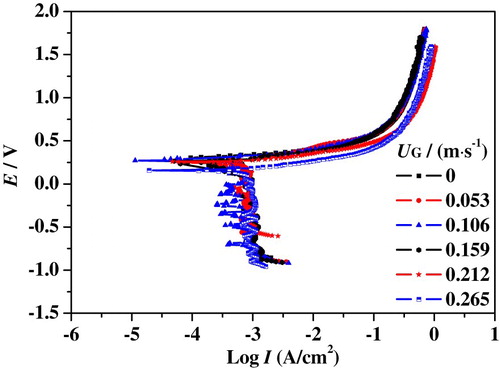
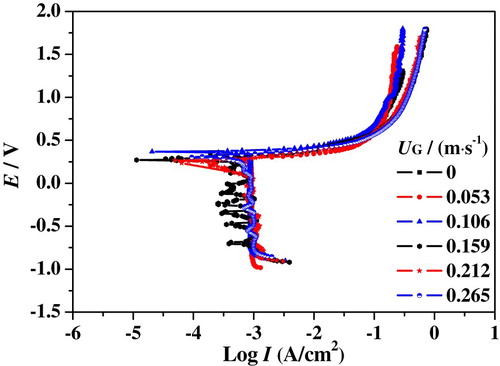
Figure 11. Polarization curves of 316L SS in upward slug flow at UL = 0.849 m/s.
4.2.2. EIS measurements
EIS measurements have been performed to evaluate the electrochemical corrosion process of 316L SS in upward slug flow. Figure (a–c) shows the Nyquist plots obtained at different UG and UL. It can be observed from the figures that all measured plots show a common feature, i.e. semicircle arcs with centers depressed below the x-axis and only one time constant can be found from the plots, because of the coupled response of metal surface and passive film (Marcelin et al., Citation2013). An electrochemical equivalent circuit, as presented in Figure , is employed to obtain the EIS parameters, including the passive film resistance Rf, the constant phase element CPEf, and the ohmic resistance of the solution Rs (Zhao et al., Citation2015).
Figure 12. Nyquist plots of 316L SS in slug flow under different conditions: (a) UL = 0.637 m/s; (b) UL = 0.743 m/s; (c) UL = 0.849 m/s.
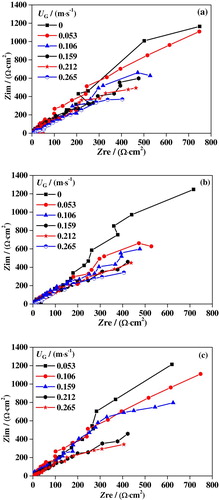
Figure 13. Equivalent circuit of the corrosion system.
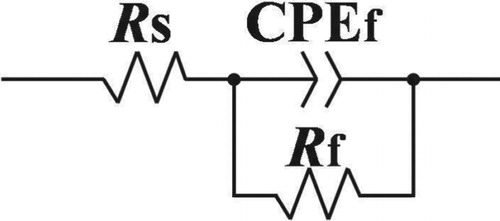
In the slug flow accelerated corrosion process of 316L SS, the cathodic reaction is the oxygen-absorbing corrosion process, and the anode reaction is the metal dissolution process. Active surface area due to defects Rf, solution ohmic resistance Rs, and passive film resistance are key factors affecting the corrosion rate.
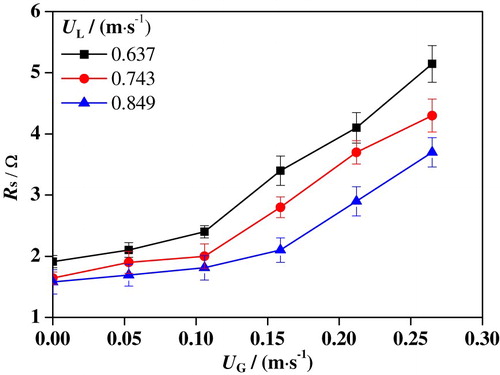
Figures – show the variations of Rf and Rs under different conditions. It is found that the variation trend of Rf with UG is completely the opposite to that of Rs. As UG is increased, Rf is drastically decreased, while RS is increased. When UG ranges from 0 to 0.265 m/s, Rf is decreased from 179.7 to 45.9 Ω at UL = 0.637 m/s, from 148.6 to 32.1 Ω at UL = 0.743 m/s, and from 110.8 to 30.8 Ω at UL = 0.849 m/s, respectively. Nevertheless, Rs is increased from 1.9 to 5.1 Ω at UL = 0.637 m/s, from 1.6 to 4.3 Ω at UL = 0.743 m/s, and from 1.5 to 3.7 Ω at UL = 0.849 m/s with the increased UG. It is obvious that Rf has a much wider range of variation with UG than Rs, indicating a greater influence on the corrosion process. It also can be concluded that both Rf and Rs are decreased with an increase of UL. This is attributed to the fact that the liquid solution has a better conductivity than nitrogen. As UL is increased, the liquid content in the slug unit gets higher, leading to smaller Rs. Moreover, the increased UL leads to greater damage to the passivation film on the surface, which results in a reduction of Rf.
Figure 14. Variations of Rf under different conditions.
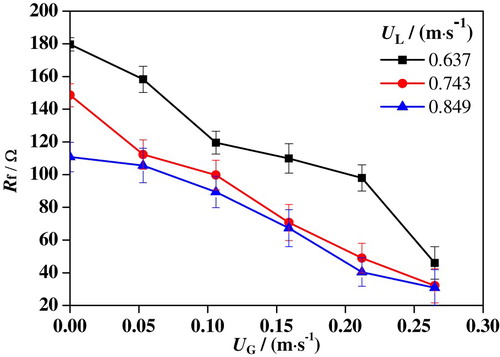
Figure 15. Variations of Rs under different conditions.
4.2.3. Corrosion rate of 316L SS
When UG and UL are changed, slug flow configurations change correspondingly, resulting in differences in the corrosion rate (Nemoto & Baliño, Citation2012). The slug flow accelerated corrosion rates of 316L SS samples are measured and counted according to Equation (1); the results are shown in Figure .
Figure 16. Corrosion rates of 316L SS under different conditions.
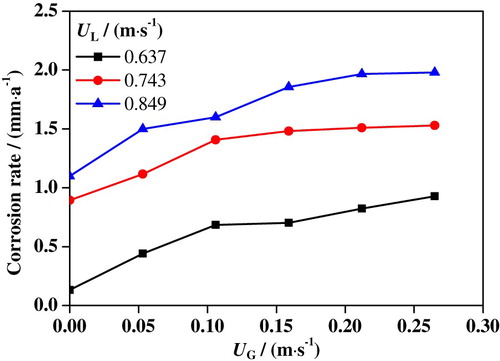
From the figure, it can be found that as UG is enhanced from 0 to 0.265 m/s the corrosion rate of 316L SS is increased from 0.132 to 0.929 mm/a at UL = 0.637 m/s, from 0.895 to 1.53 mm/a at UL = 0.743 m/s, and from 1.1 to 1.98 mm/a at UL = 0.849 m/s. Obviously, the 316L SS corrosion rate increases with an increase of UG. Distribution regularities of the mass transfer coefficient and shear stress obtained from numerical simulations can explain this phenomenon well. As shown in Figure , with an increase of UG, the Taylor bubble gets enlarged and the liquid film thickness decreases, resulting in an increase of reactant mass transfer coefficients and fluid shear stress in this region, which greatly promotes the redox reaction on the electrode surface. At the same time, the proportion of Taylor bubble in the slug unit increases, resulting in a larger proportion of the liquid film region, which also increases the corrosion rate. It is suggested that the 316L SS corrosion rate is also increased with the increased UL. This is probably because reactant ions exist in the liquid medium. With an increase of UL, the fluid turbulence is increased. It leads to an acceleration of the convective transfer process of the reactants, which promotes the corrosion process of 316L SS.
Moreover, it also can be found that UG’s effect on the 316L SS corrosion rate is significantly greater than UL’s. It may be due to the fact that the corrosion process of the 316L SS electrode is mainly related to the mass transfer of reactant ions and electric charges in the near-wall region that is located within the liquid film. As UG is increased, the thickness of the liquid film decreases, resulting in enhanced mass transfer coefficient and fluid shear in the near-wall region, which can significantly accelerate the corrosion process on the electrode surface. When UL is increased, although the liquid slug and Taylor bubble are decreased and the liquid film thickness increases, the fluid turbulence gets larger. This also leads to an increase in shear stress and mass transfer coefficient in the near-wall region. The results of the corrosion rate are consistent with polarization curves and EIS measurement results. Furthermore, from the distributions of mass transfer coefficient and shear stress shown in Figures and , UG’s effect on the mass transfer coefficient and shear stress is greater than UL’s. Therefore, UG has a relatively greater impact on the 316L SS corrosion rate than does UL. The findings of this section are consistent with Yan and Che’s (Citation2011) research.
4.3. Corrosion morphology analysis
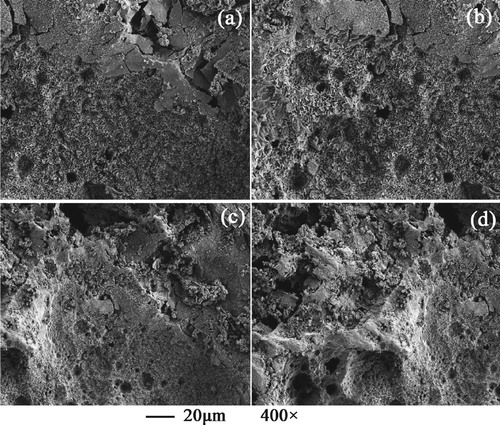
After the electrochemical measurement for 2 h, the samples were washed with deionized water and dried with cool air. SEM was used to observe the surface morphologies of 316L SS samples. Figure shows 316L SS specimen surface morphologies in the upward slug flow at different UG while UL = 0.637 m/s. It is suggested that typical pitting corrosion occurs on the surfaces of 316L SS specimens. Furthermore, it is found that the passive film on the specimen surface is damaged more and more seriously with an increase of UG. The SEM observations agree well with the electrochemical test and CFD results obtained in this research.
Figure 17. SEM images of 316L SS in the upward slug flow at UL = 0.637 m/s. UG (m/s): (a) 0.106; (b) 0.159; (c) 0.212; (d) 0.265.
6. Conclusions
Upward slug flows were formed in the circulating system from nitrogen and sodium chloride solution. Corrosion characteristics of AISI 316L SS in the slug flow were initially measured using electrochemical approaches. Also, the effects of shear stress and mass transfer coefficient on corrosion rate were revealed by numerical simulations. According to the results, an increase of UG enhanced the lengths of the Taylor bubble and liquid slug and the latter has a greater amplification than the latter. At the same time, the liquid film thickness is decreased. As UL increases, the lengths of liquid slug and Taylor bubble are decreased. However, the nose and wake of Taylor bubble are relatively insensitive to UL. The 316L SS corrosion rate in two-phase slug flows is much greater than that in the single-phase liquids. The shear stress of liquid fluid and mass transfer coefficient of reactants get larger with increasing UG and UL, resulting in an increase in the 316L SS corrosion rate. In addition, UG has a relatively greater impact on the 316L SS corrosion rate than does UL. Upward slug flow may destroy the passivation film on the 316L SS specimen surface due to its intermittency and volatility, accelerating the pitting corrosion process. When UG and UL are changed drastically, the slug flow may transform into other flow patterns. However, there are still no strict boundaries for the transition of slug flow. Therefore, this study has only focused on 316L SS corrosion characteristics in typical slug flows. Future studies could focus on corrosion characteristic in the transition process.
Nomenclature
| DB | = | Diameter of Taylor bubble (m) |
| DN | = | Diameter of bubble nose (m) |
| Dd | = | Diffusion coefficient (m2/s) |
| I0 | = | Corrosion current density (A/cm2) |
| F | = | Faraday’s constant |
| Frs | = | Froude number |
| K | = | Mass transfer coefficient (m/s) |
| L | = | Characteristic length (m) |
| LB | = | Length of Taylor bubble (m) |
| LN | = | Length of bubble nose (m) |
| LW | = | Length of wake region (m) |
| LS | = | Length of liquid slug (m) |
| LU | = | Length of slug unit (m) |
| P | = | Average static pressure (Pa) |
| Rp | = | Polarization resistance (Ω) |
| Rf | = | Resistance of passive film (Ω) |
| Rs | = | Ohmic resistance of the solution (Ω) |
| TF | = | Thickness of liquid film (m) |
| UL | = | Superficial liquid velocity (m/s) |
| UG | = | Superficial gas velocity (m/s) |
| ba | = | Anode Tafel slope of the common logarithmic polarization curve |
| bc | = | Cathode Tafel slope of the common logarithmic polarization curve |
| k | = | Turbulent kinetic energy (J) |
| ma | = | Relative atomic mass of 316L SS |
| n | = | Moles of electrons transferred in electrochemical action (mol) |
| t | = | Time (s) |
| u | = | Characteristic velocity (m/s) |
| ui | = | Fluid velocity in the direction of axis i (m/s) |
| v0 | = | Weight reduction caused by slug flow accelerated corrosion (g) |
| vd | = | Average reduction of specimen thickness (mm) |
| xi | = | ith spatial coordinate |
| v | = | Average velocity vector |
| αq | = | Volume fraction of the q phase |
| β | = | Taylor bubble length fraction |
| μ | = | Fluid dynamic viscosity (Pa·s) |
| μeff | = | Effective viscosity (Pa·s) |
| μT | = | Turbulent viscosity (Pa·s) |
| ε | = | Dissipation rate of turbulent kinetic energy |
| τ | = | Shear stress (Pa) |
Disclosure statement
No potential conflict of interest was reported by the authors.
Additional information
Funding
References
- Abdulmouti, H., & Abdulmouti, H. (2014). Bubbly two-phase flow: Part I- characteristics, structures, behaviors and flow patterns. American Journal of Fluid Dynamics, 4(4), 194–240.
- Akbarian, E., Najafi, B., Jafari, M., Ardabilli, S. F., Shamshirband, S., & Chau, K. (2018). Experimental and computational fluid dynamics-based numerical simulation of using natural gas in a dual-fueled diesel engine. Engineering Applications of Computational Fluid Mechanics, 12(1), 517–534. https://doi.org/10.1080/19942060.2018.1472670
- Andreussi, P., Bendiksen, K. H., & Nydal, O. J. (1993). Void distribution in slug flow. International Journal of Multiphase Flow, 19(5), 817–828. https://doi.org/10.1016/0301-9322(93)90045-V
- Araújo, J. D. P., Miranda, J. M., Pinto, A. M. F. R., & Campos, J. B. L. M. (2012). Wide-ranging survey on the laminar flow of individual Taylor bubbles rising through stagnant Newtonian liquids. International Journal of Multiphase Flow, 43(3), 131–148. https://doi.org/10.1016/j.ijmultiphaseflow.2012.03.007
- Ban, S., & Pao, W. (2018). Numerical simulation of two-phase flow regime in horizontal pipeline and its validation. International Journal of Numerical Methods for Heat & Fluid Flow, 28(6), 1279–1314. https://doi.org/10.1108/HFF-05-2017-0195
- Brauner, N., & Ullmann, A. (2004). Modelling of gas entrainment from Taylor bubbles. Part A: Slug flow. International Journal of Multiphase Flow, 30(3), 239–272. https://doi.org/10.1016/j.ijmultiphaseflow.2003.11.007
- Carlson, A., Shapturenka, P., Björn, E., Göran, L., & Rakel, W. (2018). Electrode parameters and operating conditions influencing the performance of anion exchange membrane fuel cells. Electrochimica Acta, 277(13), 151–160. https://doi.org/10.1016/j.electacta.2018.04.137
- Drew, D. A. (1983). Mathematical modeling of two-phase flow. Annual Review of Fluid Mechanics, 15(1), 261–291. https://doi.org/10.1146/annurev.fl.15.010183.001401
- Farzaneh-Gord, M., Faramarzi, M., Ahmadi, M. H., Sadi, M., Shamshirband, S., Mosavi, A., & Chau, K. (2019). Numerical simulation of pressure pulsation effects of a snubber in a CNG station for increasing measurement accuracy. Engineering Applications of Computational Fluid Mechanics, 13(1), 642–663. https://doi.org/10.1080/19942060.2019.1624197
- Ghalandari, M., Shamshirband, S., Mosavi, A., & Chau, K. (2019). Flutter speed estimation using presented differential quadrature method formulation. Engineering Applications of Computational Fluid Mechanics, 13(1), 804–810. https://doi.org/10.1080/19942060.2019.1627676
- Gueta, S., Decarrea, S., Henriota, V., & Linéb, A. (2006). Void fraction in vertical gas–liquid slug flow: Influence of liquid slug content. Chemical Engineering Science, 61(22), 7336–7350. https://doi.org/10.1016/j.ces.2006.08.029
- Hayashi, K., Kurimoto, R., & Tomiyama, A. (2011). Terminal velocity of a Taylor drop in a vertical pipe. International Journal of Multiphase Flow, 37(3), 241–251. https://doi.org/10.1016/j.ijmultiphaseflow.2010.10.008
- Hirt, C. W., & Nichols, B. D. (1981). Volume of fluid (VOF) method for the dynamics of free boundaries. Journal of Computational Physics, 39(1), 201–225. https://doi.org/10.1016/0021-9991(81)90145-5
- Jean, F., & Bernardo, F. (2014). Taylor bubble rising in a vertical pipe against laminar or turbulent downward flow: Symmetric to asymmetric shape transition. Journal of Fluid Mechanics, 755(9), 485–502. https://doi.org/10.1017/jfm.2014.429
- Khan, T. I., Orhan, N., & Eroglu, M. (2002). Transient liquid phase bonding of a microduplex stainless steel using amorphous interlayers. Materials Science and Technology, 18(4), 396–400. https://doi.org/10.1179/026708302225001697
- Leishear, R. A., Guerrero, H. N., Restivo, M. L., & Sherwood, D. J. (2010). Mass transfer coefficients for a non-newtonian fluid and water with and without antifoam agents. Journal of Fluids Engineering, 132(11), 114501-1-114501-7. https://doi.org/10.1115/1.4002704
- Li, W., Pots, B. F. M., Brown, B., Kee, K. E., & Nesic, S. (2016). A direct measurement of wall shear stress in multiphase flow-Is it an important parameter in CO2 corrosion of carbon steel pipelines? Corrosion Science, 110(9), 35–45. https://doi.org/10.1016/j.corsci.2016.04.008
- Lizarraga-Garcia, E., Buongiorno, J., & Bucci, M. (2016). An analytical film drainage model and breakup criterion for Taylor bubbles in slug flow in inclined round pipes. International Journal of Multiphase Flow, 84(4), 46–53. https://doi.org/10.1016/j.ijmultiphaseflow.2016.03.020
- Lu, Y. H., Chen, Z. R., Zhu, X. F., & Shoji, T. (2014). SCC behaviours of austenitic stainless steel Z3CN20-09M in high temperature water. Materials Science and Technology, 30(15), 1944–1950. https://doi.org/10.1179/1743284714Y.0000000585
- Lu, X., & Prosperetti, A. (2009). A numerical study of Taylor bubbles. Industrial & Engineering Chemistry Research, 48(1), 242–252. https://doi.org/10.1021/ie800201x
- Machuca, L. L., Lepkova, K., & Petroski, A. (2017). Corrosion of carbon steel in the presence of oilfifield deposit and thiosulphate-reducing bacteria in CO2 environment. Corrosion Science, 129(12), 16–25. https://doi.org/10.1016/j.corsci.2017.09.011
- Marcelin, S., Pébère, N., & Régnier. (2013). Electrochemical characterisation of a martensitic stainless steel in a neutral chloride solution. Electrochimica Acta, 87(1), 32–40. https://doi.org/10.1016/j.electacta.2012.09.011
- Mercier-Bonin, M., Maranges, C., Lafforgue, C., Fonade, C., & Line, A. (2000). Hydrodynamics of slug flow applied to cross-flow filtration in narrow tubes. Aiche Journal, 46(3), 476–488. https://doi.org/10.1002/aic.690460306
- Morgado, A. O., Miranda, J. M., Araújo, J. D. P., & Campos, J. B. L. M. (2016). Review on vertical gas–liquid slug flow. International Journal of Multiphase Flow, 85(10), 348–368. https://doi.org/10.1016/j.ijmultiphaseflow.2016.07.002
- Nemoto, R. H., & Baliño, J. L. (2012). Modeling and simulation of severe slugging with mass transfer effects. International Journal of Multiphase Flow, 40(4), 144–157. https://doi.org/10.1016/j.ijmultiphaseflow.2011.11.005
- Nogueira, S., Sousa, R. G., Pinto, A. M. F. R., Riethmuller, M. L., & Campos, J. B. L. M. (2003). Simultaneous PIV and pulsed shadow technique in slug flow: A solution for optical problems. Experiments in Fluids, 35(6), 598–609. https://doi.org/10.1007/s00348-003-0708-8
- Nosei, L., Farina, S., Ávalos, M., Náchez, L., Gómez, B. J., & Feugeas, J. (2008). Corrosion behavior of ion nitrided AISI 316L stainless steel. Thin Solid Films, 516(6), 1044–1050. https://doi.org/10.1016/j.tsf.2007.08.072
- Orell, A., & Rembrand, R. (1986). A model for gas–liquid slug flow in a vertical tube. Industrial & Engineering Chemistry Fundamentals, 25(2), 196–206. https://doi.org/10.1021/i100022a004
- Randazzo, S., Scialdone, O., Brillas, E., & Sirés, I. (2011). Comparative electrochemical treatments of two chlorinated aliphatic hydrocarbons. Time course of the main reaction by-products. Journal of Hazardous Materials, 192(3), 1555–1564. https://doi.org/10.1016/j.jhazmat.2011.06.075
- Taha, T., & Cui, Z. F. (2006). CFD modelling of slug flow in vertical tubes. Chemical Engineering Science, 61(2), 676–687. https://doi.org/10.1016/j.ces.2005.07.022
- Tahir, F., Gul, T., Islam, S., Shah, Z., Khan, A., Khan, W., Ali, L., & Muradullah. (2017). Flow of a nano-liquid film of Maxwell fluid with thermal radiation and magneto hydrodynamic properties on an unstable stretching sheet. Journal of Nanofluids, 6(6), 1021–1030. https://doi.org/10.1166/jon.2017.1400
- Thaker, J., & Banerjee, J. (2015). Characterization of two-phase slug flow sub-regimes using flow visualization. Journal of Petroleum Science and Engineering, 135(3), 561–576. https://doi.org/10.1016/j.petrol.2015.10.018
- Turnbull, A., Ryan, M., Willetts, A., & Zhou, S. (2003). Corrosion and electrochemical behaviour of 316L stainless steel in acetic acid solutions. Corrosion Science, 45(5), 1051–1072. https://doi.org/10.1016/S0010-938X(02)00149-X
- Villarreal, J., Laverde, D., & Fuentes, C. (2006). Carbon-steel corrosion in multiphase slug flow and CO2. Corrosion Science, 48(9), 2363–2379. https://doi.org/10.1016/j.corsci.2005.09.003
- Wang, J., Jang, Y., Wan, G., Giridharan, V., Song, G. L., Xu, Z., Koo, Y., Qi, P., Sankar, J., Huang, N., & Yun, Y. (2016). Flow-induced corrosion of absorbable magnesium alloy: In-situ and real-time electrochemical study. Corrosion Science, 104(3), 277–289. https://doi.org/10.1016/j.corsci.2015.12.020
- Yan, K., & Che, D. (2011). Hydrodynamic and mass transfer characteristics of slug flow in a vertical pipe with and without dispersed small bubbles. International Journal of Multiphase Flow, 37(4), 299–325. https://doi.org/10.1016/j.ijmultiphaseflow.2010.11.001
- Zhao, Y., Fang, Z., Yao, J., Dong, S., & Ning, L. (2015). Erosion–corrosion behavior and corrosion resistance of AISI 316 stainless steel in flow jet impingement. Wear, 328-329(4), 464–474. https://doi.org/10.1016/j.wear.2015.03.017
- Zheng, D., Che, D., & Liu, Y. (2008). Experimental investigation on gas–liquid two-phase slug flow enhanced carbon dioxide corrosion in vertical upward pipeline. Corrosion Science, 50(11), 3005–3020. https://doi.org/10.1016/j.corsci.2008.08.006
- Zheng, G., Kellecher, B., Cao, G., Anderson, M., Allen, T., & Sridharan, K. (2015). Corrosion of 316 stainless steel in high temperature molten Li2BeF4 (FLiBe) salt. Journal of Nuclear Materials, 461(12), 143–150. https://doi.org/10.1016/j.jnucmat.2015.03.004