
 ?Mathematical formulae have been encoded as MathML and are displayed in this HTML version using MathJax in order to improve their display. Uncheck the box to turn MathJax off. This feature requires Javascript. Click on a formula to zoom.
Abstract
To find the influence of the suction chamber and throat inlet profiles on the cavitation performance of an annular jet pump (AJP), a numerical method using a combination of the realizable k–ϵ turbulence model and the Schnerr–Sauer cavitation model was applied. This paper comprehensively studied the cavitation performance of AJPs with a polygonal line profile (POL) and a streamlined profile (STR). The results showed that the pump efficiency (η) can be increasedby using the STR and the largest increase was 1.4%. Since the throat is smoothly connected with the suction chamber in the AJP with STR, flow separation and local low pressure did not appear. The critical flow rate ratio (qc) of the AJP with STR was higher than that of the AJP with POL, implying that the former had a wider normal working range. During critical working, the cavitation region in the AJP with STR was narrower than that of the AJP with POL. Importantly, the region of cavitation inception and development in the AJP with STR was closer to the downstream. Hence, it was concluded that the cavitation in the AJP with STR had less influence on the inner flow field.
1. Introduction
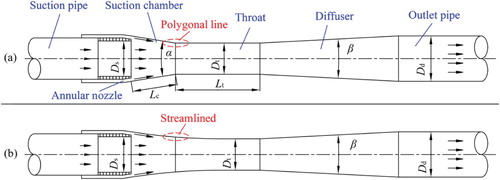
Jet pump fluid machinery is widely used in hydropower stations, the aerospace industry, chemical plants and other fields because of its advantage of having simple construction (Long et al., Citation2019). There are two most commonly used types of jet pump, namely the central jet pump (CJP) and the annular jet pump (AJP). An AJP is generally composed of a suction chamber, an annular nozzle, a throat, and a diffuser (Figure (a)). Since the flow passage of an AJP is unobstructed, it can be used for transporting liquid containing large solid particles, e.g. potatoes, onions, and fish (Xu et al., Citation2020). However, similar to other types of pump, different stages of cavitation can also occur in AJPs (Chao et al., Citation2019). Under a certain total primary flow pressure, the flow field will undergo cavitation inception and development, and severe cavitation conditions occur with decreasing outlet pressure.
Figure 1. AJPs with different suction chamber and throat inlet profiles: (a) POL; (b) STR.
Research has been carried out on cavitation in CJPs. For example, Ran and Katz (Citation1994) found that cavitation inception in CJPs appeared at the jet vortex center. Cai (Citation2005) studied cavitation inception in CJPs with four different nozzle sizes, and pointed out that cavitation in CJPs can be divided into vaporous cavitation and gaseous cavitation. Later work by Long et al. (Citation2009b) suggested further on the evidence of high-speed snapshots that cavitation in CJPs can be classified into four stages: the inception stage, the development stage, the intensive cavitation stage, and the intensive two-phase cavitation stage.
The effect of the main factors on the cavitation performance of AJPs has been widely reported. Shimizu et al. (Citation1987) experimentally studied the influence of different structural parameters, including the inclination angle, the area ratio, and the throat length, on the cavitation performance of AJPs. The study by Liu (Citation2007) suggested that a self-excited oscillation pulse nozzle could be used to improve the cavitation performance of AJPs. Xiao and Long (Citation2015a) and Xiao et al. (Citation2016) experimentally investigated cavitating flow in AJPs with three area ratios, especially cavitation inception and development and the shedding of cavity clouds. They pointed out that the cavitation in AJPs can be classified into three types: cavitation in the shearing layer, cavitation in the recirculation, and cavitation induced by primary flow separation, according to the cavitation mechanism. In addition, they further captured the various types of cavity cloud in the recirculation region using a high-speed camera, and found three types of cavity cloud, i.e. ribbon-like cavity clouds, annular cavity clouds, and merged cavity clouds, with growth of the recirculation region.
In the past decades, computational fluid dynamics (CFD) has been used in many fields (Akbarian et al., Citation2018; Aldaş & Yapıcı, Citation2014; Ghalandari et al., Citation2019; Mahdi et al., Citation2019; Salih et al., Citation2019). Significantly, this method has been demonstrated to be widely feasible in various systems and has also achieved good results (Geng & Escaler, Citation2019; Mohammad et al., Citation2019; Mou et al., Citation2017; Ramezanizadeh et al., Citation2019). Numerical methods have also been regarded as important for obtaining more information on cavitating flow in jet pumps. Based on the Unsteady Reynolds Averaged Navier–Stokes (URANS) equations, unsteady vapor–liquid two-phase cavitation in CJPs at different cavitation stages, including cavitation inception, cavitation development, and intensive cavitation, have been investigated numerically by Long et al. (Citation2010a). They found that the intensity of cavitation varied with the outlet pressure of the pump. In studies by Xiao et al. (Citation2014) and Xiao and Long (Citation2015b), the realizable k–ϵ turbulence model was used to investigate cavitation development in AJPs by combining it with the Schnerr–Sauer cavitation model. They pointed out that cavitation at the throat inlet has a significant impact on pump performance when the flow rate ratio is higher than 0.2. Later work by Liu et al. (Citation2019), using the Large Eddy Simulation (LES) numerical method, found that the fluctuation periods of cavitation with different flow rate ratios varied in CJPs with large area ratios.
Intensive research work has been mainly focused on the mechanism and stage of cavitation in AJPs. However, the study of structure optimization of AJPs and the performance improvement of cavitation has rarely been reported. In the early AJPs (e.g. AJPs with a polygonal line profile of the suction chamber and throat inlet), there was a corner at the conjunction part of the suction chamber and throat (Figure (a)) that would lead to a local low pressure and the separation of high-velocity primary flow. Xiao and Long (Citation2015a) pointed out that the cavitation in AJPs was mainly caused by primary flow separation at the throat inlet. Within this context, this work presented an AJP with a streamlined profile of the suction chamber and throat inlet to eliminate the above corner, as shown in Figure (b). According to previous studies (Wang et al., Citation2019), flow separation and local low pressure did not appear at the throat inlet in the above AJPs, as the primary flow could flow along the inner wall surface of the suction chamber and throat. But the influence of the streamlined profile on the cavitation performance of AJPs remained unclear.
Herein, this study mainly focuses on the influence of polygonal line profiles and streamlined profiles in suction chamber and throat inlet on the cavitation performance of AJPs. Flows in AJPs are simulated by the realizable k–ϵ turbulence model, which is combined with the Schnerr–Sauer cavitation model and the mixture multiphase model. Additionally, the traditional performance and cavitation performance of these AJPs are compared.
2. Numerical method
2.1. Physical model
POL and STR represent suction chambers and throat inlets having polygonal line profiles and streamlined profiles, respectively. AJPs with POL and STR are depicted separately in Figures (a) and (b). Three different area ratios m = 1.76, 2.22, and 3.05 were obtained by changing the annular nozzle inner diameter with a fixed throat diameter, and the main geometry parameters are given in Table .
Table 1. Dimensions of simulated AJPs.
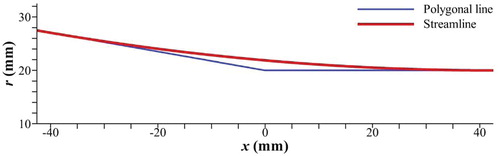
An arc streamline was used for the streamlined profile, in which the upstream and downstream are tangential to the outlet of the annular nozzle and throat, respectively. The equation of the streamlined profile is as follows:
(1)
(1) where Rc(x) is the radius of the AJP with STR at the coordinate x. Streamlined profiles are compared with polygonal line profiles in Figure .
Figure 2. Suction chamber and throat inlet profiles.
2.2. Governing equations
The calculation domain was set as two-dimensional axisymmetric to minimize the calculation cost, due to the rotational symmetry of the annular jet pump (Kwon et al., Citation2002; Xiao et al., Citation2014). Since the realizable k–ϵ turbulence model performs well on simulating circular jets and separation flow, and the cavitation in jet pumps is mainly sheet and cloud cavitation, the realizable k–ϵ model was used for calculation in this study by combining it with the Schnerr–Sauer cavitation and mixture multiphase models. Moreover, the performance and flow field of AJPs can also be simulated well by the above numerical method, according to studies by Xiao et al. (Citation2014) and Xiao and Long (Citation2015b).
In the mixture multiphase model, the multiphase fluids are assumed to be in pressure and velocity equilibrium. The mass and momentum conservation equations for the mixture can be expressed as
(2)
(2)
(3)
(3) where ui and fi are the velocity and body force in the i-direction, p is the pressure of the mixture, and μ and μt are the molecular viscosity and turbulent viscosity, respectively. The density of the mixture (ρm) is defined as
(4)
(4) where αv is the volume fraction of the vapor phase, and ρv and ρl are the densities of vapor and liquid, respectively.
In the Schnerr–Sauer cavitation model (Schnerr & Sauer, Citation2001), the number of bubbles per volume of liquid (nb) and the volume fraction of the vapor phase (αv) can be coupled by using the following equation:
(5)
(5) where RB is the radius of the bubble. The liquid–vapor mass transfer (evaporation and condensation) is governed by the vapor transport equation:
(6)
(6) where
and
represent the mass transfer related to the growth and collapse of cavitation bubbles, respectively.
Neglecting the effect of surface tension and the second-order terms, the Rayleigh–Plesset (Rayleigh, Citation1917) equation can be expressed as
(7)
(7) where pv is the saturated vapor pressure (= − 97.785 kPa, relative pressure). Combining Equations (5), (6), and (7), the source terms
and
can be defined as
(8)
(8) and
(9)
(9) The commercial CFD code ANSYS®-Fluent® was used for all simulations. This code can solve the coupling of the pressure and velocity by using the coupled algorithm. The second-order upwind scheme was applied to discretize the equations of momentum and turbulent kinetics. In addition, the PRESTO! and Quick schemes were employed for the pressure and transport equations of vapor mass fraction, respectively. The wall was treated by a scalable wall function and the time step in the simulation was 10−5 s. The calculation was assumed to have converged once all residuals were less than 1.0×10⁻⁶.
2.3. Mesh and boundary conditions
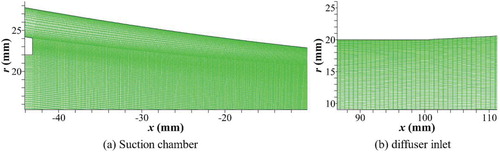
Figure shows the calculation domain, which comprises a suction pipe, a suction chamber, an annular nozzle, a throat, a diffuser, and an outlet pipe. In the calculation domain, the x-direction was downstream and the throat inlet was set as the origin, the r was radial. To ensure a stable flow, the lengths of the suction and outlet pipes were increased to 5Ds and 5Dd, respectively (Xu et al. Citation2018). As shown in Figure , the mesh of the suction chamber and throat inlet were refined due to the primary flow and entrained flow mixing accompanied by intensive pressure fluctuations and turbulence shearing.
Figure 3. Calculating domain.
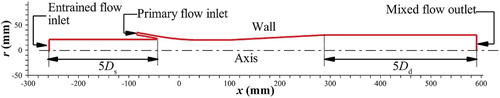
Figure 4. Mesh details.
The velocity inlet was set as the primary and entrained flow inlet, and the pressure outlet was set as the mixed flow outlet. The wall and the axis were no-ship and axisymmetric, separately. Different flow rate ratios could be obtained by varying the inlet velocity of the entrained flow, with a constant inlet velocity of the primary flow. The relative pressure system was used with an operating pressure of 101.325 kPa.
2.4. Mesh independence validation
The performance of AJPs can be evaluated by the area ratio (m), flow rate ratio (q), pressure ratio (h), and pump efficiency (η), as follows (Shimizu et al., Citation1987):
(10)
(10)
(11)
(11)
(12)
(12)
(13)
(13) where At and Aj represent the cross-sectional areas of the throat and the annular nozzle, respectively. Q and H represent the flow rate and total pressure of the fluid. Subscripts s, j, and c represent the entrained flow, the primary flow, and the mixed flow, separately.
Based on previous studies (Wang et al., Citation2019), the accuracy of the numerical method has been verified by comparing the numerical results with the experimental results from Shimizu et al. (Citation1987). In the initial calculation, the coarse mesh number was ∼ 35,000, then the cell number was increased in the radial and axial directions, respectively, and the mesh was refined in the suction chamber and throat. A medium mesh with ∼ 140,000 cells and a fine mesh with ∼ 260,000 cells were obtained. The grid independence was verified by using the pressure ratio of the AJP (m = 1.76). The pressure ratio versus mesh number data are presented in Table . It can be seen that the difference between the results of the coarse mesh and those of the other meshes is obvious, while the difference between the results of the medium mesh and those of the fine mesh is negligible. Therefore, the medium mesh with ∼ 140,000 cells was adopted.
Table 2. Sensitivity analysis based on the pressure ratio h (m = 1.76).
3. Results and discussion
3.1. Influence on traditional performance
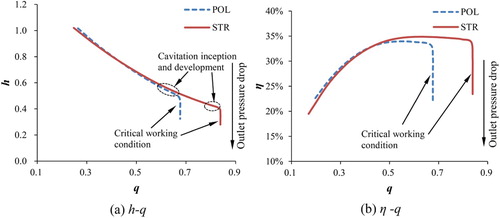
In the AJP with POL, there is local head loss at the throat inlet caused by flow separation of the high-velocity annular jet, due to the abrupt structure change. However, in the AJP with STR, the high-velocity annular jet could flow smoothly along the inner wall surface, which markedly reduces the energy loss and improves the efficiency of the jet pump. Figures (a) and (b) compare h and η of the AJPs (m = 2.22) at different q. The potential core of the primary flow was much shorter when q was less than 0.4, and there was little difference in η between the two AJPs. However, η of the AJP with STR was slightly higher than that of the AJP with POL (the largest difference is about 1%), because the potential core of the primary flow was longer when q was higher than 0.4. Additionally, in the AJP with POL, q had a maximum value of 0.68 when h droped to a certain value, as shown in Figure (a). At this time, q remained constant while η and h dropped abruptly with the decrease of the outlet pressure (pc), i.e. the critical working condition of the jet pump. The critical flow rate ratio (qc), which represents the range of normal working, is the maximum value of q. Usually, a higher qc implies a wider normal working range. As shown in Figure , qc of the AJP with STR was 0.84, which is obviously higher than that of the AJP with POL (qc = 0.68). Therefore, the AJP with STR had a wider range of normal working, in other words, the normal working range of AJP could be extended by using STR.
Figure 5. Comparison of h and η under different profiles (m = 2.22, Hj = 237.8 kPa).
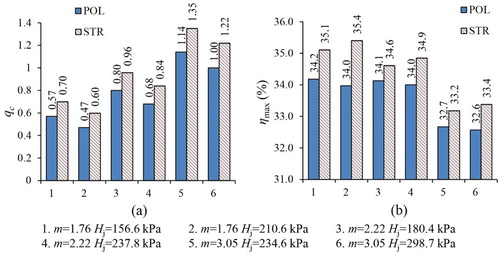
Since the cavitation performance of AJPs is related to the total pressure of the primary flow (Hj) (Long et al., Citation2009a), two different Hj’s were taken into account under various area ratios. Figure depicts the qc and ηmax of the AJPs under different m and Hj. The increase of qc represents the expansion of the normal working range. From Figure (a), it can be found that the AJP with STR always had a wider range of normal working than that with POL, especially under a large m. When m = 3.05 and Hj = 298.7 kPa, the difference of qc between STR and POL reached a maximum value of 0.22. In addition, it is seen that the ηmax of the AJP can be increased by using STR, especially under a low m, as shown in Figure (b). When m = 1.76 and Hj = 210.6 kPa, the increase of ηmax from POL to STR reached a maximum value of 1.4%.
Figure 6. Comparison of qc and ηmax under different m and Hj: (a) comparison of qc; (b) comparison of ηmax.
3.2. Influence on cavitation inception
The dimensionless cavitation number (σ) is adopted to describe the cavitation inception and development in the jet pump, which is defined as
(14)
(14) where p is the static pressure, u is the average flow velocity, and the subscript n represents the nozzle exit.
The moment that the cavitation inception appears in the flow system, the σ can be defined as σi (Franc & Michel, Citation2005). Figure shows the cavitation inception at the throat inlet of the AJP captured by Xiao and Long (Citation2015a). It can be seen that some small bubbles are generated near the wall of the throat inlet. The moment that some small bubbles are immediately generated, separate and collapse is defined as cavitation inception.
Figure 7. Cavitation inception at the throat inlet of early AJPs (Xiao & Long, Citation2015a).
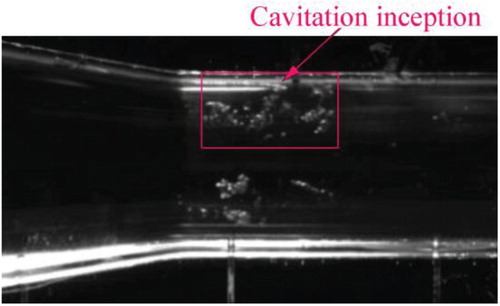
Figures and show the pressure distribution and the time-averaged vapor-phase distribution at q = 0.83 (m = 3.05, Hj = 234.6 kPa), respectively. In the AJP with POL, a local low pressure with a minimum pressure of − 97.75 kPa (relative pressure) near the throat inlet wall was observed, due to the flow separation and vortex. Meanwhile, cavitation appeared at the throat inlet and the maximum vapor volume fraction was 54.5%, as shown in Figure (a). On the contrary, since the high-velocity primary flow could flow smoothly along the wall of the AJP with STR at the same q, there was no such local low pressure and cavitation occurred in the pump, as shown in Figure (b) and Figure (b). Additionally, the cavitation regions (Figure (a)) simulated by the numerical method are generally consistent with the experimental results (Figure ), indicating that this numerical method could be used for simulation of the cavitation region in AJPs.
Figure 8. Pressure distribution (m = 3.05, q = 0.83, Hj = 234.6 kPa).
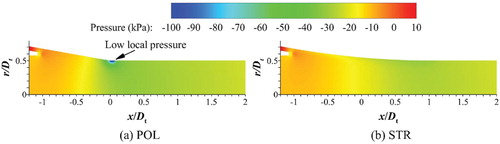
Figure 9. Vapor-phase distribution at the throat inlet (m = 3.05, q = 0.83, Hj = 234.6 kPa).
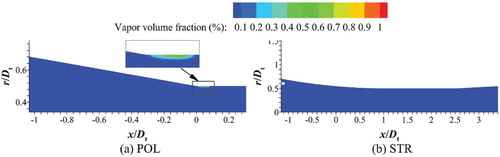
Figure depicts the pressure distributions along the wall of the AJP at various values of q (m = 3.05). The pressure coefficient (Cp) is used to characterize the pressure distribution as follows:
(15)
(15)
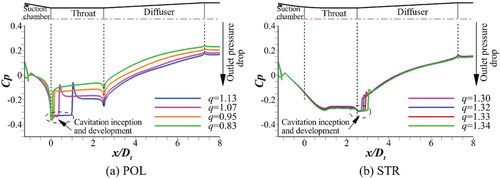
Figure 10. Cp along the inner wall under different q (m = 3.05, Hj = 234.6 kPa).
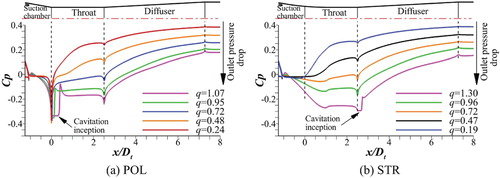
In the AJP with POL, a steep drop of Cp appeared at the throat inlet, due to the local low pressure. Notably, when q was 1.07, Cp sharply dropped to a minimum value and then remained nearly unchanged, indicating that cavitation had occurred at this region, as shown in Figure (a). However, when the STR was adopted in the AJP, the above phenomenon did not appear at the throat inlet, as shown in Figure (b). Rather, Cp slightly declined at the diffuser inlet in the two AJPs. Nevertheless, the AJP with STR exhibited a nearly constant Cp at the diffuser inlet at q = 1.30, as shown in Figure (b). The above phenomenon could also be found at m = 1.76 and 2.22, and three cavitation stages including cavitation inception, development, and the critical working condition also occurred in the AJP with STR. The influence of STR on the cavitation stages, cavitation performance, and the flow field of thepump are discussed in the following sections.
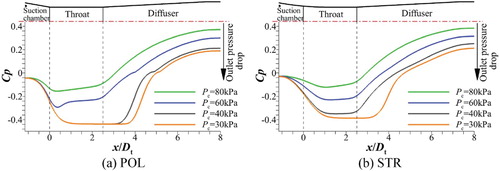
The pressure distributions along the axis of AJPs (m = 1.76) under different pc are shown in Figure . When pc was 80 kPa, the minimum Cp was observed at the throat inlet in the AJP with POL, while it appeared in the middle part of the throat (x/Dt = 1) in the AJP with STR. When pc dropped to 60 kPa, the distribution of Cp exhibited an obvious depression at the throat inlet, because the low-pressure region near the throat inlet wall expanded to the axis with decreasing pc in the AJP with POL. On the contrary, no depression occurred in the AJP with STR, since there was no local low pressure at the throat inlet. When pc dropped further to 40 kPa, Cp remained nearly constant regardless of the decreasing pc, indicating that the AJP with POL was running under the critical working condition at this moment. However, Cp could decline with decreasing pc in the AJP with STR.
Figure 11. Cp along the axis under different pc (m = 1.76, Hj = 210.6 kPa).
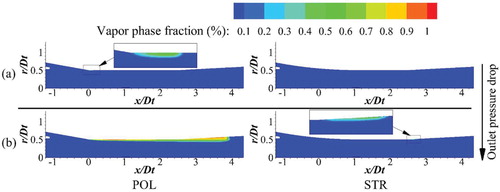
When pc was 80 kPa, cavitation inception appeared near the throat inlet wall in the AJP with POL, while no cavitation occurred in the AJP with STR, as shown in Figure (a). When pc dropped to 40 kPa, the AJP with POL worked under the critical working condition, while cavitation just appeared at the diffuser inlet of the AJP with STR, as shown in Figure (b). Therefore, it can be concluded that cavitation would only appear in the AJP with STR under a lower pc.
Figure 12. Vapor-phase distribution (m = 1.76, Hj = 210.6 kPa): (a) pc = 80 kPa; (b) pc = 40 kPa.
Under the cavitation inception stage in this study, q is defined as qi. Table summarizes the qi and the σi of AJPs under different m and Hj. It can be seen that the qi of the AJP with STR is higher than that of the AJP with POL. In particular, the differences between STR and POL in AJPs are more obvious at larger m’s, and the largest difference in qi is 0.50 (m = 3.05, Hj = 298.7 kPa). In other words, the AJP with STR could normally work under a lower pc without cavitation occurring, and it also had a better cavitation performance. Meanwhile, at the same m and Hj, the σi of the AJP with STR was lower than that of the AJP with POL, also showing that the former had a better cavitation performance.
Table 3. Comparison of qi and σi under different m and Hj.
3.3. Influence on cavitation development
Figure shows the pressure distributions along the wall of AJPs (m = 3.05, Hj = 234.6 kPa) under the conditions of cavitation inception and development. It can be found that different profiles of the suction chamber and throat inlet had a significant influence on the wall pressure distribution, especially at the throat inlet and diffuser. Under the condition of cavitation development, Cp dropped to a minimum value at the throat inlet and then remained nearly constant in the throat of the AJP with POL, as shown in Figure (a). However, Cp declined to a minimum value at the diffuser inlet and remained unchanged in the diffuser of the AJP with STR, as shown in Figure (b).
Figure 13. Cp along the inner wall in the cavitation inception and development stage (m = 3.05, Hj = 234.6 kPa).
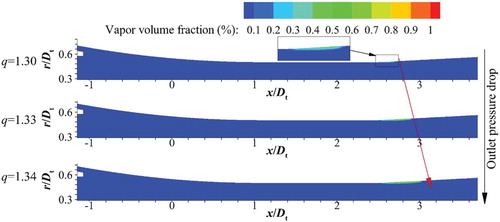
Due to the different regions of cavitation inception, the cavitation developments were also different in the two AJPs. In the AJP with POL, cavitation initially appeared at the throat inlet and then developed in the throat with decreasing pc, as shown in Figure . However, in the AJP with STR, cavitation initially appeared at the diffuser inlet and developed in the diffuser (Figure ). Because of the high-velocity gradient and intensive energy exchange in the throat of AJP (Long et al., Citation2010b), the cavitation in the throat generally has a remarkable influence on the flow field and the performance of pump. In addition, since the velocity in the diffuser is slower than that of the throat and also more uniformly distributed, the cavitation in the diffuser had little influence on the pump performance than that in the throat.
Figure 14. Vapor-phase distribution in the cavitation inception and development stage (POL, m = 3.05, Hj = 234.6 kPa).
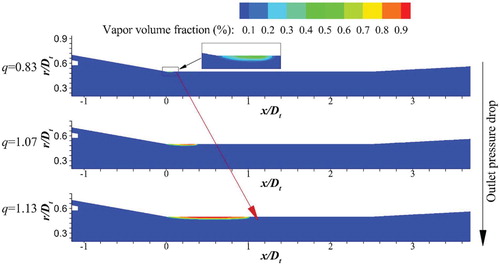
Figure 15. Vapor-phase distribution in the cavitation inception and development stage (STR, m = 3.05, Hj = 234.6 kPa).
3.4. Influence on critical working condition
In the early AJPs, cavitation occurred and developed with increasing Qs and decreasing pressure in the throat under a certain Hj. When pc dropped to a certain value, large numbers of cavity clouds would be generated and developed in the throat and then fill the flow passage. At this moment, cavitation in the throat was extremely intense and this condition was regarded as the critical working condition of the jet pump, in which the q of the jet pump remained at its maximum value (qc), regardless of decreasing pc. With further decrease of pc, cavity clouds would extend into the diffuser. These large numbers of cavity clouds would collapse in the diffuser when suffering from high pressure. Consequently, strong noise and vibration would be produced and the η of the pump would decline sharply. At this time, σ remained at its minimum value, i.e. the critical cavitation number (σc) of the jet pump. Table summarizes the σc at different m and Hj. At the same m and Hj, σc of the AJP with POL was higher than that of the AJP with STR. This indicates that the AJP with POL was more vulnerable to the critical working condition, since the critical working condition was unfavorable to the normal working of the AJP. On the contrary, the AJP with STR could normally work under a lower outlet pressure without the occurrence of a critical working condition, implying that the use of STR could broaden the normal working range of the AJP.
Table 4. Comparison of σc.
Figure depicts the wall pressure distributions of AJPs under the critical working condition (m = 3.05, Hj = 298.7 kPa). In the AJP with POL, Cp first declined to a minimum value at the throat inlet and then remained nearly constant in the throat and the diffuser inlet. Here, the section with a minimum Cp was the cavitation region. After that, with the collapse of the cavity cloud and the recovery of mixed flow pressure in the diffuser, Cp would increase along the wall of the diffuser. However, in the AJP with STR, Cp declined to a minimum value at the middle part of the throat (x/Dt = 1), and the changes of Cp in the diffuser were similar to those in the AJP with POL. In addition, a similar phenomenon could also be found under m = 1.76 and 2.22 according to the calculation results.
Figure 16. Cp along the inner wall under the critical working condition (m = 3.05, Hj = 298.7 kPa).
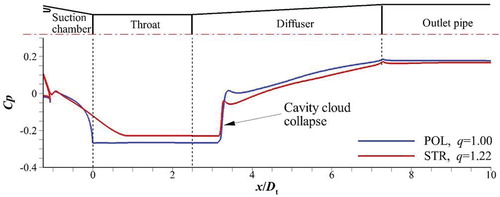
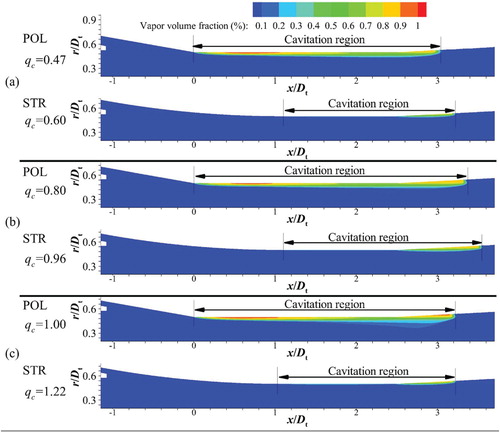
Figure shows the time-averaged vapor-phase distribution under the critical working condition. A significant difference can be observed in the cavitation region between the two AJPs. In the AJP with POL, the cavity cloud expanded from the throat inlet to the diffuser. However, in the AJP with STR, the cavity cloud expanded from the middle part of the throat to the diffuser. The collapse location of the cavity cloud in these AJPs were approximately the same, hence the cavitation region of the AJP with POL was larger than that of the AJP with STR, as shown in Figure . Since the mixing of primary and entrained flow at the throat inlet was much fiercer in the AJP with POL, the cavitation in the AJP with POL would have a greater influence on the flow field of the pump, compared to that in the AJP with STR. Therefore, it can be concluded that the cavitation region of the AJP with STR was smaller and its influence on the flow field of the pump was much less during the critical working condition.
Figure 17. Vapor-phase distribution under the critical working condition: (a) m = 1.76, Hj = 210.6 kPa; (b) m = 2.22, Hj = 180.4 kPa; (c) m = 3.05, Hj = 298.7 kPa.
4. Conclusion
Since high-speed primary flow usually flows along the inner wall surface of the suction chamber and throat in AJPs, the inner wall geometry might have a great influence on the traditional performance and cavitation performance. The numerical simulation of cavitating flow in AJPs with different suction chamber and throat inlet profiles were carried out by using the realizable k–ϵ model combined with the Schnerr–Sauer model. The polygonal line profile (POL) and the streamlined profile (STR) were compared based on the traditional performance and the cavitation performance. The results are as follows.
At a high flow rate ratio, using STR could improve the traditional performance of an AJP, especially under a small area ratio (m). When m = 1.76, the increase of ηmax reaches a maximum value of 1.4%. However, the influence of the STR on the traditional performance is less under a relatively lower flow rate ratio.
In the AJP with STR, no local low pressure was observed because of the smooth connection between the suction chamber and the throat. In addition, the AJP with STR could normally work under a relatively low outlet pressure without cavitation occurrence, showing a better cavitation performance than the AJP with POL.
The critical flow rate ratio (qc) of the AJP with STR is higher than that of the AJP with POL, implying a wider range of normal working in the AJP with STR. Moreover, the difference of qc increased with increasing area ratio. When m = 3.05, the increase in qc reaches the maximum value of 0.22.
In the AJP with POL, cavitation occurred initially at the throat inlet and then developed in the throat, which exhibited a great influence on the inner flow field. However, in the AJP with STR, cavitation appeared initially at the diffuser inlet and then developed in the diffuser, which had less influence on the inner flow field.
The cavity cloud mainly appeared at the diffuser inlet of the AJP with STR, and the cavitation region was relatively narrower during critical working, indicating little influence of cavitation on the flow field of the AJP with STR.
In this study, the AJP with STR achieved a better traditional performance and cavitation performance than the AJP with POL, providing a scientific basis for the structure optimization of AJPs and performance improvement. However, more work is still necessary in the future. Owing to the axisymmetric characteristics of the flow field of jet pumps, this study investigated a 2D axisymmetric model, but some 3D effects of cavitation were ignored.
Disclosure statement
No potential conflict of interest was reported by the authors.
Additional information
Funding
References
- Akbarian, E., Najafi, B., Jafari, M., Faizollahzadeh Ardabili, S., Shamshirband, S., & Chau, K. (2018). Experimental and computational fluid dynamics-based numerical simulation of using natural gas in a dual-fueled diesel engine. Engineering Applications of Computational Fluid Mechanics, 12(1), 517–534. https://doi.org/10.1080/19942060.2018.1472670
- Aldaş, K., & Yapıcı, R. (2014). Investigation of effects of scale and surface roughness on efficiency of water jet pumps using CFD. Engineering Applications of Computational Fluid Mechanics, 8(1), 14–25. https://doi.org/10.1080/19942060.2014.11015494
- Cai, B. H. (2005). Analysis and experimental study on incipient cavitation within jet pumps. Wuhan University. (in Chinese).
- Chao, Q., Zhang, J. H., Xu, B., Huang, H., & Zhai, J. (2019). Effects of inclined cylinder ports on gaseous cavitation of high-speed electro-hydrostatic actuator pumps: A numerical study. Engineering Applications of Computational Fluid Mechanics, 13(1), 245–253. https://doi.org/10.1080/19942060.2019.1576545
- Franc, J. P., & Michel, J. M. (2005). Fundamentals of cavitation. Fluid Mechanics and its Applications, 76, 11–24. https://doi.org/10.1007/1-4020-2233-6
- Geng, L. L., & Escaler, X. (2019). Assessment of RANS turbulence models and Zwart cavitation model empirical coefficients for the simulation of unsteady cloud cavitation. Engineering Applications of Computational Fluid Mechanics, 14(1), 151–167. https://doi.org/10.1080/19942060.2019.1694996
- Ghalandari, M., Mirzadeh Koohshahi, E., Mohamadian, F., Shamshirband, S., & Chau, K. W. (2019). Numerical simulation of nanofluid flow inside a root canal. Engineering Applications of Computational Fluid Mechanics, 13(1), 254–264. https://doi.org/10.1080/19942060.2019.1578696
- Kwon, O. B., Kim, M. K., Kwon, H. C., & Bae, D. S. (2002). Two-dimensional numerical simulations on the performance of an annular jet pump. Journal of Visualization, 5(1), 21–28. https://doi.org/10.1007/BF03182599
- Liu, H. X. (2007). Study of cavitation mechanism and its improvement for the annular jet pump. Chongqing University. (in Chinese).
- Liu, M., Zhou, L. J., & Wang, Z. W. (2019). Numerical investigation of the cavitation instability in a central jet pump with a large area ratio at normal cavitating conditions. International Journal of Multiphase Flow, 116, 153–163. https://doi.org/10.1016/j.ijmultiphaseflow.2019.04.014
- Long, X. P., Cheng, Q., Han, N., Cai, B. H., & Wang, F. J. (2010a). Numerical simulation on cavitating flow within jet pump. Journal of Drainage and Irrigation Machinery Engineering, 28(1), 7–11+17. (in Chinese).
- Long, X. P., Cheng, Q., & Han, N. (2009a). Numerical analysis on the factors affecting cavitation within jet pumps. Journal of Basic Science and Engineering, 17(3), 461–469. (in Chinese )
- Long, X. P., Yan, H. F., Zhang, S. Y., & Yao, X. (2010b). Numerical simulation for influence of throat length on annular jet pump performance. Journal of Drainage & Irrigation Machinery Engineering, 28(3), 198–206. (in Chinese )
- Long, X. P., Yao, H., & Zhao, J. (2009b). Investigation on mechanism of critical cavitating flow in liquid jet pumps under operating limits. International Journal of Heat and Mass Transfer, 52(9-10), 2415–2420. https://doi.org/10.1016/j.ijheatmasstransfer.2008.11.018
- Long, X. P., Zuo, D., Cheng, H. Y., & Ji, B. (2019). Large eddy simulation of the transient cavitating vortical flow in a jet pump with special emphasis on the unstable limited operation stage. Journal of Hydrodynamics, 32(2), 345–360. https://doi.org/10.1007/s42241-019-0034-0
- Mahdi, R., Mohammad, A. N., Mohammad, H. A., & Chau, K. W. (2019). Experimental and numerical analysis of a nanofluidic thermosyphon heat exchanger. Engineering Applications of Computational Fluid Mechanics, 13(1), 40–47. https://doi.org/10.1080/19942060.2018.1518272
- Mohammad, G., Elaheh, M. K., Mohamadian, F., Shamshirband, S., & Chau, K. W. (2019). Numerical simulation of nanofluid flow inside a root canal. Engineering Applications of Computational Fluid Mechanics, 13(1), 254–264. https://doi.org/10.1080/19942060.2019.1578696
- Mou, B., He, B. J., Zhao, D. X., & Chau, K. W. (2017). Numerical simulation of the effects of building dimensional variation on wind pressure distribution. Engineering Applications of Computational Fluid Mechanics, 11(1), 293–309. https://doi.org/10.1080/19942060.2017.1281845
- Ramezanizadeh, M., Alhuyi Nazari, M., Ahmadi, M. H., & Chau, K. (2019). Experimental and numerical analysis of a nanofluidic thermosyphon heat exchanger. Engineering Applications of Computational Fluid Mechanics, 13(1), 40–47. https://doi.org/10.1080/19942060.2018.1518272
- Ran, B., & Katz, J. (1994). Pressure fluctuations and their effect on cavitation inception within water jets. Journal of Fluid Mechanics, 262(-1), 223–263. https://doi.org/10.1017/S0022112094000492
- Rayleigh, L. (1917). On the pressure developed in a liquid during the collapse of a spherical cavity. Philosophical Magazine, 34, 94–98. https://doi.org/10.1080/14786440808635681
- Salih, S. Q., Aldlemy, M. S., Rasani, M. R., Ariffin, A. K., Ya, T. M. Y. S. T., Al-Ansari, N., Yaseen, Z. M., & Chau, K. W. (2019). Thin and sharp edges bodies-fluid interaction simulation using cut-cell immersed boundary method. Engineering Applications of Computational Fluid Mechanics, 13(1), 860–877. https://doi.org/10.1080/19942060.2019.1652209
- Schnerr, G. H., & Sauer, J. (2001). Physical and numerical modelling of unsteady cavitation dynamics. In Fourth International Conference on Multiphase Flow, New Orleans, USA.
- Shimizu, Y., Nakamura, S., Kuzuhara, S., & Kurata, S. (1987). Studies of the configuration and performance of annular type jet pumps. Journal of Fluids Engineering, 109(3), 205–212. https://doi.org/10.1115/1.3242649
- Wang, X. D., Chen, Y. L., Zhao, Y., Xu, Y., & Wang, B. (2019). Influence of suction chamber profile on flow field of annular jet pump. IOP Conference Series: Earth and Environmental Science, 304(3), 032088. https://doi.org/10.1088/1755-1315/304/3/032088
- Xiao, L. Z., & Long, X. P. (2015a). Cavitating flow in annular jet pumps. International Journal of Multiphase Flow, 71, 116–132. https://doi.org/10.1016/j.ijmultiphaseflow.2015.01.001
- Xiao, L. Z., & Long, X. P. (2015b). Influence of inclined angle on cavitation performance of annular jet pump. Journal of Zhejiang University (Engineering Science Edition), 49(1), 123–129. (in Chinese )
- Xiao, L. Z., Long, X. P., Lyu, Q., Hu, Y., & Wang, Q. Q. (2014). Numerical investigation on the cavitating flow in annular jet pump under different flow rate ratio. IOP Conference Series: Earth and Environmental Science, 22(5), 052001. https://doi.org/10.1088/1755-1315/22/5/052001
- Xiao, L. Z., Long, X. P., & Zhang, J. Q. (2016). Shear cavitation in an annular jet pump under recirculation conditions. Journal of Fluids Engineering, 138(6), 061303. https://doi.org/10.1115/1.4032487
- Xu, M. S., Long, X. P., Mou, J. G., Wu, D. H., Zhou, P. J., & Gu, Y. Q. (2020). Impact of pressure gradients on fish scales in a jet fish pump. Biosystems Engineering, 191, 27–34. https://doi.org/10.1016/j.biosystemseng.2019.12.014.
- Xu, M. S., Yang, X. L., Long, X. P., Lyu, Q., & Ji, B. (2018). Numerical investigation of turbulent flow coherent structures in annular jet pumps using the Les method. Science China Technological Sciences, 58(5), 1–12. https://doi.org/10.1007/s11431-017-9047-8.